GOLD → Distribution. There is potential for growth to 3450–3500FX:XAUUSD breaks through consolidation resistance and forms a distribution pattern. A breakout of 3345-3358 could lead to another rally amid high economic risks...
Gold is rising for the third day in a row amid growing concerns about new tariffs announced by Trump. He threatened to impose tariffs on Canada and most of its trading partners, as well as the EU. Despite the strengthening of the dollar, demand for gold remains strong due to uncertainty and expectations for US inflation data next week. Investors are cautious ahead of CPI and the Fed's possible response
The correlation between gold and the dollar is declining, with gold rising due to geopolitical reasons amid high economic risks.
If the bulls keep the price above 3300-3345, the market could be extremely positive for 3400-3500.
Resistance levels: 3345, 3358
Support levels: 3330, 3308
Gold has broken through the resistance of the “triangle” consolidation pattern and is forming a distribution phase towards the zone of interest 3345 - 3358, from which a small correction may form before growth. Since 3345 is an intermediate level, the focus is on 3358. I do not rule out the possibility of a long squeeze of the support levels 3330, the triangle support, and 3310 before the growth continues.
Best regards, R. Linda!
Symmetrical Triangle

DOGE/USDT – Is Dogecoin About to Ignite Altseason Again?Hey Traders!
If you’re finding value in this analysis, smash that 👍 and hit Follow for high-accuracy trade setups that actually deliver!
Dogecoin just broke out of a multi-month descending wedge — and history tells us to pay close attention when this meme king wakes up. Let’s dive into why this setup could be the start of something massive.
📈 Chart Pattern
DOGE has been consolidating for months inside a falling wedge — a classic bullish reversal structure. It’s now finally broken out with strong volume confirmation, holding above the 50 EMA and showing signs of momentum building up.
🔍 Historical Clue
Remember what happened in the previous bull markets?
✅ 2021: DOGE exploded 2000%+ and triggered the craziest altseason ever.
✅ 2017: DOGE moved first, followed by hundreds of altcoins rallying massively.
Now, in 2025 — it looks eerily similar. Every time DOGE wakes up, it signals that retail and meme sentiment is heating up, a classic altseason ignition.
🎯 Trade Setup
Entry: $0.198 (Already triggered)
Targets:
TP1: $0.28
TP2: $0.42
TP3: $0.64
Stoploss: $0.162
Risk-Reward: Massive upside potential, with clearly defined invalidation.
💡 Final Thoughts
Altcoins are starting to follow. ETH has broken out. XRP is running. BTC dominance has rejected trendline resistance. Everything is aligning. If history repeats, this breakout in DOGE could mark the official start of Altseason 2025.
👉 Don’t sleep on DOGE. This might just be the trigger we’ve been waiting for.
📌 Follow for more setups & insights. Stay tuned!

ETHEREUM BREAKOUT CONFIRMED!Hey Traders!
If you’re finding value in this analysis, smash that 👍 and hit Follow for high-accuracy trade setups that actually deliver!
After months of consolidation inside this massive symmetrical triangle, ETH finally breaks out on the daily chart—and this could be the spark for the next major rally! 🔥
📈 Structure: Symmetrical Triangle
✅ Breakout Confirmed
📍 CMP: ~$2,760
🎯 Next Major Target: $5,000+
This is the breakout bulls have been waiting for! If momentum sustains, ETH could enter price discovery territory soon. Buckle up—the real move might just be beginning. 🚀
Let’s see how far it runs from here!
Drop your targets in the comments 👇

EUR/USD: A High-Probability Short Setup at 1.1829At its core, this trade is driven by a powerful and growing divergence between the US and European economies. While technicals tell us where to trade, fundamentals tell us why we're trading.
1️⃣ The Interest Rate Gap: The U.S. currently offers significantly higher interest rates (4.25% - 4.50%) compared to the Eurozone (2.15%). This makes holding the US Dollar more attractive, creating natural downward pressure on the EUR/USD.
2️⃣ Central Bank Policy: The US Federal Reserve remains hawkish, focused on strength and fighting inflation. Meanwhile, the European Central Bank is dovish, signaling a willingness to keep conditions loose to support a weaker economy.
3️⃣ Labor Market Strength: The US enjoys a robust labor market with unemployment at just 4.1%, while the Eurozone's is significantly higher at 6.3%. This points to a stronger US economy.
In simple terms, the US economy is strong, and its central bank is acting like it. The Eurozone economy is weaker, and its central bank is acting accordingly. This fundamental imbalance is the fuel for a potential significant move down in EUR/USD.
The Technical Picture: The Wall at 1.1829
As you can see on the 4H chart, the price has run into a major wall of resistance at the 52-week high of 1.1829 . After a long uptrend, the momentum has stalled, and the price is now consolidating inside a symmetrical triangle . This coiling of price action often precedes a strong breakout.
Our strategy is not to guess the breakout, but to act on a high-probability retest of resistance. We are looking to enter a short position as the price pulls back towards the upper boundary of this triangle, anticipating a failure at resistance and a subsequent break to the downside.
The Actionable Trade Plan
This setup offers an excellent risk/reward profile.
📉 Asset: EUR/USD
👉 Entry (Limit Sell): 1.1780
⛔️ Stop Loss: 1.1850
🎯 Take Profit: 1.1600
📈 Risk/Reward Ratio: ~2.57:1
Trade safe and manage your risk.

Titan at Best Support Zone !! This is the 4 hour chart of Titan Company.
Titan having a good support zone near 3400-3460 level.
If this level is sustain , then we may see higher prices in Titan company.
Thank You !!

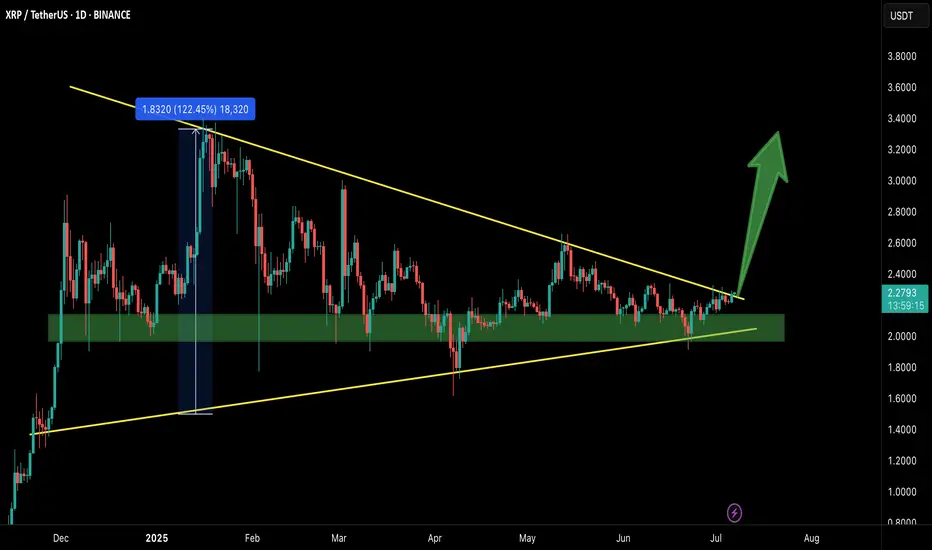
XRP/USDT – Breakout Confirmed!Hey Traders — if you're into high-conviction setups with real momentum, this one’s for you.
XRP has finally broken out from the massive symmetrical triangle on the 1D timeframe after holding the green support zone like a champ.
This structure has been compressing for months, and with this breakout, momentum could be shifting in favor of the bulls.
Entry: Current Market Price (CMP)
Add More: On dips above $2.20
Targets: $2.60 / $2.95 / $3.40 / $3.80
Stop Loss: $2.05
Leverage: 5x–10x
As long as price stays above the breakout zone, this setup holds strong potential. Keep a close eye for volume confirmation and follow-through.
Let’s see how this plays out. Will update as it unfolds.
JSWSTEEL ' S Key Level | Big Breakout !This is the 4 hour chart of JSW STEEL.
JSWSTEEL having a good pattern support zone near at 980-1000 level .
JSW Steel has formed a Symmetrical Triangle pattern on the chart, and a breakout has occurred. The stock may retested the breakout level and then appears poised to move toward its projected target at 1180 - 1200 .
If the support zone level is sustain , then we may see higher prices in JSW Steel.
Thank You !!

Symmetrical Triangle in EURCHF —Fundamental & Technical AnalysisToday, I want to examine the EURCHF ( FX:EURCHF ) Short position opportunity from both a Fundamental and Technical perspective.
First, let’s examine the EURCHF pair from a fundamental perspective:
The ECB’s dovish policy stance and weakening Eurozone data contrast sharply with the Swiss Franc’s safe-haven appeal and economic stability. With geopolitical tensions in the background, EURCHF may continue to slide lower, supporting short positions.
In terms of technical analysis , EURCHF is moving near a Heavy Resistance zone(0.967 CHF-0.940 CHF) .
In terms of Classical Technical Analysis , EURCHF is moving inside a Symmetrical Triangle Pattern . The point to note about this example is that every time EURCHF approaches the upper lines of the symmetrical triangle , it starts to decline with a lot of momentum . And considering the previous movement of EURCHF, which was bearish, it is better to look for short positions from inside the symmetrical triangle.
Based on the above explanation , I expect EURCHF to move back towards the lower lines of the symmetrical triangle pattern .
Note: Stop Loss(SL): 0.94120 CHF
Please respect each other's ideas and express them politely if you agree or disagree.
Euro/Swiss Franc Analyze (EURCHF), 4-hour time frame.
Be sure to follow the updated ideas.
Do not forget to put a Stop loss for your positions (For every position you want to open).
Please follow your strategy and updates; this is just my Idea, and I will gladly see your ideas in this post.
Please do not forget the ✅' like '✅ button 🙏😊 & Share it with your friends; thanks, and Trade safe.

SP500 - Cycle Analysis; New V-Bottom24 Dec 2018 - V-Bottom Trough:
This marks a clean V-bottom. Both the 227-ROC and 114-ROC showed simultaneous positive acceleration after price reacing its low. Shortly after, both crossed their 57-SMA almost in sync — increasing the probability of a sustained bullish move. Price confirmed this by breaking resistance and forming a V pattern. This was further validated by the centered moving average crossover (114-CMA crossing above 227-CMA).
25 Mar 2020 - Deep COVID Crash Trough:
During this phase the priced broke below the support, creating a deep trough. Altough both ROC lines initially showed strong negative acceleration due to the COVID-19 crash, they soon reversed above their 57-SMAs, signaling a major shift in momentum. This coincided with the price breaking above the key resistance which was also crossed in 2019 when confirming the old V-pattern. After this breakout, a brief pullback followed before the uptrend resumed with increasing strength.
22 Jun 2021 to 19 Dec 2023 - Pattern
During the initial period a bearish divergence was visible in the ROC, nevertheless price and rate of change both declined making a low in early October 2022. A technical pattern began to form, which appears to align more closely with a symmetrical triangle; So when measuring its height and projecting it from the breakout point aligns with the new all-time highs that were reached on 27 June 2025.
21 Mar 2025 - New Cycle Trough
A new V-bottom formed shortly after the current cycle began. Both ROC indicators had already crossed their SMAs to the upside, showing early signs of positive acceleration, days before of price broke through the resistance and reached the new record high.
The 227-SMA is likely to cross from below the fast SMA while a possibility of a pullback increase.
Following that, the 114-CMA will probably has the chance to cross back the 227-CMA, with the price potentially confirming a new support level and resuming its uptrend - in line with the broader cycle timeline.

|Symmetrical Triangle| Squeeze in Crude OilCrude oil is currently forming a symmetrical triangle pattern, a classic squeeze formation with price compressed into a tight range. Symmetrical triangles typically act as continuation patterns, favoring the prevailing trend, and in this case, on the daily chart, the trend is well established: a bullish trend with high volume. As the dominant trend is clearly bullish, and volume has remained relatively high throughout the consolidation, it supports furthermore the potential for continuation to the upside.
On the Bollinger band the squeeze is more visible, and suggests diminishing volatility, which is often followed by expansion. Unlike earlier price action before consolidation, recent sessions are exhibiting larger candlestick bodies accompanied by pronounced wicks on both ends. Meaning adding confluence to our potential breakout. These conditions create a buildup of potential momentum in the market, exactly what fuels explosive breakouts when key levels are breached.
Though such pattern can also serve as a reversal signal when broader macro conditions shift.
But, and this is a big but, beyond the chart, the geopolitical context is intensifying. The Israel-Iran conflict continues to escalate, and with the most recent reports of direct US involvement, that is the strikes on Iranian nuclear infrastructure, the risk on crude oil is rising. The possibility of Iranian retaliation, introduces serious potential for supply disruption, as any military response or blockade would likely trigger a sharp spike in the price.
This confluence of technical breakout potential and geopolitical instability makes this setup particularly potent. If we get a confirmed breakout above the triangle and a clean close above the 77–79 zone, combined with global uncertainty and potential supply shocks, could put the $84-85 target well within reach in the near term. Beyond that, should geopolitical tension escalate, oil could accelerate toward $90 or even $100.
In short, this is a high-stakes moment. If price does break out, it won’t just be a technical move, it will ride a wave of volume, volatility, and geopolitical narrative.
With all this in mind, one should be watching closely for volume confirmation, breakout structure, and any major headlines from the Middle East as the situation develops.

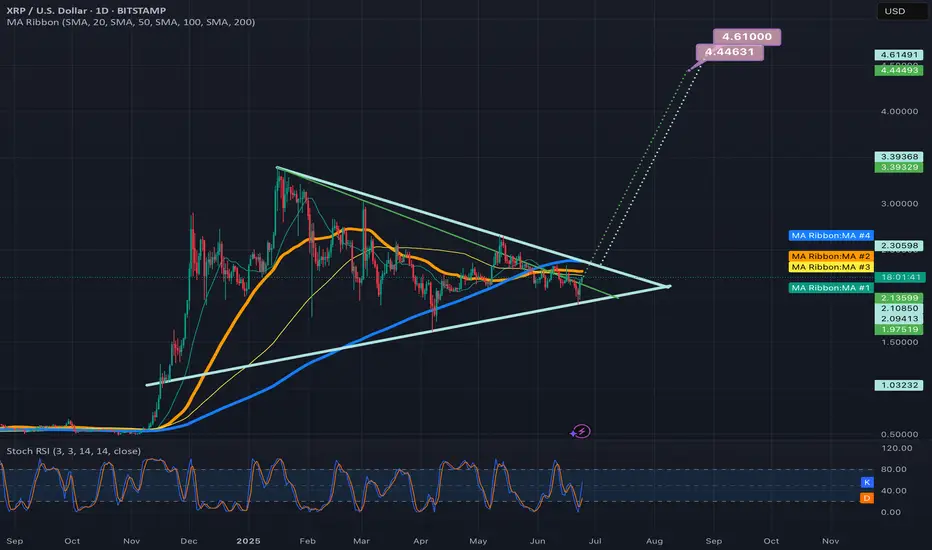
2 potential breakout targets for the symmetrical triangle on xrpDepends on if the green trendline is the more valid top trendline or the light blue one is. *not financial advice*
M&M FIN. SERVICE LTD at Key Zone this is the Daily chart of M&M FIN. SERVICE LTD
M&MFIN having a good law of polarity at 255-260 level .
If this level is sustain ,then we may see higher prices in M&MFIN and if stock sustain below this level then M&MFIN will touch it's support zone 240 level.
Thank you !!

USOIL Bullish breakout from symmetrical triangle pattern🚨 USOIL Breakout Alert! 🚨
1H Time Frame | Symmetrical Triangle Breakout
Crude oil (USOIL) has broken out bullishly from a symmetrical triangle pattern — confirming strong upward momentum. 📈
🎯 Entry Level: 74.20
📍 Technical Targets:
1st Resistance: 75.70
2nd Resistance: 76.80
This setup signals a potential continuation of bullish momentum. Keep an eye on volume confirmation and price action near resistance levels.
💬 Drop your thoughts in the comments!
📲 Like, follow, and join us for more real-time market insights.
Trade smart
,
– Livia 😜

BITCOIN → Possibility of retesting 100K. Buyer weakeningBINANCE:BTCUSDT.P is in consolidation after the rally stalled due to the exhaustion of the bullish driver. The price updates local lows and starts looking at 100K
Bitcoin is under pressure after the escalation of conflict in the middle east and after the FOMC speech. There is also another observation: large companies, politicians, funds and investors have long and aggressively motivate the crowd to buy, verbally confirming that they bought dozens and hundreds of bitcoins at a time for the balance, but bitcoin is standing still and updating lows. At the same time, various services such as "cryptorank" fix bullish sentiment at the lows. The market either lacks liquidity or something more unpredictable is happening (chart drawing????)
Technically, bitcoin is following the behavior of the SP500 quite strongly, which closes Friday's session quite weak and close to key support, which could trigger a continuation of the decline. Bitcoin won't stay on the sidelines and could also follow the index....
Resistance levels: 104K, 105K, 106K
Support levels: 102K, 100.6K, 97.5K
The price is coming out of the “symmetrical triangle” consolidation breaking the support, thus confirming the bearish mood. After a small correction after a false breakdown of 102500 the price may again return to storm (retest) the level under market pressure, which will only strengthen expectations of further decline. The target is liquidity 100600 - 100K. From 100K rebound and growth is possible.
Regards R. Linda!

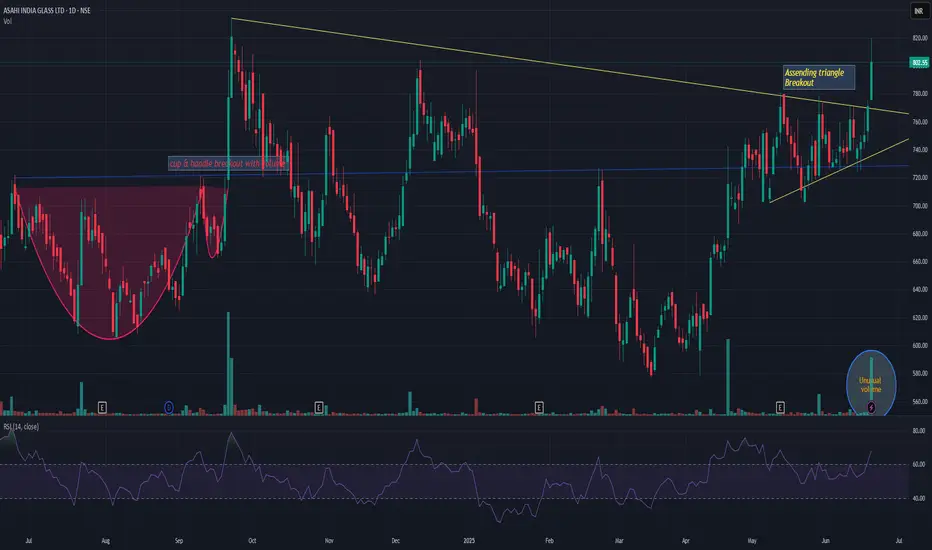
ASAHIINDIAASAHIINDIA has given symmetrical triangle breakout with unusual volume. Already took a momentum. Now as long as it is above upper channel line, i believe the momentum will continue till 980-1000 levels. Keep it on radar.
At monthly supportSymmetrical triangle at a monthly support. Breakout is coming soon, could be either way but I think is most likely to go to the upside following the previous two continuation patterns. Price is just over the lower vertex of the triangle, so we have a tight SL, it triggers if a weekly candles breaks down the triangle. I have calls that expire 3 months from now strike 200. Buying the stock is much safer. Good luck.

SYRUP consolidates for rallySYRUP - is testing ATH while the crypto market is in correction. We can conclude that this coin is stronger than the whole market and can continue its rally after accumulating the right potential.
Focus on the mirror support level 0.4600 - the round number gives strength to this level. After a false breakdown, the coin is consolidating in the buying zone. A break of the downside resistance will trigger a rally
Scenario: If the consolidation above 0.4600 continues and the coin breaks the downside resistance, a breakout and consolidation above 0.49450 will attract new buyers, which will only strengthen the rally.

GOLD → Geopolitical risks are driving gold prices up. To ATH?FX:XAUUSD is updating its interim highs as it retests resistance at 3435 amid escalating tensions in the Middle East. Economic risks are on the rise...
Gold rose 1.5% on Friday in Asian trading as investors sought refuge from escalating tensions between Israel and Iran. The price approached 7-week highs and could reach $3,500 if the conflict intensifies. The US and Israel have warned of serious consequences, while Iran has promised to respond. Geopolitics has overshadowed economic news, and markets are pricing in the possibility of a Fed rate cut in September.
Technically, the price is emerging from a local consolidation and testing a fairly important resistance level, forming a false breakout and correction. But this does not mean that the price will fall...
Resistance levels: 3425, 3435, 3461
Support levels: 3408, 3400, 3377
If gold consolidates above 3425 and continues to storm the resistance, growth may continue, and at the moment, there is a fairly high probability of a retest of the ATH. However, the ideal scenario would be a retest of the zone of interest 3408 - 3400 and the capture of liquidity before continuing growth.
Best regards, R. Linda!

GOLD → Strengthening and return to range. Focus on 3340FX:XAUUSD is forming a fairly strong support zone (a cascade within an upward line). The price is returning to the range, with bulls storming 3330-3340.
Markets are awaiting US inflation data (CPI), which may affect expectations for a Fed rate cut in September (chances are about 52%). Optimism following progress in US-China trade talks is supporting sentiment, but uncertainty remains due to a court ruling allowing Trump to maintain tariffs. This is holding back the dollar and helping gold. CPI forecast: 0.2% growth, core inflation 0.3%. Lower inflation, on the other hand, will support expectations of lower rates and strengthen demand for gold as a safe-haven asset.
Technically, gold is stuck between the boundaries of a symmetrical triangle. Overall, this situation is reflected in all markets. Consolidation is forming and the price could break out in either direction...
Support levels: 3301, 3330, 3340
Resistance levels: 3349, 3361, 3375
Focus on the boundaries of the previous range - 3330 - 3340. If the bulls, after the assault, manage to hold their ground above this zone, the market may take the initiative due to support and continue its growth towards areas of interest.
Best regards, R. Linda!

ETH/BTC : Ready to Lead the Altcoin Season?Hey Traders!
If you’re finding value in this analysis, smash that 👍 and hit Follow for high-accuracy trade setups that actually deliver!
Ethereum just broke out of a multi-week symmetrical triangle against Bitcoin — a classic continuation pattern! After consolidating for over a month, this breakout could signal a major shift in market dynamics.
Pattern: Symmetrical Triangle
Measured Move Target: +38.7% from the breakout
Timeframe: 12H
Current Ratio: 0.02517 BTC
🔍 Why ETH/BTC Matters for Altcoins:
When ETH/BTC rises, it often marks the beginning of an altcoin rally. Here's why:
✅ ETH leads altcoins — It’s the largest alt by market cap, and capital often rotates from BTC → ETH → mid/small caps.
✅ Rising ETH/BTC = Bitcoin dominance weakening, giving altcoins room to breathe.
✅ Confidence returns to the broader alt market when ETH outperforms BTC.
If this breakout sustains, we may be entering a strong altcoin season. Keep an eye on ETH strength and look for high-potential setups across the altcoin board!
What are your top altcoin picks for this potential rally? Drop them below 👇

RAIN INDUSTRIES at Good Support.This is 4 hour chart of RAIN INDUSTRIES.
Stock is forming a Symmetrical Triangle Pattern.pattern lower boundary expected to act as a strong support level 142-145.
IF this level is sustain , then we may see higher prices in Rain industries.
Thank You !!

NESCO at Resistance zone !!This is the Daily Chart of NESCO.
Nesco having good law of polarity at 1050 range.
NESCO is forming a pattern near its L.O.P, characterized by the development of an Ascending Broadening Wedge. The resistance zone for this formation is positioned between 1050 and 1060 levels
if this level is sustain, then we may see lower prices in NESCO.
THANK YOU !!

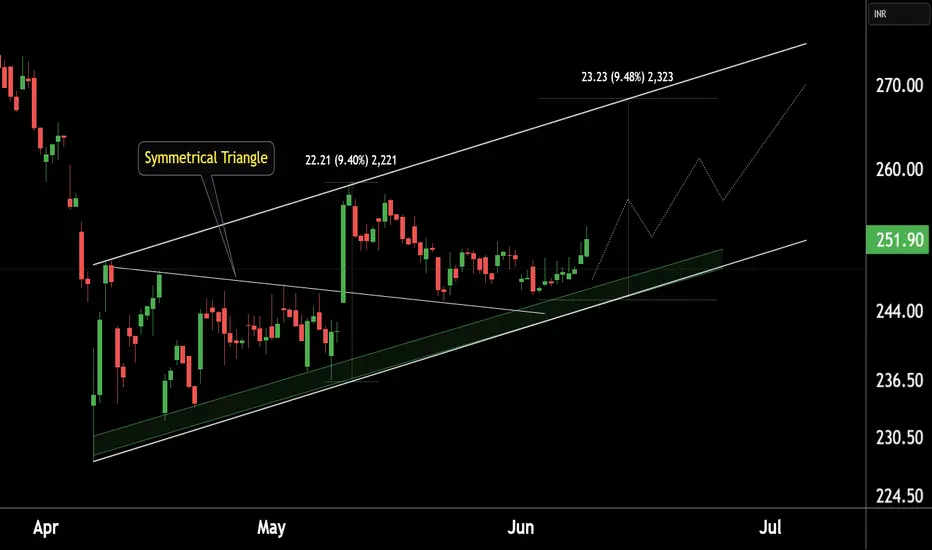
WIPRO at Best Support !!This is the 4 hour chart of Wipro ltd.
WIPRO has a strong support zone in the 245–248 range.
WIPRO is forming a symmetrical triangle pattern, with a potential target of 268, which also aligns with the channel's resistance zone at 268-270."
If this level is sustain , we may see higher prices in Wipro !!
Thank You