XAUUSD respecting descending channel structure.Price is trading inside a well-defined descending channel and is currently reacting from the lower boundary.
The support zone has previously held multiple times, suggesting a potential bullish response if structure remains intact.
A break and hold below support would invalidate this view.
Waiting for confirmation from price action.
Technical Analysis

GBPUSD Pullback Toward 1.34500 Keeps Bullish Trend in Play!Hey Traders,
In the coming week, we are monitoring GBPUSD for a potential buying opportunity around the 1.34500 zone.
The pair remains in a well-established uptrend and is currently undergoing a controlled correction. Price is approaching the 1.34500 area, a key zone where trendline support converges with a former support/resistance level, making it a technically important area to watch.
As long as this level holds, the broader bullish structure remains intact, and a constructive reaction here could open the door for a continuation toward higher levels.
don't forget to boost and leave your opinion in the comment section!
Trade safe,
Joe

GBPUSD Pullback Toward 1.34500 Keeps Bullish Trend in Play!Hey Traders,
In tomorrow's trading session, we are monitoring GBPUSD for a potential buying opportunity around the 1.34500 zone.
The pair remains in a well-established uptrend and is currently undergoing a controlled correction. Price is approaching the 1.34500 area, a key zone where trendline support converges with a former support/resistance level, making it a technically important area to watch.
As long as this level holds, the broader bullish structure remains intact, and a constructive reaction here could open the door for a continuation toward higher levels.
Trade safe,
Joe

XAUUSD: Buy the Dip or Break to 4,587? MMF PlayXAUUSD (2H) – MMF Intraday Outlook
Market Context
Gold remains in a bullish continuation phase after breaking out of the prior accumulation range. Current price action shows a healthy pullback / rebalancing inside an ascending channel — a typical behavior before the next expansion leg, not a reversal signal.
Structure & SMC
Strong bullish impulse → range formation for liquidity reset.
4,485.981 acts as a key Demand / Bullish OB, where buyers previously stepped in.
Liquidity and upside objective are resting near 4,587.447.
Key Levels
BUY Zone (Demand / OB): 4,486
Mid-range / Pivot: ~4,533
Upside Liquidity Target: 4,587
Trading Plan – MMF Style
Primary Scenario – Trend-Following BUY (Preferred)
If price pulls back into 4,486 and shows acceptance (wick rejection / bullish close),
Then look for BUY continuation:
TP1: range high / intraday resistance
TP2: 4,587
Invalidation: clean 2H close below 4,486 → stand aside and reassess structure.
Alternative Scenario – Break & Retest BUY
If price holds above balance and breaks higher with strong displacement,
Then wait for a break–retest to join continuation toward 4,587.
Avoid chasing price in the middle of the range.
Macro Backdrop
Ongoing dovish Fed expectations and softer yields continue to support gold.
End-of-month liquidity can cause sharp swings → patience and level-based execution are key.
Summary
Short-term bias remains bullish as long as 4,486 holds.
MMF focus today: buy pullbacks into demand, target 4,587 liquidity.

The Breakout Is LoadingHELLO TRADERS
ETH (Ethereum) – 4H | Key Points
Market Structure: Clear range / accumulation between support and resistance.
Resistance Zone: ~3,040 – 3,080 → supply still active, repeated rejections.
Support Zone: ~2,780 – 2,820 → strong demand, buyers defending lows.
Price Behavior: Sideways oscillation (high liquidity range), no breakout yet.
Bias: Neutral → Slightly bullish while holding above support.
Bullish Trigger: Clean 4H close above resistance → upside expansion.
Bearish Risk: Breakdown below support → deeper retracement.
Bottom line:
ETH is consolidating. Patience > prediction — wait for a confirmed breakout from the range.

DOUBLE TOP PATTERN – A CLASSIC BEARISH REVERSAL SETUP📚 DOUBLE TOP PATTERN – A CLASSIC BEARISH REVERSAL SETUP
The Double Top is one of the most reliable bearish reversal patterns, commonly appearing after a strong uptrend. Understanding its structure and confirmation rules helps traders avoid false signals and improve trade accuracy.
🔍 Structure of the Double Top
The pattern consists of three key phases:
1️⃣ First Top
Price rallies strongly and forms the first peak, showing strong bullish momentum.
Afterward, price pulls back, creating a temporary low — this level later becomes the neckline.
2️⃣ Second Top
Price attempts another push upward but fails to break above the first top.
This failure signals weakening buying pressure and early distribution by smart money.
3️⃣ Neckline Breakdown
The pattern is confirmed only when price breaks below the neckline.
This breakdown marks the shift from bullish control to bearish dominance.
👉 Important:
Without a neckline break, a Double Top is NOT valid.
📉 Market Meaning Behind the Pattern
- Bullish momentum weakens after the second top
- Buyers lose control, sellers gradually step in
- A neckline break confirms trend reversal
- When formed after a clear uptrend, Double Top is considered a high-probability reversal pattern
✅ Conditions for a High-Quality Double Top
For better reliability, the following conditions should be met:
✔️ A clear prior uptrend
✔️ Both tops are approximately equal in height
✔️ Volume is higher on the first top and lower on the second
✔️ Strong bearish candles or volume expansion on the neckline break
🛠️ How to Trade the Double Top
🔴 SELL Entry
The safest approach is to wait for a neckline break, then SELL on the retest of the neckline.
This reduces the risk of false breakdowns and improves risk-to-reward.
❌ Stop Loss (SL)
Place SL above the second top (or above both tops).
The stop must be outside the structure to avoid liquidity sweeps.
🎯 Take Profit (TP)
To estimate the target:
- Measure the distance from the top to the neckline
- Project that distance downward from the neckline break
⚠️ Common Mistakes to Avoid
❌ Selling just because price forms a second top
❌ Ignoring neckline confirmation
❌ Trading without volume or candle confirmation
❌ Not combining with other tools
📌 Pro Tip for Higher Accuracy
Combine the Double Top with:
- RSI divergence
- Fair Value Gaps (FVG)
- Trendlines
- Liquidity zones
This multi-confirmation approach significantly increases trade probability.

XAUUSD — The Bullish Trend Continues to Lead the MarketGold is closing out 2025 in an exceptionally strong position. Breaking above the 4,500 USD/oz mark for the first time is not just a technical milestone—it signals a fundamental shift in how global capital views gold. A gain of over 70% for the year, the strongest since 1979, confirms that this move is no longer a short-term rally, but the result of deep structural changes in the macroeconomic and monetary landscape.
On the chart, the bullish structure remains clearly intact. Price is trading within a rising channel, holding firmly above the Ichimoku cloud and the main trendline, showing that buyers continue to dominate. After the strong breakout, gold is consolidating above the 4,460 level—a key support zone that serves both as a technical base and a psychological balance point. The shallow pullbacks that fail to break this base reflect active buying rather than distribution.
In the near term, the most reasonable scenario is for gold to hold above 4,460 and extend toward the 4,570 area, where supply may be tested again. Any short-term volatility should be viewed as healthy consolidation within the broader uptrend, as long as the current support zone remains intact.

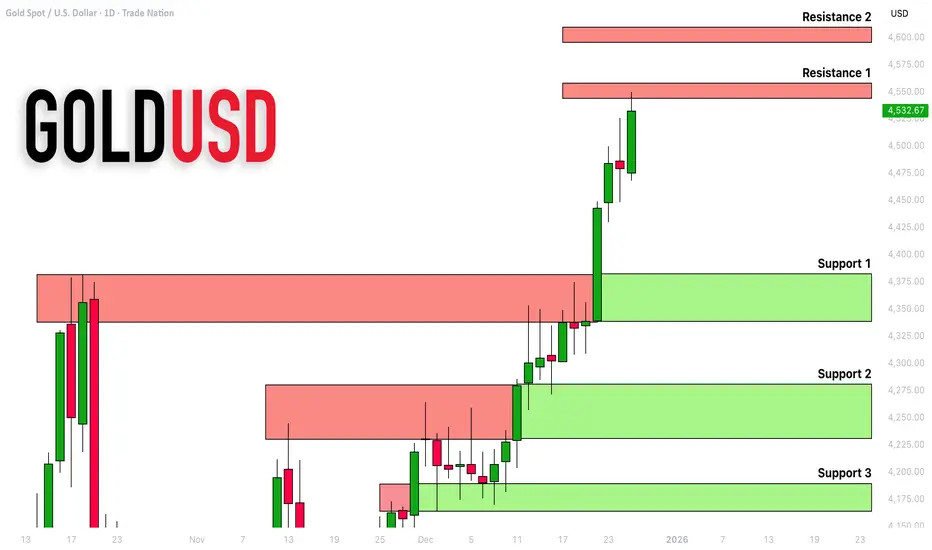
GOLD (XAUUSD): Support & Resistance Analysis For Next Week
Here is my latest support & resistance analysis for Gold
for next week.
Consider these structures for pullback/breakout trading.
❤️Please, support my work with like, thank you!❤️
I am part of Trade Nation's Influencer program and receive a monthly fee for using their TradingView charts in my analysis.
EURUSD Pullback Toward 1.17500 Keeps Bullish Structure IntactHey Traders,
In today’s trading session, we are monitoring EURUSD for a potential buying opportunity around the 1.17500 zone.
The pair remains in a well-defined uptrend and is currently undergoing a healthy corrective move. Price is approaching the 1.17500 area, a key zone of confluence where trend support aligns with a former support/resistance level. This area has previously attracted strong participation, making it technically significant.
As long as this level holds, the broader bullish structure remains intact, and a positive reaction here could support a continuation toward recent highs.
don't forget to support us with boost and leave your opinion on the comment section!
Trade safe,
Joe

EURJPY: Bullish Continuation Ahead?! 🇪🇺🇯🇵
There is a high probability that EURJPY will continue
rising after the market opening, following a confirmed
breakout of a resistance line of a bullish flag pattern
on a 4h time frame,
Expect a movement up at least to 184.83 level,
❤️Please, support my work with like, thank you!❤️
I am part of Trade Nation's Influencer program and receive a monthly fee for using their TradingView charts in my analysis.

ETH Is Trapped at Resistance — The Next Move Is Likely Down ETHUSD (1H) — Public Market Commentary
Ethereum is currently retesting a well-defined resistance zone around the 2,980–3,000 area. Price has failed multiple times to hold above this zone, signaling that sellers remain in control at higher levels.
Key Observations
Repeated rejection at resistance shows clear supply absorption failure.
The latest impulsive move up lacked follow-through and was quickly sold.
Market structure remains range-bound, not trending.
Probable Scenario
From a structural perspective, a pullback toward the support zone (≈ 2,880–2,900) is the higher-probability path.
This move would serve to rebalance liquidity before any sustainable upside attempt.
A clean breakdown into support would not be bearish continuation yet — it would be normal corrective behavior inside a range.
Invalidation
Only a strong H1 close above the resistance zone, followed by acceptance, would shift momentum bullish.
Macro Context
Risk sentiment remains fragile:
Strong USD and elevated US yields continue to pressure crypto.
Absence of fresh ETF inflows or bullish macro catalysts limits upside expansion.
Until macro liquidity improves, ETH rallies are likely to be sold at premium zones.
Conclusion:
This is not a breakout market. Until resistance is clearly reclaimed, expect downside probing before any meaningful upside continuation.

EURUSD - Ascending Channel at 1.1770 | Dollar Weakness + Fed Executive Summary
FX:EURUSD is trading at 1.17705 on December 26, 2025, consolidating near the top of a well-defined ascending channel on the 4H timeframe. The Euro has had an impressive year with +13.67% YTD gains as the US Dollar weakens on Fed rate cut expectations. The pair is approaching the 52-week high of 1.19187, with the ascending channel structure suggesting continued bullish momentum. However, short-term technicals show slight bearish divergence, and thin holiday trading could bring volatility.
BIAS: BULLISH - Ascending Channel Intact
The trend is clearly bullish with +13.67% YTD. The ascending channel is well-defined and intact. Buy dips to channel support, target the 52-week high.
Current Market Context - December 27, 2025
EUR/USD is in a strong uptrend:
Current Price: 1.17705 (-0.07% on the day)
Day's Range: 1.17615 - 1.17966
52-Week Range: 1.01766 - 1.19187
52-Week High: 1.19187 (approaching)
Technical Rating: Slightly bearish short-term
Performance Metrics - ALL GREEN:
1 Week: +0.41%
1 Month: +1.52%
3 Months: +0.90%
6 Months: +0.37%
YTD: +13.67%
1 Year: +12.96%
Every timeframe is positive. The Euro is having its best year against the Dollar in recent memory.
THE BULL CASE - Dollar Weakness Driving Euro Higher
1. Fed Rate Cut Expectations
The US Dollar has been under pressure as investors price in further Federal Reserve rate cuts:
Fed funds futures pricing in 2-3 rate cuts in 2026
First cut expected as early as March/April
Fed balancing weakening labor market against inflation concerns
Divided Fed has left investors on edge about policy outlook
Lower rates = weaker Dollar = stronger Euro
2. Dollar Index Weakness
Dollar Index (DXY) at 97.96
Poised for 0.8% weekly drop - weakest since July
Euro, Sterling, Swiss Franc all pushing to recent highs
Dollar has fallen throughout 2025 as Fed cuts rates
Other central banks expected to hold rates steady
3. Fed Chair Succession Uncertainty
Jerome Powell's term ends in May
Trump to nominate replacement
Any inkling of Trump's decision could sway markets
Uncertainty adding to Dollar weakness
4. US-EU Tensions (Potential Euro Catalyst)
US sanctioned former EU officials including Thierry Breton
Tensions over digital regulation and Big Tech
France's Macron condemned the sanctions
Could lead to Euro strength as EU asserts sovereignty
Transatlantic tech rift deepening
5. Seasonal Strength
2025 significantly outperforming 2024 and 2023 seasonally
Euro typically strong in year-end trading
Thin holiday volumes can amplify moves
THE BEAR CASE - Short-Term Caution
1. Technical Rating Shows Slight Bearish
TradingView technicals gauge pointing toward "Sell"
Short-term overbought conditions possible
Near 52-week high - natural resistance
Consolidation after strong rally
2. Thin Holiday Trading
Many markets closed or light volumes
Thin liquidity can cause erratic moves
Year-end positioning adding volatility
Reduced participation until January
3. US Economic Data Still Solid
Jobless claims unexpectedly fell last week
US businesses see year-ahead employment growth at 4.32%
Revenue growth expectations at 3.83%
Strong data could limit Dollar weakness
4. Potential Dollar Bounce
Dollar oversold after recent decline
Mean reversion possible
Fed could turn hawkish if inflation persists
Risk-off events could boost Dollar safe-haven appeal
Technical Structure Analysis
Price Action Overview - 4 Hour Timeframe
The chart shows a textbook bullish structure:
Ascending Channel Characteristics:
Clear ascending channel established
Lower trendline: Rising support (cyan dashed)
Upper trendline: Rising resistance (cyan dashed)
Higher highs and higher lows throughout
Price respecting channel boundaries well
Currently trading in upper half of channel
Key Zones Identified (Purple Shaded):
Upper resistance zone: 1.1800-1.1820
Middle support zone: 1.1700-1.1740
Lower support zone: 1.1480-1.1520
Major resistance line: ~1.1820 (red horizontal)
Major support line: ~1.1480 (red horizontal)
Current Position:
Price at 1.1770 - near upper channel
Consolidating after recent push higher
Testing middle of recent range
52-week high at 1.19187 within reach
Key Support and Resistance Levels
Resistance Levels:
1.1797 - Day's high / immediate resistance
1.1800-1.1820 - Upper resistance zone (purple)
1.1850 - Secondary resistance
1.1900 - Psychological resistance
1.1919 - 52-WEEK HIGH (major target)
1.2000 - Extended target / psychological
Support Levels:
1.1761 - Day's low / immediate support
1.1740 - Secondary support
1.1700-1.1740 - Middle support zone (purple)
1.1650 - Channel midline area
1.1600 - Psychological support
1.1480-1.1520 - Lower support zone (purple)
1.1480 - MAJOR SUPPORT (red line)
Channel Analysis
Channel established from late November lows
Strong upward slope - bullish momentum
Price respecting both boundaries
Channel width: approximately 300-350 pips
Midline providing dynamic support/resistance
Breakout above channel would accelerate rally
Moving Average Analysis
Price trading above all major moving averages
MAs sloping upward - bullish alignment
Short-term MAs above long-term MAs
MAs providing dynamic support on pullbacks
Trend structure bullish on all timeframes
SCENARIO ANALYSIS
BULLISH SCENARIO - Breakout to 52-Week High
Trigger Conditions:
4H close above 1.1820 resistance zone
Volume confirmation on breakout
Dollar Index breaks below 97.50
Fed signals more rate cuts
Risk-on sentiment continues
Price Targets if Bullish:
Target 1: 1.1850 - Secondary resistance
Target 2: 1.1900 - Psychological level
Target 3: 1.1919 - 52-week high
Extended: 1.2000+ (new highs)
Bullish Catalysts:
+13.67% YTD momentum
Ascending channel intact
Fed rate cut expectations (2-3 cuts in 2026)
Dollar weakness continuing
Euro outperforming seasonally
52-week high within reach
All performance metrics green
BEARISH SCENARIO - Pullback to Channel Support
Trigger Conditions:
Rejection at 1.1800-1.1820 resistance
Break below 1.1700 support zone
Dollar bounce on strong US data
Risk-off sentiment
Fed turns hawkish
Price Targets if Bearish:
Target 1: 1.1700-1.1740 - Middle support zone
Target 2: 1.1650 - Channel midline
Target 3: 1.1600 - Psychological support
Extended: 1.1480-1.1520 - Lower support zone
Bearish Risks:
Technical rating showing slight bearish
Near 52-week high - natural resistance
Thin holiday volumes
Potential Dollar bounce
US economic data still solid
Overbought short-term
NEUTRAL SCENARIO - Consolidation in Range
Most likely short-term outcome:
Price consolidates between 1.1700-1.1820
Thin holiday trading
Wait for January for directional clarity
Healthy consolidation before next leg higher
Channel support provides floor
MY ASSESSMENT - BULLISH with Short-Term Caution
The weight of evidence favors bulls:
Bullish Factors (Dominant):
+13.67% YTD - Strong trend
Ascending channel intact
All performance metrics green
Fed rate cuts expected
Dollar weakness continuing
52-week high within reach
Seasonal strength
Higher highs and higher lows
Bearish Factors (Minor):
Technical rating slightly bearish
Near 52-week high resistance
Thin holiday volumes
Short-term overbought possible
My Stance: BULLISH - Buy Dips
The trend is clearly bullish with +13.67% YTD. The ascending channel is intact and well-defined. Fed rate cut expectations continue to pressure the Dollar. The 52-week high at 1.1919 is the obvious target.
Strategy:
Buy dips to 1.1700-1.1740 support zone
Target 1.1850, 1.1900, 1.1919 (52-week high)
Stops below channel support
Don't chase at current levels
Respect the ascending channel
Trade Framework
Scenario 1: Breakout Trade Above 1.1820
Entry Conditions:
4H close above 1.1820
Volume confirmation
Dollar Index weakness
Trade Parameters:
Entry: 1.1825-1.1840 on confirmed breakout
Stop Loss: 1.1750 below recent support
Target 1: 1.1900 (Risk-Reward ~1:1)
Target 2: 1.1919 (52-week high)
Target 3: 1.2000 (Extended)
Scenario 2: Buy the Dip at Support Zone
Entry Conditions:
Price pulls back to 1.1700-1.1740 zone
Bullish rejection candle
Channel support holds
Trade Parameters:
Entry: 1.1700-1.1740 at support zone
Stop Loss: 1.1650 below channel midline
Target 1: 1.1800 (Risk-Reward ~1:1.2)
Target 2: 1.1850-1.1900 (Risk-Reward ~1:2)
Target 3: 1.1919 (52-week high)
Scenario 3: Channel Bottom Buy
Entry Conditions:
Price tests 1.1480-1.1520 major support
Strong bounce with volume
Channel support holds
Trade Parameters:
Entry: 1.1500-1.1550 at channel bottom
Stop Loss: 1.1430 below major support
Target 1: 1.1700 (Risk-Reward ~1:2)
Target 2: 1.1800 (Risk-Reward ~1:3.5)
Target 3: 1.1900+ (Extended)
Risk Management Guidelines
Position sizing: 1-2% max risk per trade
Respect the ascending channel
Buy dips, don't chase highs
Thin holiday volumes = wider stops
Scale out at targets
Move stop to breakeven after first target
Watch Dollar Index for confirmation
Monitor Fed commentary
Invalidation Levels
Bullish thesis invalidated if:
Price closes below 1.1480 (major support)
Ascending channel breaks down
Dollar Index surges above 100
Fed signals no more rate cuts
Bearish thesis invalidated if:
Price closes above 1.1919 (new 52-week high)
Channel breaks to upside
Dollar Index breaks below 96
Fed signals aggressive rate cuts
Conclusion
FX:EURUSD is in a strong bullish trend, trading at 1.17705 within a well-defined ascending channel. The Euro has gained +13.67% YTD as the Dollar weakens on Fed rate cut expectations. The 52-week high at 1.1919 is within reach.
The Numbers:
Current Price: 1.17705
YTD Performance: +13.67%
1-Year Performance: +12.96%
52-Week High: 1.19187
52-Week Low: 1.01766
Key Levels:
1.1919 - 52-WEEK HIGH (bullish target)
1.1800-1.1820 - Upper resistance zone
1.1770 - Current price
1.1700-1.1740 - Middle support zone
1.1480-1.1520 - Lower support zone
The Setup:
Ascending channel intact. Fed rate cuts pressuring Dollar. Euro outperforming seasonally. All performance metrics green. The path of least resistance is higher.
Strategy:
BULLISH stance - buy dips
Buy 1.1700-1.1740 support zone
Target 1.1850, 1.1900, 1.1919 (52-week high)
Stops below channel support
Respect the trend
The trend is your friend. Don't fight the Euro's momentum.

Stop Hunt or True Breakout?If you've ever entered a trade in the right direction but still got your SL swept right before price rocketed… congratulations — you've witnessed one of gold’s most sophisticated market maneuvers: the Stop Hunt.
The problem isn’t that the market is unfair.
The real issue is: we can’t tell when price is hunting liquidity and when it’s genuinely breaking out.
1. Stop Hunt — A calculated trap
On XAUUSD, stop hunts usually happen around levels that almost every trader draws the same way: short-term highs/lows, obvious support/resistance, or tight consolidation zones.
Typical behavior:
Price spikes through the level fast and aggressively, but shows no follow-through (no candle closes confirming outside the zone). After sweeping stops, price reverses cleanly — as if the breakout never happened.
The objective? Grab liquidity from clustered SL orders sitting above/below key levels before the big players push price in the real direction.
2. True Breakout — The real declaration of control
A real breakout doesn’t need to look dramatic.
It’s not one lightning-strike candle spearing through a level — it’s a sequence of price action proving that buyers or sellers have fully taken over.
How to identify it:
Price breaks the level, then:
A candle clearly closes outside the level
A retest respects the level without slipping back into the old range
Market structure continues in the new trend (HH-HL for bullish, LH-LL for bearish)
At this point, the breakout is no longer a “test” — it’s a true shift in capital flow.
3. The 5-second rule to spot the difference
Breaks level but closes back inside the old zone → Stop Hunt
Breaks level, closes outside, retest holds → True Breakout
No indicator needed. No complex patterns.
Just answer this: Did price hold its ground after the break?
If no → liquidity got hunted.
If yes → a new trend is born.
4. Survival tactics when trading gold
Don’t place SL right above obvious highs or below clear lows
Wait for a confirming candle close before entering
A retest that respects the level is the safest entry
Breakouts with no retest are often fakeouts
Gold is a market driven by liquidity first, technique second.
Those who understand this don’t just avoid getting stopped out — they trade alongside the real institutional flow.

Most Traders Think This Is a Breakout — It’s Actually a LiquiditBITCOIN (BTCUSD) – 1H MARKET STRUCTURE ANALYSIS
1. Current Market Context – Sideways Is Not Weakness
Bitcoin is currently trading inside a clearly defined sideways (range-bound) structure.
This type of market often confuses traders because:
- Price moves frequently
- No clean trend is visible
- Fake breakouts appear on lower timeframes
However, sideways movement is not randomness it is order accumulation and distribution.
2. Key Price Zones on the Chart
🔴 Resistance Zone (Upper Range)
Price has been rejected multiple times from this area
Sellers consistently defend this level
Breakout attempts fail without structure confirmation
🟢 Support Zone (Lower Range)
Price repeatedly finds buyers in this area
Long wicks and strong reactions confirm demand
Smart money absorbs sell pressure here
3. Sideway Zone = Liquidity Zone
The highlighted sideway zone is where:
- Retail traders overtrade
- Emotions dominate
- Stop-losses are clustered on both sides
Professionals use this phase to:
- Accumulate positions quietly
- Create false breakouts
- Prepare for a high-momentum expansion later
This is why most losses occur inside ranges.
4. Price Behavior Inside the Range
Notice the repeated pattern:
- Push up → rejection
- Drop down → strong reaction
- Higher volatility near range edges
- Compression near the middle
This behavior confirms:
- No trend confirmation yet
- Market is waiting for liquidity completion
5. Breakout Logic – Not Guessing, Only Confirmation
A valid breakout requires:
- A clean close outside the range
- Structure continuation, not a single candle
- Acceptance above resistance or below support
Until then:
- Every move inside the range is noise
- Every early entry is risk exposure
6. Professional Trading Mindset
In a sideways market:
- Patience is a strategy
- Waiting is a position
- Capital preservation > prediction
Conclusion – Read the Market, Don’t Fight It
This chart is a textbook example of range accumulation.
Until price proves otherwise:
Respect the range
Trade only confirmed reactions
Ignore emotional breakouts
The market always shows its intention only disciplined traders are calm enough to see it.

This Sideways Move Is the Setup Before ExpansionETHUSD – 4H MARKET ANALYSIS
1. Market Structure
ETH is moving inside a sideways accumulation range after a strong impulsive move.
Price is forming higher lows above the main support, showing absorption rather than distribution.
2. Key Zones
Resistance Zone: ~3,150–3,160
→ Sellers are active, price is being capped.
Primary Support Zone: ~2,880–2,920
→ Strong demand, repeated defenses.
Secondary Support: ~2,770
→ Last line if the range fails.
3. Price Behavior
Repeated range oscillations → liquidity building.
No impulsive rejection from support → buyers still in control.
Compression near support often precedes expansion, not breakdown.
4. Scenarios
Bullish (Preferred):
Hold above 2,900
Break & accept above 3,160
Expansion toward 3,250+
Bearish (Lower Probability):
Clean breakdown below 2,880
Retest 2,770 liquidity zone
5. Conclusion
ETH is not trending yet it is preparing.
As long as price holds above the main support, this range favors upside continuation, not reversal.
Sideways here is accumulation — not weakness.

ETH Is Trapped Between Liquidity WallsETHEREUM MARKET ANALYSIS (ETHUSD – H1)
1. Market Context
Ethereum is currently trading inside a clear consolidation range after a previous corrective move. Price is oscillating between a well-defined support zone and a heavy resistance zone, showing classic liquidity accumulation behavior rather than trend continuation or breakdown.
This type of structure often precedes a strong directional expansion, especially during low-liquidity holiday sessions.
2. Key Technical Zones
Major Resistance Zone: 2,980 – 3,020
Key Support Zone: 2,880 – 2,920
Current Price Area: ~2,950–2,970
Dynamic Levels: EMA 34 & EMA 89 converging → compression
Price has repeatedly failed to accept above resistance, but sellers are also unable to push below the support zone decisively.
3. Price Structure & Behavior
Sideways structure with higher volatility swings inside the range
Multiple liquidity sweeps on both sides
No impulsive follow-through yet → confirms range environment
EMAs flattening → market is waiting for a catalyst
This is not a trend market at the moment — it is a pre-expansion phase.
4. Scenario Outlook
Primary Scenario (Bullish Expansion):
Price holds above 2,900–2,920
Strong breakout & acceptance above 3,020
Upside expansion toward 3,080 → 3,120+
Alternative Scenario (Final Liquidity Sweep):
One more dip into 2,880–2,900
Absorption of sell orders
Sharp reversal → breakout higher afterward
Invalidation:
Clean breakdown and acceptance below 2,880 would shift bias to a deeper correction.
5. Trading Bias
Market State: Accumulation / Compression
Best Strategy: Trade the range edges or wait for confirmed breakout
Risk Note: Holiday sessions = sudden spikes → reduce position size
Conclusion
Ethereum is coiling tightly between support and resistance.
This is a decision zone, not a random range. Once liquidity is fully absorbed, the next move is likely to be fast and directional. Patience here is a position.
Wait for confirmation the breakout will not be subtle.

Bitcoin Trapped in the Holiday Range — Breakout Comes BITCOIN (BTC/USD) – 1H MARKET ANALYSIS
Market Context
Bitcoin is currently trading in a well-defined range, trapped between a strong support zone around 85,000 USD and a major resistance zone near 90,000 USD. The current structure reflects consolidation and accumulation, not distribution.
1. Price Structure
Price continues to form higher lows near the support area, indicating that buyers are still actively defending this zone.
Each approach toward 89,500 – 90,000 is met with strong selling pressure, confirming this area as a valid resistance zone.
The EMA 34 and EMA 89 are flattening and overlapping, a typical sign of a sideways market.
➡️ No confirmed breakout = no new trend yet.
2. Market Behavior
The price is moving in a controlled zigzag pattern inside the range, which is characteristic of:
Liquidity accumulation
Market makers controlling both sides of the range
Sharp intraday spikes without follow-through suggest liquidity sweeps, not trend continuation.
3. Key Scenarios (Outlook)
Scenario 1 – Range Continuation (High Probability)
Price continues oscillating between 85,000 – 90,000.
Best approach:
Buy near support
Sell near resistance
Avoid chasing price in the middle of the range
Scenario 2 – Bullish Breakout (Confirmation Required)
Trigger conditions:
Strong H1/H4 candle close above 90,000
Clear increase in volume
If confirmed:
Range is broken
Next upside targets: 92,000 – 95,000
Scenario 3 – Bearish Breakdown (Lower Probability)
Only valid if price breaks below 85,000 with strong momentum.
In that case:
Deeper correction may follow
Next key demand zone: 82,000 – 83,000
4. Summary
Market state: Sideways / Accumulation
Primary trend: Pausing, not reversing
Optimal strategy: Trade the range or wait for confirmation
Risk note: Avoid entries in the middle of the range poor risk-to-reward
👉 The market rewards patience and discipline, not impatience.

Bitcoin Rejects the Ceiling — Liquidity Is Pulling Price BTCUSD (1H) — Market Outlook
Bitcoin is currently rejected from a major resistance zone near 90,000, confirming that sellers remain active at premium prices.
Key Market Structure
The recent impulsive move up failed to hold above resistance, signaling a lack of breakout strength.
Price is still trading inside a broader range, not a confirmed trend.
This rejection suggests bullish momentum is weakening short term.
Probable Scenario
The higher-probability path is a pullback toward the support zone around 86,500–87,000.
This move would allow the market to rebalance liquidity and test real demand.
Only strong buyer reaction at support would justify renewed upside attempts.
Invalidation
A clean H1 close above the resistance zone with follow-through would invalidate the pullback scenario.
Macro Context
Strong USD and elevated bond yields continue to cap risk assets.
With no immediate bullish macro catalyst, Bitcoin rallies into resistance are likely to be sold.
Bottom Line:
Bitcoin remains range-bound. Until resistance is clearly broken and accepted, expect downside probing before any sustainable upside continuation.

How to read candlestick: Part 2 (BEARISH REVERSAL PATTERNS)Identifying the top of a trend is one of the hardest skills in trading. While no one can catch the exact top every time, Bearish Reversal Patterns are the market’s way of signaling that the buyers are exhausted and the sellers (bears) are seizing control.
These patterns usually appear after a sustained uptrend or at a key resistance level.
1. The Shooting Star
The Shooting Star is one of the most reliable single-candle signals. It looks like an inverted hammer but appears at the top of an uptrend.
● Structure:
1. Small Body: The body (open and close) is small and located at the bottom of the
candle's range.
2. Long Upper Wick: The upper wick (shadow) is at least 2-3 times longer than the
body.
3. No Lower Wick: Ideally, there is little to no lower wick.
● Psychology: Buyers pushed the price up significantly during the session, but sellers fought back aggressively, forcing the price to close near where it opened. The rejection of higher prices is clear.
2. Bearish Engulfing
This is a powerful two-candle pattern that signifies a major shift in momentum. It "engulfs" the previous buying pressure.
● Structure:
1. Candle 1 (Bullish): A green candle continuing the current uptrend.
2. Candle 2 (Bearish): A large red candle that opens above the previous close and
closes below the previous open. Its body completely overlaps (engulfs) the body
of the first candle.
● Psychology: The bulls tried to push up, but the bears came in with overwhelming
volume, completely wiping out the gains of the previous session and driving the price lower.
3. The Evening Star
The Evening Star is a three-candle formation that is often seen as more reliable than single-candle patterns because it unfolds over three sessions.
● Structure:
1. The Trend Candle: A large bullish candle.
2. The Star: A small-bodied candle (can be green or red) that gaps up slightly. It
represents indecision.
3. The Reversal Candle: A large bearish candle that closes well into the body of
the first bullish candle.
● Psychology: The first candle shows buyers are in control. The second candle shows
they are losing momentum (indecision). The third candle confirms that sellers have taken over and the reversal is active.
4. Dark Cloud Cover
This pattern is similar to the Bearish Engulfing but slightly less aggressive. It typically occurs at resistance levels.
● Structure:
Candle 1: A strong bullish candle.
Candle 2: A bearish candle that opens above the high of the previous candle (a
gap up) but then closes below the midpoint (50% level) of the first candle's body.
● Psychology: The market gaps up on optimism, but the rally fails. Sellers push the price
down deep into the previous day's gains, signaling a "dark cloud" over the trend.
5. Hanging Man
Interestingly, this looks exactly like a bullish Hammer, but the context is different.
● Structure: A small body at the top of the range with a long lower wick. It appears at the top of an uptrend.
● Psychology: Even though the price recovered to close near the high, the long lower wick shows that sellers were able to push the price down significantly during the session. This "sell-off" indicates that support is weakening and the trend is fragile.
TRADING TIP: CONFIRMATION IS KEY
Seeing a bearish pattern does not mean you should instantly short the market.
1. Location: These patterns are most effective at Key Resistance levels or Supply Zones.
2. Confirmation: Wait for the next candle to close lower than the pattern to confirm the
reversal.
3. RSI/Indicators: Check if your indicators (like RSI) are showing "Overbought" conditions or bearish divergence to support your trade idea.

GBPUSD - Ascending Channel at $1.35
Executive Summary
FX:GBPUSD is trading at $1.3498 on December 28, 2025, consolidating near 3-month highs within a well-defined ascending channel on the 2H timeframe. The British Pound is having its best year since 2017 (+8% YTD) while the US Dollar is on track for its worst year since 2003 (-9.9% YTD). Price is testing critical resistance at $1.3520-1.3560 after breaking above $1.35 for the first time in three months. The Bank of England's cautious stance on rate cuts versus the Fed's expected easing creates a favorable backdrop for sterling, but thin holiday volumes and overbought conditions warrant caution.
BIAS: NEUTRAL - Watching for Breakout at Resistance
The trend is clearly bullish with +8% YTD. The ascending channel is intact. However, price is testing critical resistance near multi-month highs. Wait for breakout confirmation or pullback to support before entering.
Current Market Context - December 28, 2025
GBP/USD is in a strong uptrend:
Current Price: $1.3498 (-0.04% on the day)
Day's Range: $1.3477 - $1.3527
52-Week Range: $1.2099 - $1.3789
52-Week High: $1.3789 (approaching)
Technical Rating: BUY
Performance Metrics - ALL GREEN (except 6M):
1 Week: Positive
1 Month: +2%
3 Months: Positive
6 Months: -1.49%
YTD: +7.88%
1 Year: +7.57%
Sterling is having its best year against the Dollar since 2017. The pound broke above $1.35 for the first time in three months.
THE BULL CASE - Dollar Weakness Driving Sterling Higher
1. Dollar's Worst Year Since 2003
The US Dollar has been under severe pressure:
Dollar Index (DXY) on track to lose 9.9% for the year
Steepest annual drop since 2003
Whipsawed by tariff chaos and Fed independence concerns
"The USD risk premium widened in December" - HSBC
"USD weakness may reflect growing concerns around Fed independence" - HSBC
2. Fed Rate Cut Expectations
Fed funds futures pricing in 2-3 rate cuts in 2026
First cut expected as early as March/April
Goldman Sachs expects "two more 25bp cuts to 3-3.25%"
Fed balancing weakening labor market against inflation concerns
Lower rates = weaker Dollar = stronger Sterling
3. Bank of England Cautious on Cuts
BoE cut rates by 25bps to 3.75% in December
Narrow 5-4 vote reflecting ongoing inflation concerns
Governor Bailey: rates will trend lower "but not as quickly as markets might hope"
UK inflation at 3.2% - still above BoE's 2% target
Hawkish BoE vs Dovish Fed = Sterling strength
4. Improving UK Economic Sentiment
"Sterling-wise looks to be some improving sentiment towards the outlook" - Neil Wilson, Saxo Markets
Revised GDP figures showed substantial upward revision to business investment
UK GDP grew 0.1% in Q3, in line with expectations
Budget delivered extra fiscal headroom, triggering relief rally
Positioning was negative going into Budget - relief rally since
5. Sterling's Best Year Since 2017
GBP/USD up over 8% YTD
Best annual performance since 2017
Broke above $1.35 for first time in 3 months
Up over 2% in December alone
Outperforming most G10 currencies
THE BEAR CASE - Short-Term Caution
1. Near Multi-Month Highs
Price at 3-month highs
Testing critical resistance zone $1.3520-1.3560
Natural resistance after strong rally
Profit-taking risk elevated
52-week high at $1.3789 still ~300 pips away
2. Thin Holiday Volumes
Year-end trading conditions
Many market participants off
Thin liquidity can cause erratic moves
"Thin turn of year markets provide opportunity" for sharp reversals
Reduced participation until January
3. Overbought Conditions
+8% YTD rally
+2% in December alone
Extended from moving averages
Mean reversion possible
Consolidation healthy after strong move
4. UK Fiscal Concerns
Budget watchdog to publish forecasts on March 3
Any negative assessment could pressure sterling
Fiscal headroom remains tight
BoE forecasts flat growth in Q4
5. Potential Dollar Bounce
Dollar oversold after -9.9% YTD decline
Risk-off events could boost Dollar safe-haven appeal
Fed could turn hawkish if inflation persists
Yen intervention could trigger broader FX volatility
Expert Analysis
MUFG Strategists:
"The drop for the dollar this year is unlikely to be a one-off with scope for further gains ahead."
HSBC Analysts:
"The USD risk premium widened in December which suggests USD weakness may reflect growing concerns around Fed independence, not just the monetary policy outlook."
"With many other G10 central banks on hold, we think Fed liquidity operations and a slight dovish Fed bias leaves the USD outlook tilted to the downside."
Neil Wilson, Saxo Markets:
"Sterling-wise looks to be some improving sentiment towards the outlook for the economy even if it looks a bit miserable in the trenches right now."
"Positioning was kind of negative going into the Budget so as that delivered extra fiscal headroom we have seen some relief rally since."
Goldman Sachs (David Mericle):
"We expect the FOMC to compromise on two more 25bp cuts to 3-3.25% but see the risks as tilted lower."
Technical Structure Analysis
Price Action Overview - 2 Hour Timeframe
The chart shows a textbook bullish structure:
Ascending Channel Characteristics:
Clear ascending channel established
Lower trendline: Rising support (yellow dashed)
Upper trendline: Rising resistance (yellow dashed)
Higher highs and higher lows throughout
Price respecting channel boundaries well
Currently trading near upper channel boundary
Key Zones Identified (Purple Shaded):
Upper resistance zone: $1.3520-$1.3560
Lower support zone: $1.3220-$1.3280
Major resistance lines: Red horizontals at key levels
Channel width: ~300 pips
Current Position:
Price at $1.3498 - testing upper resistance zone
Consolidating after push to 3-month highs
52-week high at $1.3789 within reach
Technical rating: BUY
Key Support and Resistance Levels
Resistance Levels:
$1.3527 - Day's high / immediate resistance
$1.3520 - Resistance zone lower boundary
$1.3535 - Recent 3-month high
$1.3560 - Resistance zone upper boundary
$1.3600 - Psychological resistance
$1.3650 - Secondary resistance
$1.3700 - Psychological level
$1.3789 - 52-WEEK HIGH (major target)
Support Levels:
$1.3477 - Day's low / immediate support
$1.3450 - Secondary support
$1.3400 - Psychological support
$1.3350 - Tertiary support
$1.3320 - Support zone upper boundary
$1.3280 - Support zone lower boundary
$1.3220 - CHANNEL FLOOR (major support)
$1.2099 - 52-Week low
Channel Analysis
Channel established from October lows
Strong upward slope - bullish momentum
Price respecting both boundaries
Channel width: approximately 300 pips
Upper boundary: ~$1.3520-$1.3560
Lower boundary: ~$1.3220-$1.3280
Breakout above channel would accelerate rally
Moving Average Analysis
Price trading above all major moving averages
MAs sloping upward - bullish alignment
Short-term MAs above long-term MAs
MAs providing dynamic support on pullbacks
Trend structure bullish on all timeframes
SCENARIO ANALYSIS
BULLISH SCENARIO - Breakout to 52-Week High (60% Probability)
Trigger Conditions:
2H close above $1.3560 resistance zone
Volume confirmation on breakout
Dollar Index breaks below 97.50
Fed signals more rate cuts
Risk-on sentiment continues
Price Targets if Bullish:
Target 1: $1.3600 - Psychological level
Target 2: $1.3650 - Secondary resistance
Target 3: $1.3700 - Psychological level
Target 4: $1.3789 - 52-week high
Extended: $1.3850+ (new highs)
Bullish Catalysts:
+8% YTD momentum
Ascending channel intact
Fed rate cut expectations (2-3 cuts in 2026)
Dollar's worst year since 2003
BoE cautious on cuts vs Fed dovish
Sterling at 3-month highs
Best year since 2017
BEARISH SCENARIO - Pullback to Channel Support (40% Probability)
Trigger Conditions:
Rejection at $1.3520-$1.3560 resistance
Break below $1.3400 support
Dollar bounce on strong US data
Risk-off sentiment
BoE turns more dovish
Price Targets if Bearish:
Target 1: $1.3400 - Psychological support
Target 2: $1.3320 - Support zone upper boundary
Target 3: $1.3280 - Support zone lower boundary
Target 4: $1.3220 - Channel floor
Bearish Risks:
Near 3-month highs - natural resistance
Thin holiday volumes
Overbought after +8% YTD
Profit-taking risk elevated
Potential Dollar bounce
UK fiscal concerns (March 3 forecasts)
NEUTRAL SCENARIO - Consolidation in Range
Most likely short-term outcome:
Price consolidates between $1.3400-$1.3560
Thin holiday trading
Wait for January for directional clarity
Healthy consolidation before next leg
Channel support provides floor
MY ASSESSMENT - NEUTRAL with Bullish Bias
The weight of evidence favors bulls, but caution warranted at resistance:
Bullish Factors (Dominant):
+8% YTD - Best year since 2017
Ascending channel intact
Dollar's worst year since 2003 (-9.9%)
Fed rate cuts expected (2-3 in 2026)
BoE cautious vs Fed dovish
52-week high within reach
Technical rating: BUY
Higher highs and higher lows
Bearish Factors (Minor):
Near 3-month high resistance
Thin holiday volumes
Overbought short-term
Profit-taking risk
My Stance: NEUTRAL - Wait for Confirmation
The trend is clearly bullish with +8% YTD. The ascending channel is intact. Fed rate cut expectations continue to pressure the Dollar. However, price is testing critical resistance after a strong rally. Wait for breakout confirmation or pullback to support.
Strategy:
Wait for breakout above $1.3560 OR
Buy dips to $1.3280-$1.3320 support zone
Target $1.3650, $1.3700, $1.3789 (52-week high)
Stops below channel support
Don't chase at current levels
Respect the ascending channel
Trade Framework
Scenario 1: Breakout Trade Above $1.3560
Entry Conditions:
2H close above $1.3560
Volume confirmation
Dollar Index weakness
Trade Parameters:
Entry: $1.3565-$1.3580 on confirmed breakout
Stop Loss: $1.3480 below recent support
Target 1: $1.3650 (Risk-Reward ~1:1)
Target 2: $1.3700 (Risk-Reward ~1:1.4)
Target 3: $1.3789 (52-week high, Risk-Reward ~1:2.5)
Scenario 2: Buy the Dip at Support Zone
Entry Conditions:
Price pulls back to $1.3280-$1.3320 zone
Bullish rejection candle
Channel support holds
Trade Parameters:
Entry: $1.3280-$1.3320 at support zone
Stop Loss: $1.3200 below channel floor
Target 1: $1.3400 (Risk-Reward ~1:1)
Target 2: $1.3520 (Risk-Reward ~1:2.5)
Target 3: $1.3650 (Risk-Reward ~1:4)
Scenario 3: Channel Bottom Buy
Entry Conditions:
Price tests $1.3220 channel floor
Strong bounce with volume
Channel support holds
Trade Parameters:
Entry: $1.3220-$1.3250 at channel bottom
Stop Loss: $1.3180 below channel
Target 1: $1.3400 (Risk-Reward ~1:3)
Target 2: $1.3520 (Risk-Reward ~1:5)
Target 3: $1.3650 (Risk-Reward ~1:8)
Scenario 4: Rejection Short (Counter-Trend)
Entry Conditions:
Clear rejection at $1.3520-$1.3560
Bearish engulfing or pin bar
Dollar strength returns
Trade Parameters:
Entry: $1.3520-$1.3540 on rejection
Stop Loss: $1.3590 above resistance
Target 1: $1.3400 (Risk-Reward ~1:2.4)
Target 2: $1.3320 (Risk-Reward ~1:4)
Note: Counter-trend - smaller position size
Risk Management Guidelines
Position sizing: 1-2% max risk per trade
Respect the ascending channel
Buy dips, don't chase highs
Thin holiday volumes = wider stops
Scale out at targets
Move stop to breakeven after first target
Watch Dollar Index for confirmation
Monitor BoE and Fed commentary
Invalidation Levels
Bullish thesis invalidated if:
Price closes below $1.3220 (channel floor)
Ascending channel breaks down
Dollar Index surges above 100
BoE signals aggressive rate cuts
Bearish thesis invalidated if:
Price closes above $1.3789 (new 52-week high)
Channel breaks to upside
Dollar Index breaks below 96
Fed signals aggressive rate cuts
Conclusion
FX:GBPUSD is in a strong bullish trend, trading at $1.3498 within a well-defined ascending channel. Sterling has gained +8% YTD (best since 2017) as the Dollar weakens (-9.9% YTD, worst since 2003). The 52-week high at $1.3789 is within reach.
The Numbers:
Current Price: $1.3498
YTD Performance: +7.88%
1-Year Performance: +7.57%
52-Week High: $1.3789
52-Week Low: $1.2099
Dollar YTD: -9.9% (worst since 2003)
Key Levels:
$1.3789 - 52-WEEK HIGH (bullish target)
$1.3520-$1.3560 - Upper resistance zone
$1.3498 - Current price
$1.3400 - Psychological support
$1.3280-$1.3320 - Lower support zone
$1.3220 - Channel floor
The Setup:
Ascending channel intact. Fed rate cuts pressuring Dollar. BoE cautious on cuts. Sterling outperforming. All signs point higher, but respect resistance.
Strategy:
NEUTRAL stance - wait for confirmation
Buy breakout above $1.3560
Buy dips to $1.3280-$1.3320 support zone
Target $1.3650, $1.3700, $1.3789 (52-week high)
Stops below channel support
Respect the trend
The trend is your friend. Don't fight Sterling's momentum, but don't chase at resistance.

Regime Detection: The AI Trader's Secret Weapon
Your Strategy Didn’t "Stop Working" - The Market Regime Changed
Every trader knows the feeling:
Same signals
Same rules
Suddenly, completely different results
Most people call this "my edge stopped working".
Often, the truth is simpler: the regime changed, but your strategy didn’t.
---
What We Really Mean by "Regimes"
Regimes are just labels for how the market is behaving:
Trending vs ranging
High volatility vs low volatility
Risk‑on vs risk‑off
AI and systematic tools see this in the data:
ATR, realized volatility, and correlation spikes
Trend strength from measures like ADX
Clustered patterns in returns and volume
You feel it as:
"Breakouts keep failing now"
"Mean‑reversion is getting steamrolled"
"Options premium isn't decaying like it used to"
Same observation, different language.
---
Why Regime Awareness Is Mandatory in the AI Era
When you use AI or algo systems, you're often:
Running the same rules from last month
On today's data
If the rules were built in one regime and deployed in another, results will diverge.
AI can help by:
Classifying days/weeks into regime buckets
Tracking how each strategy performs in each bucket
Alerting you when the regime label flips
But you still have to decide how your playbook changes when the label changes.
---
A Simple Regime → Strategy Mapping
You don’t need complex ML to get started. Even a basic map helps:
Trending + Normal Vol → Trend‑following systems sized normally
Trending + High Vol → Same systems, reduced size, wider risk buffers
Ranging + Low Vol → Mean‑reversion and carry trades
Choppy + High Vol → Trade less, focus on defense, maybe only scalp
AI can refine the labels; your job is to define what each label means for you

BIDU mid-term TABaidu remains among the strongest in Chinese market in selected area, yes it's somewhat weakened on daily but the indicators are far more stronger comparing to Alibaba for example. And If we take weekly frame Baidu is significantly better in cash flow than many Chinese stocks in similar area.
There's no completed mid-term setup for an uptrend continuation yet but it's improving towards an uptrend. The current area between $115-125 remains to be a consolidation area. BIDU is among the stocks to keep an eye on for the potential uptrend.

Crude Oil Futures Closing the GAP this Week?📊 CRUDE OIL FUTURES (FEB 2026) TECHNICAL ANALYSIS
"The goal of a successful trader is to make the best trades. Money is secondary." — Alexander Elder
The Crude Oil Futures (CLG2026) chart on the 1-hour timeframe shows a significant bearish breakdown as we head into late December 2025. Sellers have taken control after a period of distribution near the recent highs.
📉 CURRENT PRICE ACTION
Ticker: CLG2026 (Crude Oil Feb '26)
Price: 56.93 (+0.05% in the current session)
Trend: The market has experienced a sharp "flush" from the 58.40 level, breaking through multiple support zones in a single high-momentum move.
🚀 CRITICAL LEVELS TO WATCH
UPWARD RESISTANCE
Entry Zone: 58.40 (This was the previous distribution peak and acts as significant resistance on any bounce).
Previous Support: 57.80 (The blue line now acts as a technical "ceiling" for short-term recovery).
DOWNWARD SUPPORT
Market Closing Price: 56.94 (Current area of consolidation following the breakdown).
Target Gap: 56.53 – 56.60 (The chart indicates an "Open Gap" that hasn't been filled yet; price is gravitating toward this zone).
📈 MOMENTUM AND PATTERNS
Distribution Box: The yellow box near the top shows the price struggling to move higher before the aggressive sell-off.
Breakout Move: A large yellow rectangle highlights the high-velocity downward move that invalidated the previous bullish structure.
Gap Theory: The orange arrow points directly to the lower gap, suggesting a high probability that the price will hit the 56.50 range before finding new buyers.
🔍 TRADING STRATEGY
Bearish Bias: The overall short-term outlook is bearish as long as the price remains below 57.80.
Gap Fill Play: Traders are likely watching for a move into the 56.60 "Gap" zone to look for potential "exhaustion" or reversal signs.
Wait for Rejection: If the market rallies back to 57.14, look for rejection candles to confirm the downtrend's continuation.
#CrudeOil #OilTrading #FuturesTrading #TechnicalAnalysis #Commodities #CLG2026 #WTI #TradingStrategy #MarketUpdate
