USDT.D Breaks Out, Altcoin Correction Ahead?USDT.D has broken above the resistance trendline and is now forming higher highs and higher lows, a clear sign of a bullish structure shift.
If the price breaks above the next resistance, we could see more correction across altcoins.
Keep an eye on USDT.D and stay tuned for further updates.
DYOR, NFA
Tether

Can USDT.D break its high ? | USDT.D 4H Analysis🥳 Hey everyone! Hope you’re doing great! Welcome to SatoshiFrame channel .
✨ Today we’re diving into the 4-Hour Ethereum analysis. Stay tuned and follow along!
💵 Can USDT.D break its high & cause crypto drop again ? Tether Dominance is hovering near the 5% zone after the Trump tariff rumors — a key resistance that perfectly aligns with the crypto market’s bottom. A breakout here could trigger another leg down across altcoins.
👀 4-hour timeframe of Tether Dominance and we can see that after breaking the 4.6% area, it gave us a confirmation for an uptrend, and in this area, it also formed a higher low compared to its previous low. It easily broke through several resistance levels and reached its top at the 5.16% area, where it is now rejected. Since we are in the holiday period, we have faced weak downward momentum, and now several breakout triggers have formed on the Tether dominance chart which, with Tether volume passing through these areas, the market can start its next move. Note that this top that has currently formed is the same as the bottom of the altcoins that we see on various charts, so breaking this top will not be easy.
🧮 The RSI oscillator can be a great help to us in this analysis, as it allows us to better identify the tops and bottoms of Tether dominance. If the oscillation passes through those desired areas, we can take positions on coins contrary to the direct supply and demand of the chart itself. The 74 oscillation zone is slightly above the overbought boundary, and crossing this area can increase the oscillation volume of Tether buy trades and cause the crypto market to lose its bottom. The next important area is the 50 zone, where a reaction to this area or passing the oscillation limit from this area can form a lower top for Tether dominance and then give us confirmation to start a bullish leg in the market.
🕯 The size of the Tether dominance candles during the rise was significantly smaller but closed with more strength, while during reactions and pullbacks, the size and number of candles increased, which informs us of the weakness of the Tether sellers' trend. A noteworthy point for Tether dominance is the rejection it received from the top and then moved downward, facing weak upward momentum. If the market bottom is in this area and the Tether dominance top is also in this area and this top does not break, the market can soon tend toward a trend change and a drop in dominance may occur.
❤️ Disclaimer : This analysis is purely based on my personal opinion and I only trade if the stated triggers are activated .

Can USDT.D break the Taker Seller Zone ? | USDT.D 1H Analysis👋 Hey everyone! Hope you’re doing great! - ❤️ Welcome to Satoshi Frame .
📅 Today we’re diving into the 1-hour Bitcoin analysis. Stay tuned and follow along!
👀 On the 1-hour timeframe of USDT.D, we can see that after the news of Trump imposing tariffs on China, USDT.D experienced an extremely sharp pump — rising from below 4.3% to near 5%. After that, it formed a trading-range box in this zone. The top of this box lies around 4.89%, overlapping with a “taker-seller” resistance zone where Tether’s market share is currently capped. There’s a key midline at 4.74% and a bottom at 4.59%, completing this trading-range pattern. Price has tested the top three times but failed to break it, meaning USDT.D remains trapped below resistance. A 15-minute multi-timeframe Low has also formed at 4.83%, creating a new structure that, if broken, could trigger Tether selling.
🧮 Looking at the RSI oscillator, since October 12 it has tried three times to enter its 1-hour OverBuy zone but failed each time. Each rejection from around the 70 level led to selling pressure and movement back toward its 50 support zone. This 50 level is a very important static resistance — a breakout above it could push USDT.D toward higher resistance levels. The 50 RSI zone also overlaps with the 4.83% price level, meaning if that area is lost, selling pressure and volume decline could begin.
🕯 The size and volume of recent USDT.D candles show weakness every time it reaches the 4.89% top. Breaking the taker-seller zone will require a large “whale” candle — a strong, high-volume bullish move that can fully absorb the sell orders placed there. In short, breaking this level needs a strong price surge and maximum buying pressure.
🧠 To manage or open new positions using USDT.D as a guide, we can consider these scenarios:
🟢 Breakout of the taker-seller zone: This breakout could be triggered by news or even a Trump tweet :) From a technical standpoint, this area needs a massive, high-volume “whale” candle so that all sell orders in this zone get filled instantly. Once price surges and holds above it, the next resistance would be around 5.1%.
🔴 Break of the 15-minute multi-timeframe Low: This Low sits at 4.83%. A confirmed close below it could signal the start of selling and volume decline. In this scenario, the next support for USDT.D would likely be the box midline — around 4.74%.
❤️ Disclaimer : This analysis is purely based on my personal opinion and I only trade if the stated triggers are activated .

Plasma: A Fundamental and Technical Bet on Stablecoin PotentialToday we’re talking about Plasma, in my opinion the most interesting project in recent years. From a fundamental analysis perspective, it’s a must-have bet considering the potential of stablecoins in the near future and Tether’s involvement in the project. That said, from a technical analysis viewpoint, the price has bounced off the support created by Binance’s perpetual listing. I’d expect a quick acceleration toward $1.6, which is currently the most significant reversal point. At that moment, it will be crucial to see if the market is strong enough to break the all-time high and continue rising, or if the price will be rejected and fall back to the established support. In any case, the project has enormous potential, and at a $1 billion market cap, I believe it’s a great bet. Thanks to everyone for your attention.

USDT.D 4H Analysis - Key Triggers Ahead☃️ Welcome to the cryptos winter , I hope you’ve started your day well.
⏰ We’re analyzing USDT Dominance on the 4-Hour timeframe .
👀 On the 4-hour timeframe, USDT Dominance has started to recover after its recent drop, bouncing from the support zone at 4.17% and now moving upward, forming a reaction to the previous bearish leg. The structure shows a steep descending trendline, and once broken and confirmed above, dominance could move toward its next resistance zones and enter a correction phase relative to its previous leg. The key resistance levels to watch are 4.33% and 4.38%.
🧮 The RSI oscillator currently faces a static resistance around 45. If volatility pushes above this level and holds, it would confirm bullish momentum and act as a signal for correction continuation.
🕯 The recent candles on Tether Dominance have shown range-bound behavior with weakening bearish pressure, while the 4.17% support has attracted buyers — causing an increase in bullish candles and momentum toward upper resistance zones. A breakout above the descending trendline could confirm a corrective move upward, which seems quite plausible given the current 4H candle structure.
🧠 For profit-taking strategies, you may consider securing partial profits from your open long positions, or moving your stop-losses into profit to protect gains. Meanwhile, start refreshing your watchlist and identifying new price triggers so that you can re-enter positions after reaction or breakout confirmations from upcoming setups.
❤️ Disclaimer : This analysis is purely based on my personal opinion and I only trade if the stated triggers are activated .

USDT Dominance Hits Major Resistance – What’s Next for Crypto?📊 On the 4H timeframe, USDT dominance (USDT.D) is approaching the 4.60% – 4.70% resistance zone, a level that has repeatedly triggered strong rejections in the past.
🔹 Primary Scenario
A rejection from this resistance is the more likely outcome. If confirmed, it could signal a bullish move for Bitcoin and altcoins as capital flows back into risk assets.
🔹 Alternative Scenario
If USDT.D manages to break and hold above 4.70%, this would indicate risk-off behavior in the market, potentially leading to increased selling pressure on crypto assets.
⚖️ Summary:
• 🔻 Rejection at resistance → Positive signal for crypto rally
• 🔺 Break & hold above 4.70% → Warning of further downside in crypto

USDT.D 1H Analysis - Key Triggers Ahead👋🏻 Hey everyone! How’s it going? Hope you’re all doing well.
❄️ Welcome to Crypto Winter.
⏰ Today, we’ll be analyzing USDT.D and exploring its potential opportunities.
👀 On the 1H timeframe of USDT dominance, we noticed that after touching the support zone, we were expecting a breakdown. However, with a fake-out, it reversed and is now correcting upwards. The next resistance for USDT dominance could be around 4.34%.
🧮 The RSI oscillator is approaching the key level around 70 (overbuy zone). If USDT dominance enters this area, it could trigger a deeper correction in the market.
🕯 The green candles in USDT dominance (profit-taking and closing of long contracts) are gradually increasing. We should watch closely how these candles react as we approach the 4.34% resistance level.
🧠 Since we don’t want to open shorts here, the best strategy is to wait and see how USDT dominance reacts before entering any positions. This is very important. In the meantime, we can build a watchlist and focus on other setups.
❤️ Disclaimer : This analysis is purely based on my personal opinion and I only trade if the stated triggers are activated .

#USDT Dominance :- Altseason knocking the door?If you realised gains last week, consider booking partial profits while USDT remains above a 283-day support level.
The price structure resembles a head and shoulders formation, a typically bearish signal. A break of that support could trigger significant selling across the altcoin market.
If you need more updates, hit that like button and share your views in the comments section.
Thank you
#PEACE

Bitcoin Maxis - Brace for Impact !!!🚨 Bitcoin Maxis, brace for Impact 🚨
There is clear, recent evidence that Tether is actively diversifying its reserves and investments by both selling some of its Bitcoin holdings and significantly increasing its exposure to gold, including direct investments in gold mining:
1. Selling Bitcoin and Buying Gold
Tether has reported substantial profits from both Bitcoin and gold price appreciation. In 2024, the company booked. How does Tether generate its profits beyond Bitcoin and gold investments?" with \5 billion coming from unrealized appreciation of its gold and Bitcoin holdings. However, recent reports indicate Tether has been increasing its gold reserves while adjusting its Bitcoin treasury. For example, Tether disclosed holding $8.7 billion in gold bars in its Q2 2025 attestation report, and its gold-backed stablecoin (XAU₮) is backed by over 7.7 tons of physical gold as of April 2025.
2. Entering Gold Mining
Tether is in active discussions to invest in gold mining, aiming to channel its crypto profits into the metals market. CEO Paolo Ardoino has publicly referred to gold as “natural Bitcoin” and expressed a strong affinity for gold as a foundational asset. The company is exploring opportunities across the entire gold supply chain, including mining, refining, and trading.
Tether has already invested over $200 million in Elemental Altus Royalties, a Canadian firm that buys future revenue streams from gold mines, giving Tether exposure to multiple mines with less operational risk.
3. Strategic Shift
Tether’s move into gold and gold mining is part of a broader diversification strategy, which also includes investments in AI, Bitcoin mining, and other sectors. The company’s leadership has repeatedly emphasized gold’s role as a hedge and a complement to Bitcoin.
In summary, Tether is not only selling some Bitcoin and buying gold but is also directly entering the gold mining sector as part of its diversification and profit deployment strategy.
Sources:
www.zerohedge.com
www.coindesk.com
www.fxleaders.com
bitcoinethereumnews.com
BITSTAMP:BTCUSD NASDAQ:TSLA NASDAQ:NVDA NASDAQ:MSTR TVC:DXY TVC:GOLD TVC:SILVER VANTAGE:SP500 FX:EURUSD COINBASE:USDTUSD AMEX:NUGT AMEX:GDX

USDT Dominance Update – Market at a Turning PointUSDT Dominance got rejected from the 4.55% – 4.60% resistance zone and is now consolidating right on the dynamic yellow trendline and the white diagonal support.
📊 Key Points:
• This area is a critical decision zone.
• Holding above support could trigger another push toward 4.55–4.60%.
• But a clean breakdown below 4.44% may open the way to 4.35% – 4.30%, which would be very bullish for altcoins.
⚡ Conclusion: USDT dominance is at a major crossroad – the next move will likely define the short-term direction for both Bitcoin and altcoins.

Massive Altcoin Move Coming – Eyes on USDT.DUSDT.D has broken above the resistance line and is now facing resistance at the key S/R zone along with the super trend level.
If USDT.D breaks above this zone, we could see a deeper correction in altcoins. On the flip side, if it gets rejected and starts moving lower, it could trigger a healthy upside move in alts.
The best move right now is to wait for clear market direction instead of chasing random trades. Once the breakout or rejection confirms, I’ll share a detailed trade setup for the next move, whether up or down.

USDT Dominance – Breakout, Retest & Ready for Next MoveUSDT Dominance has just broken above its descending trendline and successfully retested it as support. After this pullback, the chart suggests a continuation to the upside within the ascending channel.
🔹 Technical Highlights:
• Breakout from the falling trendline confirmed.
• Retest completed around 4.35% → holding as support.
• Price action remains within a short-term ascending channel.
• Next upside target: 4.55% – 4.60% (marked as point G).
📊 Market Implication:
Rising USDT Dominance usually means liquidity flows out of riskier assets (altcoins) into stablecoins. If this uptrend continues, altcoins could face further downward pressure while traders seek safety.
✅ Conclusion:
As long as dominance holds above 4.30–4.35%, the bullish scenario remains intact. A push toward 4.55% is likely the next move.

Tether Dominance: Wave B Bounce Before the Next Drop?This 1H chart of USDT Dominance shows the completion of a clear 5-wave impulsive advance, followed by a corrective decline that we can label as Wave A.
Now, signs suggest that Wave A is completed, and the market is preparing for a Wave B bounce.
🔹 Key observations:
• Wave A corrective structure has likely bottomed.
• Wave B is expected to retrace upward, targeting the descending trendline resistance.
• Once Wave B is complete, a Wave C decline is anticipated, continuing the corrective phase.
⚠️ Invalidation: A decisive breakout above the trendline would negate the corrective count and signal a potential bullish extension.
⸻
📌 Summary
Near-term outlook suggests a relief rally (Wave B) toward resistance, followed by a Wave C correction lower, as long as price respects the descending trendline.

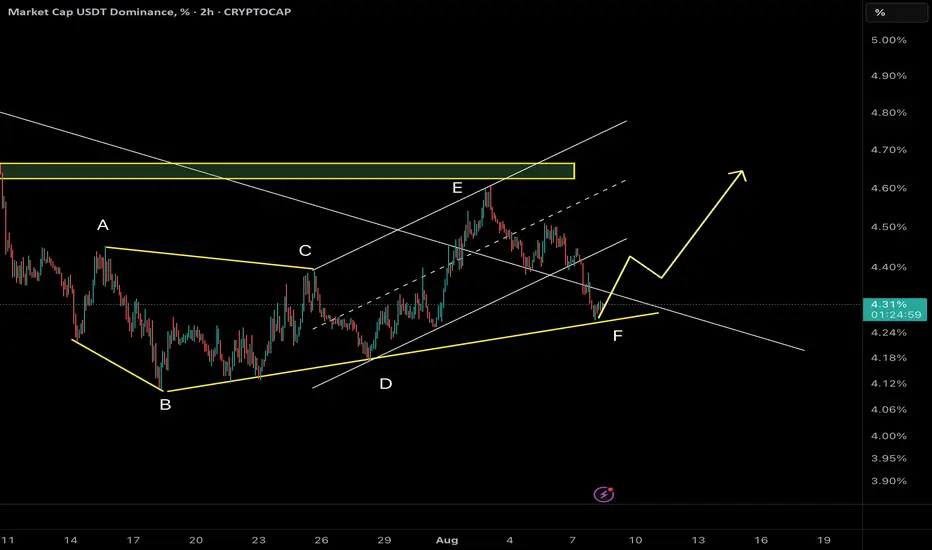
USDT Dominance – Precision Repeats: Final Wave F or Wave G Awake🔸 Market Structure:
Following the previous analysis, which precisely reached both projected targets, Tether Dominance continues unfolding its Diametric formation. After completing Wave E, price action has decisively shifted into Wave F, progressing toward the final stages of this structure.
⸻
🔸 Key Observations:
• The prior scenario anticipated a corrective decline, and price perfectly respected both the 4.40% and 4.28% targets before stabilizing.
• Currently, price is testing the ascending trendline and mid-range of the Diametric.
• Momentum remains corrective but has yet to show clear exhaustion.
⸻
🔹 Scenario 1 (Sc1) – Shallow Wave F Completion (~4.22%):
• Support around the minor ascending trendline.
• May trigger an early bounce if buyers step in.
• Less balanced geometrically for a clean Diametric conclusion.
🔹 Scenario 2 (Sc2) – Extended Wave F Completion (~4.12%):
• Aligns with the lower boundary of the Diametric.
• Provides better proportion and symmetry to finalize Wave F.
• Coincides with prior demand zone and the last reaction pivot.
• Statistically, this remains the higher probability path.
⸻
🎯 Expected Path:
Wave F is approaching maturity, and a deeper test near 4.12% remains likely before any sustainable reversal. Upon confirmation, this could trigger the start of Wave G upward, historically associated with altcoin weakness.
⸻
📌 Summary:
After executing the prior analysis with precision, USDT Dominance has advanced into the final legs of Wave F within the Diametric. Monitoring price behavior near 4.12% will be critical. A bounce here could catalyze Wave G and renewed pressure on altcoins. Should short-term support at 4.22% fail convincingly, deeper retracement becomes even more probable.
⸻
✅ Action Plan:
Closely track the reaction zones at 4.22% and 4.12%. A strong reversal signal (e.g., bullish divergence) could confirm the transition to Wave G.
Tether Rakes in $4.9B Q2 Profit, Cementing Its Reign as Crypto’sTether Q2 Net Profit Hits $4.9 Billion, Pushing Total Earnings to $5.7 Billion: What It Means for the Crypto Industry
Tether Holdings Ltd., the issuer of the world’s largest stablecoin USDT, has once again made headlines with its Q2 2025 earnings report, revealing a staggering net profit of $4.96 billion. This brings the company’s total profits for the first half of the year to $5.7 billion—a record-breaking milestone for both the company and the broader stablecoin ecosystem.
This article explores the implications of Tether’s Q2 performance, the sources of its revenue, its impact on the crypto markets, and the growing significance of stablecoins in the evolving financial landscape.
________________________________________
A Record-Setting Quarter for Tether
Tether’s Q2 2025 results have astonished even seasoned analysts. The company’s reported $4.96 billion in net profit in a single quarter represents one of the most profitable periods in the history of any fintech or crypto-native company. What’s even more remarkable is that this profit was not driven by speculative trading or token sales, but by conservative, yield-generating strategies rooted in traditional finance.
The company’s Q1 earnings were already impressive at $0.76 billion, but Q2’s results eclipse those numbers entirely. Tether’s cumulative profit year-to-date now stands at $5.72 billion, putting it on track to potentially exceed $10 billion in earnings for the full year if current trends continue.
________________________________________
What’s Driving Tether’s Massive Profit?
Tether’s incredible profitability is primarily fueled by one key factor: the interest earned on its reserves. As the issuer of USDT, Tether is responsible for maintaining a 1:1 backing of every token in circulation. These reserves are primarily held in short-term U.S. Treasury Bills (T-Bills), reverse repos, and cash equivalents.
Here’s a breakdown of the main profit drivers:
1. High Interest Rates on U.S. Treasuries
With the U.S. Federal Reserve maintaining elevated interest rates to combat inflation, short-term T-Bills have become highly lucrative. Tether holds tens of billions of dollars in these instruments, generating billions in annual interest income.
For example, the yield on a 3-month Treasury bill in Q2 2025 averaged around 5.2%, and Tether’s reserve base has hovered near $90 billion to $100 billion. Even a conservative allocation can earn several billion dollars in annual yield.
2. Reverse Repurchase Agreements (Reverse Repos)
Tether has also expanded its use of reverse repos, which allow it to lend cash to counterparties in exchange for securities, earning a premium on the transaction. This has contributed significantly to its earnings, especially in a high-yield environment.
3. Gold Holdings and Bitcoin Exposure
Tether has acknowledged that a small portion of its reserves includes gold and Bitcoin holdings. These assets appreciated in Q2, contributing to the overall profit. While not the primary revenue source, their performance added notable value during the quarter.
4. Equity Investments
The company has begun investing in infrastructure and technology firms related to blockchain and AI. While these investments are not liquid, mark-to-market gains may have also contributed to the net profit figure.
________________________________________
A Closer Look at Tether’s Reserve Report
Tether’s Q2 attestation report, published alongside its earnings update, provides transparency into how its assets are allocated. Here are some highlights:
• Over 85% of reserves are held in U.S. Treasury instruments
• $5.4 billion in excess reserves—a buffer above the value of circulating USDT
• $3.3 billion in gold and Bitcoin holdings
• Minimal exposure to unsecured commercial paper or riskier debt instruments
Tether has continuously emphasized its commitment to transparency and risk management. Unlike in its early years, when it faced criticism over opaque reserve practices, the company now releases quarterly attestations audited by third-party firms such as BDO Italia.
________________________________________
USDT’s Growing Dominance
Tether’s profits are closely tied to the growth of its flagship product: USDT, the world’s largest stablecoin by market cap. As of August 2025, USDT has a circulating supply exceeding $110 billion, giving it a dominant share of the stablecoin market.
This growth can be attributed to several factors:
1. Increased Adoption in Emerging Markets
USDT is widely used in countries with unstable fiat currencies, such as Argentina, Nigeria, and Turkey. For many users, USDT represents a dollar-denominated safe haven in environments plagued by inflation and capital controls.
2. DeFi and Cross-border Payments
USDT continues to be a core asset in decentralized finance (DeFi) protocols, serving as a stable medium of exchange and collateral. It's also a preferred tool for cross-border remittances, given its speed and low transaction costs compared to traditional banking systems.
3. Institutional Integration
Major crypto exchanges, custodians, and payment processors have incorporated USDT into their platforms, driving further liquidity and utility. In many cases, USDT is preferred over fiat due to its 24/7 availability and blockchain-native nature.
________________________________________
What Does This Mean for the Crypto Industry?
Tether’s Q2 performance is more than just a corporate milestone—it’s a bellwether moment for the crypto industry. It signifies the maturation and institutionalization of digital assets and stablecoins. Here’s what it means for the broader ecosystem:
1. Stablecoins as Profitable Financial Products
Tether’s profitability proves that stablecoins are no longer just “crypto plumbing.” They are now financial products generating billions in yield, much like money market funds. This is reshaping how investors and regulators think about stablecoins—not as speculative tools, but as interest-bearing assets backed by real-world securities.
2. Regulatory Scrutiny Will Intensify
With Tether generating profits that rival traditional banks, expect regulators to increase oversight. Stablecoins have long been in the crosshairs of the U.S. Treasury, SEC, and global central banks, and Tether’s dominant market share will likely place it under further examination.
However, Tether’s transparency efforts, including quarterly attestations and reserve disclosures, may help it navigate these regulatory waters more effectively than in the past.
3. Competition Will Escalate
Tether’s extraordinary profits will likely attract new entrants and existing competitors to the stablecoin arena. Circle’s USDC, PayPal’s PYUSD, and even central bank digital currencies (CBDCs) are all vying for market share.
Tether’s early-mover advantage, global reach, and deep liquidity make it hard to displace, but increased competition could pressure margins in the long term.
4. Decentralized Alternatives Will Seek Market Share
Decentralized stablecoins like DAI, FRAX, and USDD aim to offer alternatives to centralized issuers like Tether. While they remain relatively small, the ethos of decentralization might gain appeal, especially in regulatory-heavy environments.
Still, decentralized stablecoins have struggled to maintain pegs during market stress, giving Tether an edge in terms of trust and resilience.
________________________________________
The Road Ahead for Tether
As Tether moves into the second half of 2025, several strategic themes will define its trajectory:
Continued Profitability
If interest rates remain elevated and USDT circulation continues to grow, Tether’s annual profit could reach or exceed $10 billion—putting it in league with the most profitable fintech firms globally. This surplus could be reinvested in:
• Infrastructure expansion
• Strategic acquisitions
• Reserve diversification
• R&D for stablecoin innovation
Expansion into Emerging Markets
Tether has hinted at expanding its presence in Latin America, Africa, and Southeast Asia, where demand for dollar-denominated assets is high and banking infrastructure is limited. Expect to see more localized partnerships and on-ramp/off-ramp solutions.
Embracing Blockchain Innovation
Tether is already deployed on multiple blockchains—Ethereum, Tron, Solana, and more. The company is likely to support new Layer 1s and Layer 2s to enhance speed, reduce costs, and maintain competitiveness in the DeFi space.
There are also rumors that Tether may be exploring tokenized asset offerings and programmable money features, allowing USDT to integrate more deeply with smart contracts and enterprise use cases.
________________________________________
Criticisms and Controversies: Still Lingering?
Despite its success, Tether continues to face criticism from parts of the crypto community and regulatory world. Concerns include:
• Lack of full audits (attestations are not the same as full financial audits)
• Opaque ownership structure
• Past legal issues, including settlements with the New York Attorney General and the U.S. CFTC
However, it’s worth noting that Tether has addressed many of these concerns over the past two years. Its transparency has improved, and its operations have become more conservative and professional.
Still, its scale and impact on the crypto market mean that any misstep could have systemic consequences. Investors and regulators alike will continue to scrutinize its activities.
________________________________________
Final Thoughts: Tether’s Moment of Ascendance
Tether’s Q2 2025 net profit of $4.96 billion doesn’t just reflect a successful quarter—it marks a paradigm shift in crypto finance. What began as a controversial stablecoin project has evolved into a global financial powerhouse, rivaling traditional banks and asset managers in profitability.
More than just a win for Tether, this moment signals the growing legitimacy of stablecoins in the global financial system. It shows that crypto-native firms can not only survive but thrive in traditional financial environments, leveraging yield, transparency, and blockchain infrastructure to create sustainable business models.
As the world watches, Tether’s next chapters will likely be shaped by innovation, regulation, and global expansion. But for now, with $5.7 billion in profits in just six months, one thing is clear:
Tether is no longer just a stablecoin issuer—it’s one of the most powerful financial entities
in the digital age.
________________________________________
Disclaimer: This article is for informational purposes only. It does not constitute financial advice. Always conduct your own research before making investment decisions.
100% Win Rate on BTC & Alts! Where’s the Next Breakout?USDT Dominance Update:
While the herd chases the latest hype, we called this before it even unfolded. BTC’s recent surge was lightning-fast.
These were the trades shared in the last 30 days. I'm just saying we could've had more wins!
Our setups didn’t just hit targets…
They exploded through them 🚀
These are spot gains, imagine trading wth leverage with these.
There's more to come in the next week.
✅ MIL:ENA +53%
✅ HOSE:VIC +50%
✅ $CHILLGUY +40%
✅ NASDAQ:HUMA +35%
✅ CRYPTOCAP:XRP +34%
✅ $VOXEL +32%
✅ OMXTSE:MAGIC +30%
✅ CRYPTOCAP:RENDER +25%
✅ CRYPTOCAP:AVAX +24%
✅ SEED_DONKEYDAN_MARKET_CAP:FLOKI +25%
✅ CRYPTOCAP:LINK +17.65%
✅ CRYPTOCAP:SUSHI +17.3%
✅ AMEX:MBOX +15%
✅ $MAVIA +14.7%
✅ TVC:MOVE +11.66%
✅ $EPT +11%
✅ BME:ETC +10.3%
✅ PSX:POL +20%
✅ CRYPTOCAP:SUI +20%
✅ LSE:ONDO +7.5%
✅ SET:PORT +6.17%
✅ CRYPTOCAP:TON +3%
📈 These aren’t just simple trades; they’re alpha-backed calls.
If you’re still watching from the sidelines…
You’re watching others print.
Be patient and precise with your entries and exits. Never FOMO.
The market will bait you into bad timing if you let it.
A 4.4% drop in USDT dominance marks the start of a new altcoin season, but remember, BTC will steer this cycle.
More setups on the way.
Stay tuned.
Do hit the like button and share your views in the comments.
Thank you
#PEACE

USDT Dominance Locked in Range – Altseason Not Ready Yet?USDT Dominance has been trading inside a wide sideways range for the last 567 days — bouncing between the 3.6% demand zone and the 6% supply zone.
The recent price action shows a rejection from the top of the range and now heading toward the mid or lower part of the channel. A minor trendline (in red) had shown some short-term support, but it looks weak now.
As long as this range holds, true altseason may remain on pause. The big move will come only when USDT.D breaks out or breaks down from this range.

USDT.D Showing Signs of Bounce – Altseason at Risk?USDT Dominance is still moving within a rising parallel channel, holding just above the nearest support zone. After a brief dip, price is now showing signs of recovery from the lower boundary of the channel.
However, the key resistance zone near the top of the channel has proven tough to break — it rejected price on the last attempt.
Until we get a clear breakout or breakdown from this channel structure, the market may remain choppy. A breakout above 5.00% could signal risk-off sentiment (bad for alts), while a drop below the support zone may trigger altcoin momentum.
Stay cautious — the market is still undecided.

Stablecoins will Supercharge Cryptos AdoptionCME: Micro Bitcoin Futures ( CME:MBT1! ), #microfutures
On June 5th, Circle Internet Group ( NYSE:CRCL ), issuer of the #USDC #stablecoin, debuted its initial public offering at $31 per share. By June 23rd, NYSE:CRCL prices peaked at $298.99, up nearly ten folds in just 13 trading days.
At Friday's closing of $180.43, Circle has a market cap at $40.2 billion. Wall Street gave a mindboggling price earnings ratio of 234, based on Circle’s $0.77 earnings per share.
How to Invest in Stablecoins
Stablecoins are cryptocurrencies that aim to maintain price stability. Both USDC and #USDT (issued by #Tether) peg their value to the US dollar. Paying $1 for 1 stablecoin, you will get exactly $1 back in one month, one year, or ten years. Unlike buying Bitcoin, there is no investment return for holding stablecoins. So why would anyone want them?
Because stablecoins are not investment instruments, instead, they are payment methods. Like PayPal and Apple Pay, USDT and USDC enable users to move money fast and cheaply globally, but now in the crypto world.
How do stablecoin issuers make money? They generate revenue through interest on reserves, transaction fees, lending, and partnerships with financial institutions.
• The biggest source of revenue is interest income. When it comes to stablecoin issuers, size matters, and the Fed matters.
• Based on a study by Artemis, Castle Island Ventures, and Dragonfly on May 29th, USDT and USDC have a combined market capitalization of over $214 billion.
• With the Fed Funds rate averaging above 5% last year, the $214 billion reserve investing in Treasury and other high-quality bonds could yield at least $12 billion between Tether and Circle.
• Tether reported 2024 profit of $13 billion, while Circle generated $1.68 billion last year.
Investing in stablecoins means buying Circle stock, not converting cash into USDC. The difference is like buying Apple stock vs. adding money in your Apple Pay account.
Headwinds and Tailwinds
On June 17th, the US Senate passed the GENIUS Act of 2025. It establishes a regulatory framework for the $250 billion market for stablecoins. “Stablecoins are a paradigm-shifting development that can bring our payment system into the 21st century", declared Sen. Bill Hagerty of Tennessee, who introduced the bill.
With regulatory certainty, real-world utility and adoption will quickly follow. The future for stablecoins is very bright, and I expect the market size to double soon. However, market leaders Tether and Circle both face strong headwinds going forward.
• Real world utility brings in fierce competition. Big banks and credit card issuers will create their own stablecoins to keep customers on the book. This will slow down Tether’s and Circle’s efforts to attract mainstream financial investors.
• I expect the Fed to cut interest rates by a lot during the remaining 3-1/2 years of the Trump Administration. Some cuts will happen under the current Fed Chair. A lot more will come by his successor beginning June 2026. Lowering interest rates by 100-200 basis points will cripple stablecoin issuers’ main income.
In my opinion, the high dependency in growth and interest rate policies make NYSE:CRCL a very risky investment at the current lofty valuation.
Bullish Signal for Bitcoin
In the past, stablecoins were mainly used by crypto investors. Going forward, mainstream investors will find compelling offerings from their banks, stockbrokers and credit card companies. When mainstream financial intermediaries begin making serious inroad into cryptos, there will be a paradigm shift.
In my opinion, the new development in stablecoins will supercharge the growth of crypto market size. Bitcoin, being well established as a Digital Gold, will benefit the most from the global asset reallocation to cryptocurrencies.
An investor sharing a bullish view on bitcoin could explore the CME Micro Bitcoin Futures ( LSE:MBT ).
Last Friday, the August MBT contract (BTCQ5) was settled at 108,640. Each contract has a notional value of 0.1 bitcoin, or a market value of $10,864. To buy or sell 1 contract, trader is required to post an initial margin of $2,598. The margining requirement reflects a built-in leverage of 4-to-1, which is more cost-effective that buying bitcoins from any ETF fund.
A long MTC strategy with a stop-loss would enhance the returns while limiting the potential losses. Below is a hypothetical trade for illustration purposes only:
On Day T+0, buy 1 BTCQ5 at 108,640 and set a stop loss at 105,000
• The portfolio value is 10,864
• Upfront margin is $2,598
Rising Bitcoin Scenario: On Day T+N, Bitcoin goes up 20% to $130,368
• Futures gain will be $2,172.8 (= (130368-108640) x 0.1)
• Investment return will be +86.6% (= 2172.8 / 2598), excluding transaction fees
• This compares to a 20% gain with bitcoin ETF, with no leverage
Falling Bitcoin Scenario: On Day T+N, Bitcoin drops 20% to $86,912
• With a stop-loss at 105,000, losses will be capped at $364 (= (108640-105000) x 0.1)
• Investment return will be -14% (= -364 / 2598)
• This compares to a 20% loss with bitcoin ETF, with no stoploss provision
Happy Trading.
Disclaimers
*Trade ideas cited above are for illustration only, as an integral part of a case study to demonstrate the fundamental concepts in risk management under the market scenarios being discussed. They shall not be construed as investment recommendations or advice. Nor are they used to promote any specific products, or services.

USDT.D Consolidation Near Breakout Zone – Eyes on the Next MoveHello traders, here is the USDT.D update:
The chart is currently hovering near a major resistance zone, one that historically plays a key role in triggering altseason.
After a period of consolidation inside the mid-range S/R zone, price is now testing the downtrend line from above. A clear rejection here could spark renewed confidence in altcoins, giving them space to rally.
On the flip side, a breakout above this level may delay altseason momentum, as capital remains parked in stablecoins.
For now, this zone is the make-or-break area for altcoin sentiment. Keep it on your radar, the next move could set the tone for the coming weeks.

Tether Dominance matters!USDT #tether dominance is forming a bullish flag in lower time chart. If #usdtd manages to breakout, the next wave of correction will hit #bitcoin and #altcoins. If USDT.d loses %4.75 , that will be the invalidation.

Bitcoin’s Decentralization Is a Fairy TaleBitcoin was born as a revolutionary, decentralized currency, promising financial freedom and independence from traditional banking systems. Yet, as we analyze its real-world distribution, it becomes clear that Bitcoin’s decentralization is more myth than reality.
🔍 The Illusion of Decentralization
Bitcoin operates on a decentralized blockchain, meaning no single entity controls the network. However, when we examine who actually owns Bitcoin, we see a highly concentrated wealth structure that mirrors traditional financial inequality.
📊 Bitcoin’s Wealth Concentration
The top 0.01% of Bitcoin wallets control over 37% of total supply.
The top 1% of Bitcoin holders control over 40% of Bitcoin.
The top 2% of Bitcoin wallets control over 95% of total supply.
The bottom 98% of wallets hold less than 5% of Bitcoin.
The bottom 50% of wallets hold less than 0.03% of Bitcoin.
10,000 Bitcoin investors own 5 million BTC, worth $230 billion.
Institutional investors and early adopters dominate Bitcoin ownership.
This means that a tiny fraction of wallets dominate the entire market, while millions of small holders own completely insignificant amounts.
💰 Bitcoin vs Traditional Wealth Inequality
Bitcoin was supposed to be more equitable than traditional finance, but its wealth distribution is even more extreme than global financial inequality.
Bitcoin’s wealth gap is far worse than traditional financial inequality, proving that decentralization does not mean fair distribution.
📉 How Did Bitcoin Become So Centralized?
1. Early Adopters Accumulated Massive Holdings
Bitcoin’s first miners and tech-savvy investors acquired BTC when it was nearly worthless.
Many of these wallets still hold huge amounts, making redistribution difficult.
2. Institutional Investors Took Over
Hedge funds, exchanges, and corporations now control a massive portion of BTC.
Bitcoin ETFs and custodial wallets concentrate ownership even further.
3. Lost & Dormant Bitcoin Shrinks Circulating Supply
An estimated 29% of Bitcoin is lost or inactive, meaning fewer coins are available.
This makes the remaining BTC even more concentrated among active holders.
🚨 The Harsh Reality: Bitcoin Is Not Financial Freedom
Bitcoin was supposed to empower individuals, but in practice, it has become a playground for the wealthy.
Decentralization in theory ≠ decentralization in reality.
Institutional investors and exchanges hold a massive portion of BTC.
Bitcoin’s fixed supply (21 million BTC) makes redistribution nearly impossible.
Bitcoin is not the democratized financial system it was promised to be—it’s just another asset class where the rich get richer.
NASDAQ:MSTR NYSE:CRCL NASDAQ:COIN TVC:GOLD TVC:SILVER INDEX:BTCUSD NASDAQ:TSLA TVC:DXY NASDAQ:HOOD NASDAQ:MARA

USDT.D Breakout Fading — Relief Rally Ahead for Crypto?Yesterday’s spike in USDT.D during the volatility shook the market hard — but look closer 👀
This breakout above the range could be a seller’s trap. We saw a breakout attempt with strong wicks and rejection right after, hinting that buyers might regain control soon.
The false breakdown earlier and quick reclaim of the range further supports this bias.
If USDT.D starts falling again, it could fuel a recovery in risk assets (BTC + alts). For now — watching for confirmation, but cautioning against chasing fear here.
Stay sharp
