29.01.26 Daily ForecastPairs on Watch -
FX:EURCAD
A short overview of the instruments I am looking at for today, multi-timeframe analysis down to what I will be looking at for an entry. Enjoy!
Trade

28.01.26 Daily ForecastPairs on Watch -
FX:CADJPY
TVC:USOIL
A short overview of the instruments I am looking at for today, multi-timeframe analysis down to what I will be looking at for an entry. Enjoy!

Gold Short Trade - IntradayThis intraday trade should be quick and short, as soon as Bulls starts to give up.
1. Price reached the orange CL
2. Price left the L-MLH
3. Pullback to L-MLH expected and fullfilled.
4. Price weakens after Test/Retest of L-MLH
Short with no doubt, just following the rules.
Subscribe for my Newsletter §8-)

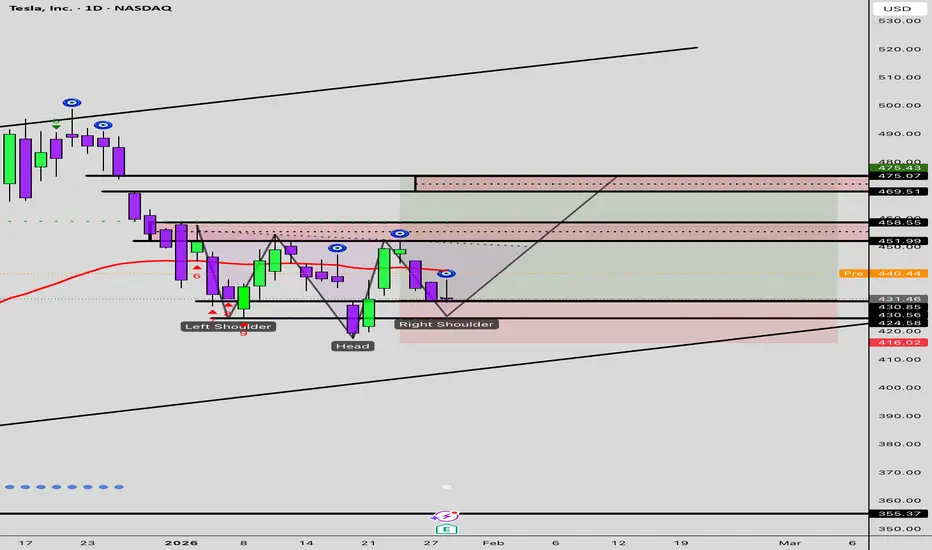
TSLA (Tesla) Long Set Up Entry Price 1: $432.00
Entry Price 2: $424.00
Stop Loss: $414.00
Take Profit 1: $442.00 (Close 25%)
Take Profit 2: $452.00 (Close 50%)
Take Profit 3: $462.00 (Close 75%)
Take Profit 4: $475.00 (Close 100%)
NQ: Stalking the 4H SupplyThe Macro Context
We are currently pushing into a significant 4-hour Supply Block. After the recent impulsive moves, the market is approaching a zone where institutional sell orders have historically lived. As a "sponge" to these lessons, I’m not interested in guessing the top—I’m waiting for the market to reveal its hand.
The Execution Plan
I am stalking a short entry with two specific "Hermit" requirements:
The Liquidity Hunt: Ideally, I want to see a wick above the high of this 4H supply zone to sweep out the early shorts.
Price Acceptance: I need to see a 4-hour candle close firmly inside or below the box after that wick. If we get a full candle close above this zone, the trade idea is invalidated and the "Macro Roadmap" gets a rewrite.
The Trigger
Once the 4H rejection is confirmed, I’m dropping down to the 15-minute timeframe to look for a Market Structure Shift to the downside.
No Shift = No Trade. * Patience is a position. We wait for the "handoff" from buyers to sellers to be documented on the tape.

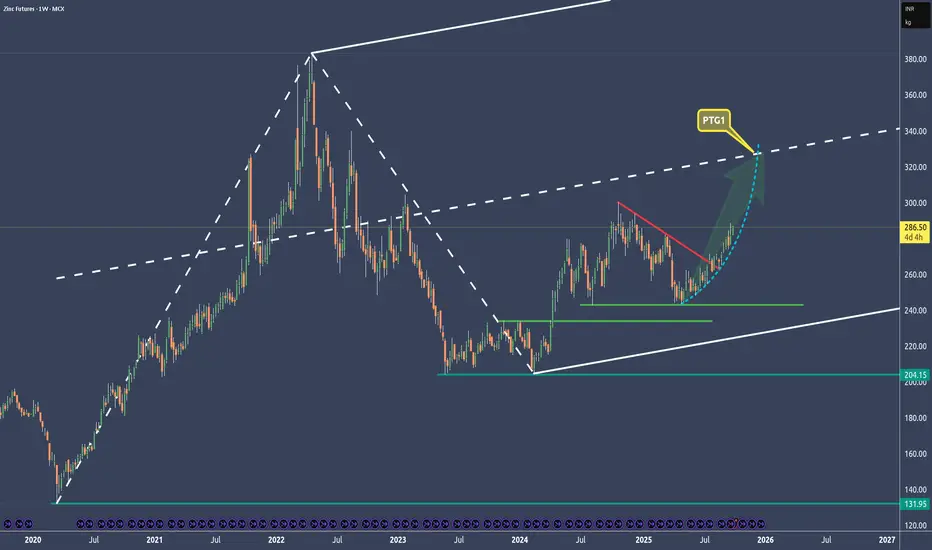
Zinc - Exponential Move To Profit Along With Copper🔱 I posted about copper and zinc on Sep 17. 🔱
Both are closely correlated, and now zinc is moving exponentially.
The target is at the centerline of course with around an 80% probability.
👉 If you think that these forks are doing a good job, then throw me booster please and check out my links. §8-)
GBPUSD Swing Trade In ProgressHi Traders!
Three days ago I wrote a mind about swinging GU. As I do my top down analysis, here is my trade plan...
Based off of the weekly, GU looked to me that it is in a retracement phase giving a low at 1.30200 then progressing to the upside. With the 3 small candles printed from Monday Dec. 29th to January 12th, GU has then been in progress to make a new bullish engulfing candle (Closing in 1 day).
Moving down to the daily, within the 3 weekly candles, price seemed to be in another retracement dipping into the 50% zone at 1.33500 from the high of around 1.35700. If the 1.33500 higher low is true, then I am looking for price to continue to fill in the weekly wicks.
Furthermore, as I began to look for my entry moving down to the 2HR TF, price came down to a 2HR CHOCH zone bouncing off 1.34000. With no close below and continuation, this gave me the opportunity to fill my order around 1.34500.
My swing targets are 1.35500, and potentially into 1.36000. Based off of my TP targets, I'm looking for price to continue to fill in weekly wicks. Depending on how price reacts to 1.35500/Resistance and if price can stay above 1.35500 with signs of continuation, then I'd consider holding longer.
However, with everything said, I am still taking into consideration that price is in a failed swing, and anything below 1.34000 would invalidate my swing plan.
Entry: 1.34500
TP 1: 1.35500/1.35600
SL: 1.34000
~1:2 RR
*DISCLAIMER: I am not a financial advisor. The ideas and trades I take on my page are for educational and entertainment purposes only. I'm just showing you guys how I trade. Remember, trading of any kind involves risk. Your investments are solely your responsibility and not mine.*

EUR/CAD | Bullish Breakout & Momentum Continuation Setup💶🍁 EUR/CAD "EURO vs CANADIAN DOLLAR" Premium Forex Trading Strategy 🔥
🎯 Day Trading & Swing Trading Opportunity Guide (Jan 2026 - Live Market Data)
📊 CURRENT LIVE MARKET DATA 📈
Current Price: 1.6134 USD/CAD (+0.29%) ⬆️
52-Week High: 1.6466 | 52-Week Low**: 1.4688
Weekly Range: 1.61464 - 1.62974 (As of Jan 26, 2026)
Volatility Rating: 0.23% (Lower volatility = Cleaner moves!) ✅
Market Sentiment: STRONG BUY (Technical Rating) 💪
🚀 BULLISH TRADING PLAN 🚀
📍 ENTRY POINT - Your Green Light to GO! 🟢
Entry Zone: After Resistance Breakout @ 1.63200 CAD
This level acts as a strong psychological barrier
Confirmation = Candle close above 1.6320
Wait for pullback + continuation pattern for safer entry
Risk/Reward Setup = OPTIMAL ✨
🎯 PRIMARY TARGET (Conservative) 🎯
Target Level 1: 1.63700 CAD
Why: Police barricade resistance + overbought conditions detected
Caution: Watch for profit-taking & potential correction trap ⚠️
Action: Consider taking 50% profit here, move SL to breakeven
Reward: +50 pips per lot (Clean & Quick)
🔥 EXTENDED TARGET (Aggressive) 🔥
Target Level 2: 1.64200 - 1.64500 CAD
Requires sustained bullish momentum
Technical resistance weakening
Only chase if daily candle structure confirms
Excellent for swing traders (2-3 day holds)
🛑 STOP LOSS - Protect Your Capital! 🛡️
SL Placement: 1.62700 CAD
Placed below support confirmation level
Provides 50-pips breathing room for volatility
Risk Management = PRIORITY #1
Max Risk: Keep to 1% of your trading capital per trade
📰 FUNDAMENTAL FACTORS TO WATCH 🔔 (Real Data - Jan 2026)
🏦 EUROPEAN CENTRAL BANK (ECB) STANCE 🇪🇺
Current Rate Status:
Main Refinancing Rate: 2.15% ✅ (Unchanged since July 2025)
Deposit Facility Rate: 2.00% ✅
ECB Holding Pattern: Data-Dependent Approach
Key ECB Fundamentals:
Inflation Projection 2026: 1.9% (Below 2% target) 📉
Economic Growth 2026: 1.2% (Slower than 2025's 1.4%)
Services Inflation: Sticky at 3.8-3.9% YoY ⚠️
Wage Growth: Expected to stabilize below 3% by end-2026
ECB Outlook: "Good place" = No hurry for rate changes (Dec 2025)
Impact on EUR:
EUR strength supported by stable rates
No rate cuts expected in 2026 = Euro floor protection 🏛️
Strong euro could dampen inflation further
Market odds of hike by end-2026 = Only ~30%
🍁 BANK OF CANADA (BoC) POSITION 🇨🇦
Current Rate Status:
Overnight Rate Target: 2.25% (Paused cutting cycle)
Rate Decision Upcoming: January 28, 2026 🗓️
Key BoC Fundamentals:
Rate Trajectory 2026: HOLD expected all year (75% economist consensus)
Economic Growth: 1.2-1.8% expected (Gradual pickup from 1.7% in 2025)
Inflation: Hovering at 2.0% target (Well-controlled) ✅
Labour Market: Mixed signals - Job gains in Dec but employment stalling
Unemployment Rate: 6.5% (Lower end, but caution warranted)
Major Risk Factor: USMCA Trade Review (July 2026) ⚡ = BIGGEST HEADWIND
Impact on CAD:
Weaker bias due to trade uncertainty 📍
Rate pause = CAD limited upside potential
Tariff uncertainty = CAD defensive positioning
Cut odds if economy falters = CAD depreciation signal
💰 CORRELATED PAIRS TO MONITOR 📊
Pair 1: OANDA:USDCAD 🔗
Inverse Relationship: When USD/CAD rises = EUR/CAD often falls
Current Level: ~1.38 (CAD weakness = EUR/CAD support)
Watch: If USD/CAD breaks 1.3900 = EUR/CAD bullish acceleration 🚀
Pair 2: FX:EURUSD 🔗
Direct Correlation: Strong positive = EUR/CAD strength linked
Current Level: ~1.1605
Watch: If EUR/USD rallies above 1.165 = EUR/CAD leg higher
Key Level: ECB vs Fed rate differential matters!
Pair 3: OANDA:GBPCAD 🔗
Alternative Long: Currently 1.8643 (+0.90%)
Stronger CAD Weakness Signal: If GBP/CAD rallies hard
Correlation Check: Use as confirmation for EUR/CAD direction
Pair 4: OANDA:CADJPY 🔗
Risk Sentiment Indicator: Japanese Yen strength = Risk-off
Trade Flows: Watch commodity-related USD/JPY moves
Alert Signal: If JPY strengthens = EM currencies weaken including CAD
📌 ECONOMIC CALENDAR - KEY DATES TO WATCH 🗓️
THIS WEEK - CRITICAL! 🔴
Jan 28, 2026 (TOMORROW!): Bank of Canada Rate Decision @ 2:45 PM ET
Expected: Hold at 2.25% ✅ (90% market odds)
Watch: Forward guidance on rate path
Volatility: HIGH - EUR/CAD could swing 30-50 pips
UPCOMING WEEK
Feb 5, 2026: ECB Governing Council (No rate change expected)
Fed Meeting: Monitor US economic data weekly
Canadian Employment Report: Watch hiring trends
MONTHLY RELEASES
Eurozone CPI Inflation: Watch services component (sticky!)
Canadian GDP Data: Q4 2025 results key for growth outlook
Both Central Banks: Wage pressure monitoring = inflation sticky risk
🎓 TRADING NOTES & RISK DISCLAIMERS ⚠️
❌ IMPORTANT RISKS
THIS IS NOT INVESTMENT ADVICE - Trade at your own risk!
Leverage Risk: Forex amplifies gains AND losses
Political Risk: USMCA renegotiation = Major CAD wild card
Central Bank Surprise: Never assume - market moves on unexpected data
Geopolitical: Energy market volatility (Venezuela situation) = Oil/CAD impact
Bank of Canada Jan 28: Rate decision could trigger 50+ pip moves
✅ PRO TRADER RULES
Position Sizing: Risk only 1% of account per trade (non-negotiable!)
Stop Loss: ALWAYS use SL - no exceptions for "Thief OGs"
Take Profits: Bank your gains at targets - Don't be greedy
Confirmation: Wait for candle close above 1.63200 before entry
Journal Everything: Track wins/losses for continuous improvement
🌟 FINAL CHECKLIST BEFORE TRADING ✅
Price above 1.6320? (Breakout confirmed)
Stop loss ready at 1.6270? (Risk defined)
Position size = 1% risk? (Capital protected)
BoC & ECB data checked? (Fundamentals aligned)
EUR/USD & USD/CAD correlated? (Multi-pair confirmation)
Chart pattern supports entry? (Technical + Fundamental match)
Trading plan written down? (Emotions controlled)
📊 SUMMARY SCORECARD
🔵 Technical Setup: 8/10 ✅ Bullish
🔵 Fundamental Support: 7/10 ✅ EUR Stable / CAD Weak
🔵 Risk/Reward Ratio: 9/10 ✅ Excellent (1:1.5)
🔵 Market Volatility: 6/10 ⚠️ Moderate
🔵 Trade Timing: 8/10 ✅ Early Setup Phase
🟢 OVERALL OPPORTUNITY: 8/10 🟢 BUY SETUP READY
🚀 THIS IS YOUR TRADE ZONE - STAY DISCIPLINED & STAY PROFITABLE! 🚀
Remember: Great traders aren't measured by their biggest win. They're measured by consistency, discipline, and how well they manage risk. Build your legacy one disciplined trade at a time.
Let's GET THIS MONEY! 💰💪
-Thief Trader (The Professional Forex Blueprint)

27.01.26 Daily ForecastPairs on Watch -
FX:GBPJPY
FX:GBPNZD
FX:EURNZD
A short overview of the instruments I am looking at for today, multi-timeframe analysis down to what I will be looking at for an entry. Enjoy!

XAUUSDToday, gold prices rose to a new all-time high of $5111. From a technical perspective, the price is currently in an "overbought" condition, which may lead to a short-term correction. Consider selling in the red zone.
🔥Trading futures, forex, CFDs and stocks carries a risk of loss.
Please consider carefully whether such trading is suitable for you.
This content is not financial advice. Always conduct your own financial due diligence.
>>GooD Luck 😊
❤️ Like and subscribe to never miss a new idea!

Bitcoin lost it's support completelyOh my…
Here we are again: opening and closing below the centerline. The CIB line is broken as well.
This is now the second time Bitcoin has lost the centerline support. Before that happened, it gave us a Hagopian - a large one.
I stand by my target of 60K, unless a miracle comes down from crypto heaven.
Happy new trading week y'all.

26.01.26 Daily ForecastPairs on Watch -
OANDA:SOYBNUSD
FX:NZDCAD
FX:GBPNZD
A short overview of the instruments I am looking at for today, multi-timeframe analysis down to what I will be looking at for an entry. Enjoy!

Geopolitical Risk Alert: US-China, Middle East, Russia-Ukraine1. US-China Tensions
Background
The US-China geopolitical rivalry is rooted in economic, military, technological, and ideological competition. Over the past decade, China’s rapid economic growth, expanding technological capabilities, and assertive foreign policy have challenged US global primacy. Key flashpoints include trade disputes, technology competition (particularly in semiconductors and AI), Taiwan, and South China Sea territorial claims.
Key Risks
Trade and Economic Sanctions: Tariffs and restrictions on key technologies, such as AI chips and 5G infrastructure, disrupt global supply chains. Companies with exposure to both markets face operational and financial uncertainty.
Military Tensions: The Taiwan Strait remains a potential flashpoint. Any escalation, including military maneuvers or blockades, could trigger regional instability and a global market shock.
Financial Market Volatility: Chinese regulatory crackdowns and US restrictions on investment in Chinese tech firms create uncertainty in equity, bond, and currency markets. Investor sentiment is highly sensitive to developments in US-China relations.
Technological Decoupling: Both nations are pursuing “decoupling” in strategic sectors, leading to bifurcated technology ecosystems. Companies in semiconductors, AI, and critical infrastructure face increased compliance, supply chain, and cybersecurity risks.
Global Implications
US-China tensions could slow global economic growth, disrupt trade, and accelerate the reorientation of global supply chains. Countries reliant on both markets face a delicate balancing act, and geopolitical risk premiums are increasing in global markets.
2. Middle East Instability
Background
The Middle East remains one of the most geopolitically volatile regions due to historical conflicts, sectarian divides, competition over resources, and strategic rivalries among regional powers. Key areas of concern include Iran, Syria, Yemen, Israel-Palestine, and the Gulf Cooperation Council (GCC) states.
Key Risks
Energy Market Volatility: The region holds a disproportionate share of global oil and gas reserves. Any conflict or disruption in production and shipping lanes (e.g., Strait of Hormuz) can cause sharp spikes in energy prices, impacting global inflation and economic growth.
Military Escalation: Iran’s regional activities, proxy conflicts, and potential nuclear developments increase the risk of direct confrontation with the US or Israel. Military escalations could have a rapid impact on regional stability.
Terrorism and Insurgent Activity: Groups like ISIS and Al-Qaeda remain capable of destabilizing governments and disrupting infrastructure, affecting both local and global operations.
Political Instability: Domestic unrest in countries like Lebanon, Iraq, and Iran can spill over into regional conflicts, creating humanitarian crises and affecting trade corridors.
Global Implications
The Middle East’s instability continues to influence global energy prices, international shipping, and migration flows. Investors often treat geopolitical developments in this region as a key risk factor, leading to fluctuations in commodity markets, insurance costs, and foreign direct investment decisions.
3. Russia-Ukraine Conflict
Background
Since February 2022, Russia’s invasion of Ukraine has created one of the largest geopolitical crises in Europe in decades. The conflict has caused significant military, economic, and humanitarian consequences, with global ramifications across energy, agriculture, defense, and financial markets.
Key Risks
Energy Security: Russia is a major global exporter of oil and natural gas. Sanctions, supply disruptions, and EU dependence on Russian energy have driven energy prices higher and forced countries to seek alternative suppliers.
Food Security: Ukraine is a critical exporter of wheat, corn, and sunflower oil. The war has disrupted agricultural production and global food supply chains, exacerbating inflation and food insecurity in vulnerable regions.
Military Escalation: Prolonged fighting and potential use of unconventional weapons create the risk of a broader regional or global escalation. NATO and Western support for Ukraine remain pivotal in shaping the conflict trajectory.
Sanctions and Economic Impact: Western sanctions on Russia have restricted capital flows, trade, and access to technology. The sanctions regime, in turn, has led Russia to strengthen alliances with countries like China, India, and Iran, reshaping global geopolitical alignments.
Market and Investor Sentiment: Financial markets are highly sensitive to developments on the battlefield. Sudden escalations or peace talks can drive extreme volatility in equities, commodities, and currencies.
Global Implications
The conflict has reshaped energy markets, accelerated the push for renewable energy in Europe, and highlighted vulnerabilities in global food and commodity supply chains. Investor caution remains high, with geopolitical risk premiums factored into equity valuations and sovereign bonds.
4. Cross-Cutting Risks
Across all three regions, certain risk factors are interconnected:
Supply Chain Disruptions: Geopolitical tensions, sanctions, and conflicts impact global supply chains, affecting semiconductors, energy, agricultural products, and strategic materials.
Inflationary Pressures: Energy and commodity volatility contribute to global inflation, influencing central bank policies and interest rates.
Investor Uncertainty: Heightened geopolitical tensions increase market volatility and risk aversion, prompting shifts toward safe-haven assets such as gold, US Treasuries, and the Swiss franc.
Geopolitical Alliances and Shifts: Countries are increasingly forming strategic partnerships or diversifying alliances to mitigate risk, creating a multipolar world order. For example, Russia-China alignment, US-Gulf cooperation, and NATO support for Ukraine reflect changing global power dynamics.
Cybersecurity Threats: Conflicts and tensions increase the likelihood of state-sponsored cyberattacks targeting infrastructure, financial systems, and corporate networks.
5. Strategic Considerations for Investors and Governments
Given these geopolitical risk alerts, stakeholders should adopt proactive strategies:
Diversification: Spread investments across multiple regions and asset classes to reduce exposure to localized geopolitical risks.
Monitoring and Intelligence: Maintain real-time monitoring of geopolitical developments, sanctions, and policy shifts.
Supply Chain Resilience: Diversify suppliers and logistics networks, particularly for critical raw materials and energy.
Hedging Strategies: Use financial instruments like options, futures, and commodities to hedge against volatility in energy and currency markets.
Policy Preparedness: Governments must plan for potential humanitarian crises, energy shortages, and trade disruptions. Strategic reserves of energy and food can mitigate risks.
Conclusion
Geopolitical risks from US-China tensions, Middle East instability, and the Russia-Ukraine conflict represent a significant threat to global stability. Their implications extend beyond localized conflicts, affecting energy prices, trade, investment flows, and global economic growth. The interconnected nature of modern markets means that these risks are amplified: disruptions in one region can cascade into global financial, supply chain, and security challenges.
For investors, policymakers, and businesses, vigilance, adaptability, and strategic foresight are essential. Monitoring geopolitical developments, hedging risks, and building operational resilience can help mitigate the adverse impact of these complex and evolving threats. In a world where political, economic, and military risks intersect, proactive risk management is not just prudent—it is essential.

Why Forex Reserves Matter1. Foundation of Currency Stability
One of the most important reasons forex reserves matter is their role in maintaining currency stability. Exchange rates are influenced by supply and demand in the foreign exchange market. During periods of stress—such as capital outflows, geopolitical tensions, or global financial shocks—a country’s currency may come under severe depreciation pressure.
Forex reserves allow the central bank to intervene in currency markets by selling foreign currency (usually US dollars) and buying the domestic currency. This intervention helps smooth excessive volatility, prevent panic-driven depreciation, and maintain orderly market conditions. Without sufficient reserves, a country becomes vulnerable to speculative attacks and sharp currency crashes, which can quickly spill over into inflation and financial instability.
2. Shield Against External Shocks
Global economies are interconnected. External shocks such as oil price spikes, global recessions, sudden stops in capital flows, or financial crises can severely impact a country’s balance of payments. Forex reserves act as a financial buffer during such times.
When export revenues decline or foreign capital dries up, reserves help meet external payment obligations like imports, debt servicing, and foreign liabilities. Countries with healthy reserves can absorb shocks more effectively, avoiding abrupt policy measures such as import restrictions, capital controls, or emergency borrowing at unfavorable terms.
3. Ensuring Smooth International Trade
International trade relies heavily on stable access to foreign currencies. Countries need forex to pay for imports such as crude oil, machinery, technology, medicines, and essential commodities. Adequate forex reserves ensure that a nation can continue importing critical goods even if export earnings temporarily fall.
This is particularly important for import-dependent economies. If reserves are low, even short-term disruptions can lead to shortages, rising prices, and economic stress. Strong reserves, on the other hand, reassure global suppliers and trading partners that payments will be honored on time, strengthening trade relationships.
4. Boosting Investor Confidence
Forex reserves are closely watched by foreign investors, rating agencies, and international financial institutions. High and stable reserves signal economic strength, prudent macroeconomic management, and financial discipline.
When investors see that a country has ample reserves, they feel more confident investing in its equity markets, bonds, and infrastructure projects. This confidence reduces the country’s risk premium, lowers borrowing costs, and attracts long-term capital inflows. Conversely, declining or critically low reserves often raise red flags, triggering capital flight and currency depreciation.
5. Supporting Monetary and Fiscal Policy
Forex reserves enhance the effectiveness of monetary policy. Central banks use reserves to manage liquidity, control inflationary pressures arising from currency depreciation, and stabilize interest rates during volatile periods.
In addition, reserves provide flexibility to the government during fiscal stress. While reserves are not meant to fund regular government spending, their presence allows policymakers more room to maneuver during crises—such as pandemics or financial meltdowns—without immediately resorting to external bailouts or austerity measures.
6. Meeting External Debt Obligations
Many countries borrow in foreign currencies. Servicing this external debt—interest and principal repayments—requires reliable access to forex. Reserves ensure that debt obligations can be met even if market access becomes constrained or refinancing becomes expensive.
Countries with weak reserves may face higher default risks, currency mismatches, and rising debt servicing costs. In contrast, strong reserves lower sovereign risk and improve credit ratings, which further reduces borrowing costs in international markets.
7. Crisis Prevention and Crisis Management
History provides many examples where inadequate forex reserves triggered or worsened economic crises. Currency crises in Asia (1997), Latin America, and other emerging markets were often linked to weak reserves relative to short-term external liabilities.
Adequate reserves serve as insurance. They deter speculative attacks because markets know the central bank has enough firepower to defend the currency. Even if reserves are not fully used, their presence alone can prevent crises by anchoring expectations and calming markets.
8. Enhancing Global Standing and Negotiating Power
Forex reserves also influence a country’s global economic standing. Nations with large reserves have greater influence in international forums, stronger bargaining power in trade negotiations, and more credibility in global financial discussions.
They are also better positioned to support regional stability, extend swap lines, or assist neighboring economies during crises. This enhances geopolitical and economic influence beyond domestic borders.
9. Indicator of Economic Health
Forex reserves are a key macroeconomic indicator. Analysts track metrics such as import cover (how many months of imports reserves can pay for), reserves-to-GDP ratio, and reserves relative to short-term external debt. These indicators help assess a country’s vulnerability to external risks.
While extremely high reserves may raise questions about opportunity costs, insufficient reserves are almost universally viewed as a serious economic weakness.
10. Balancing Costs and Benefits
It is important to note that holding forex reserves is not cost-free. Reserves are usually invested in low-risk, low-return assets like US Treasury bonds. This means there is an opportunity cost compared to investing in domestic infrastructure or social development.
However, most economists agree that the benefits of adequate reserves—stability, confidence, and resilience—far outweigh the costs, especially in a volatile global financial environment.
Conclusion
Forex reserves matter because they sit at the crossroads of stability, confidence, and sovereignty in the global financial system. They protect a country from external shocks, stabilize the currency, support trade, reassure investors, and strengthen policy effectiveness. In an era marked by rapid capital flows, geopolitical uncertainty, and frequent economic disruptions, strong forex reserves are not a luxury—they are a necessity.
For policymakers, investors, traders, and citizens alike, understanding the importance of forex reserves provides deeper insight into a nation’s economic strength and its ability to navigate uncertainty with confidence.

TheGrove | USDCAD buy | Idea Trading AnalysisUSD/CAD is trading within a Ascending pattern, with price holding above the ascending support line after a clear bullish and is moving on support line and after going up. Price is trading inside a bullish ascending channel after a strong break of structure.
We expect a decline in the channel after testing the current level
Hello Traders, here is the full analysis.
I think we can soon see more fall from this range! GOOD LUCK! Great buy opportunity USDCAD
I still did my best and this is the most likely count for me at the moment.
-------------------
Traders, if you liked this idea or if you have your own opinion about it, write in the comments. I will be glad ⚜️

23.01.26 Daily ForecastPairs on Watch -
FX:EURUSD
FX:GBPUSD
FX:GBPCAD
A short overview of the instruments I am looking at for today, multi-timeframe analysis down to what I will be looking at for an entry. Enjoy!

EURUSD Timeframe Conflict: Which direction is in play?Hi Traders!
EURUSD is trading at a higher-timeframe resistance near 1.18000. While monthly structure remains bullish, and may resemble a bullish flag, continuation has not yet been confirmed.
On the weekly timeframe, price seems to be in a range beneath resistance. Momentum has clearly slowed which puts price in consolidation rather than immediate continuation.
However, as I move down to the daily timeframe, the story may be different. With price failing to swing higher than 1.18000, a new bearish daily CHOCH has formed with a new higher low. If the daily bearish CHOCH is true, I'm looking for price to reach around that area for a retest, and possibly continuing a deeper pullback before any higher-timeframe attempt.
In addition, with DXY taken into consideration, it looks to me that price is attempting to make a double bottom on the weekly without a clear close below 97.500. This to me can seem like price may take another attempt at 100.000. Therefore, if the daily bullish CHOCH that was created is true, I am looking for a retest around 98.850 with signs of continuation.
A swing trade on EURUSD could be in play if my confirmations align. But for now, alerts are set near the bearish daily CHOCH, and DXY's bullish CHOCH.
If you've read this far, thank you! Leave a comment on what you think is possible!
*DISCLAIMER: I am not a financial advisor. The ideas and trades I take on my page are for educational and entertainment purposes only. I'm just showing you guys how I trade. Remember, trading of any kind involves risk. Your investments are solely your responsibility and not mine.*

Gold price analysis, January 22ndGold (XAUUSD) on the H1 timeframe maintains a strong uptrend. The price is trading above the 34-89 EMA, with the EMAs stacked in ascending order, indicating that bullish momentum remains dominant. The current dip is seen as a technical correction after the price reached its historical peak around 4,889. With this correction, Gold will soon regain its upward momentum without reversing to a downtrend.
Currently, the price is consolidating above a key support zone. There is no signal of a breakout from the uptrend structure (no lower low has been created). This suggests that the main trend has not been broken; the market is in a "pause" phase before continuing.
BUY GOLD 4722-4720 Stoploss 4716
BUY GOLD 4765-4763 Stoploss 4759
SELL GOLD 4820-4822 Stoploss 4826
SELL GOLD 4850-4852 Stoploss 4856

22.01.26 Daily ForecastPairs on Watch -
FX:AUDNZD
FX:CADJPY
FX:GBPJPY
A short overview of the instruments I am looking at for today, multi-timeframe analysis down to what I will be looking at for an entry. Enjoy!

USDCHFUSDCHF price is near the support zone of 0.79110-0.78785. If the price fails to break through 0.78785, we expect a potential rebound.

21.01.26 Daily ForecastPairs on Watch -
FX:NZDJPY
FX:EURUSD
A short overview of the instruments I am looking at for today, multi-timeframe analysis down to what I will be looking at for an entry. Enjoy!

You don’t wanna know where I think BTC will be by Xmas
The Current Tactical Setup: We are currently sitting in a 3-hour Bullish Order Block (OB). This zone is significant because it produced the local impulse that broke structure to the upside.
The Goal: I’m looking for a countertrend long to play the rebalance into the overhead supply.
Target 1: The local 3hr Supply.
Target 2 (The Trap): The 12-hour Supply Zone sitting between $100k - $104k.
Execution Status: HANDS OFF I don’t "love" this area enough to blind-enter. I am currently parked in the 3hr block, but I am waiting for Lower Timeframe Market Structure to show its hand.
Scenario A: A 15m/45m Shift in Character → I enter Long for the $100k+ move.
Scenario B: No trigger, structure fails → I remain flat and wait for the $89k daily floor.
The Macro Pivot: If we hit that $100k-$104k zone and the 12hr supply holds, I am switching to my macro bearish thesis. The weekly structure is broken, and I believe that supply zone is the "Point of Origin" for a slide down to $30k by Christmas.
I have no one to talk to about this in my immediate circle, so I'm documenting it here for accountability.
NFA | DYOR

Long Idea ON $MNTWe are currently in a downtrend from $2.87. This rise is therefore a correction within the overall falling trend. According to wave analysis, the potential target is $1.80, which gives a risk/reward ratio of approximately 1:2.5 or higher (depending on where you set your stop-loss). The setup remains valid until the high around $2.87 is updated.
Remember to manage your risks.
