GOLD → Rates have been cut. Will growth continue?FX:XAUUSD , following the Fed's decision on interest rates, caused a shock, updating the ATH to 3707, then updating the minimum to 3633. Since the opening of the European session, the market has been recovering, but there is a BUT...
The Fed's Dot Plot confirmed the forecast of two additional rate cuts before the end of the year, which provides long-term support for gold.
The USD remains under pressure after the Fed's decision, despite a short-term rebound. Trump's statements and the escalation of conflicts continue to fuel demand for safe havens.
After rising to a record high of $3707, a short-term correction is possible. If today's jobless claims come in better than expected, it will temporarily strengthen the USD. As for Powell, his emphasis on “meeting-to-meeting decisions” may limit appetite for risky assets.
Resistance levels: 3674.7, 3688.6
Support levels: 3654.5, 3633, 3626.8
Technically, since the opening of the European session, gold has spent its intraday ATR reserve. From the specified resistance level of 3675 (psychological level), a correction to 3660-3655 may form before continuing to grow to 3675-3688.
Best regards, R. Linda!
Trend Line Break

SOLUSDT → Correction amid a strong bullish trend BINANCE:SOLUSDT , after updating its next high, formed a false breakout of local resistance and returned to the trading range as part of a correction. What to expect from altcoin?
The main driver of the crypto market, Bitcoin, is consolidating above 115K and facing fairly strong resistance at 117400. Earlier, the price completed a downward correction. The market is dominated by a positive technical and fundamental background.
SOL looks stronger than Bitcoin and is testing new highs...
The price of SOLANA is forming a false breakout of resistance and is entering a correction phase amid a bullish trend. As part of the correction, the price may test the local imbalance zone and the key liquidity level of 242.5.
Resistance levels: 244, 249.2, 253.5
Support levels: 242.5, 239, 231.5
Technically, the price may form a false breakdown of the nearest zone of interest at 242.5, and if the bulls manage to keep the price above the resistance zone of 242.5-244.0 after this maneuver, the coin may return to an upward movement. However, if this does not happen, I would wait for a retest of the 239.0 zone, where the trend support line is located. The medium- and long-term outlook for SOL is positive, and the price is highly likely to test the ATH 295.0.
Best regards, R. Linda!

GOLD → Retest of resistance at 3660. What could happen?FX:XAUUSD is testing resistance to correction after breaking the local market structure from bearish to bullish. A breakout of 3660 could give buyers a chance...
A 25 bp rate cut to 4.25% was expected, but the forecast for further cuts came as a surprise: now two cuts before the end of 2025 (instead of one) and one in 2026.
The reason for the shift: fears of a slowdown in the labor market outweighed the risks from inflation (2.9% in August).
The dollar continues its countertrend correction (rebound) after Powell's speech and economic news. This temporary phenomenon may soon end. Gold, after a manipulative phase, may return to an upward movement if the price breaks 3660 and consolidates above this level.
The Fed preferred to support employment, risking accelerating inflation. In the long term, this will support risk assets and commodities, but in the short term, the markets have taken a pause.
Resistance levels: 3360, 3675, 3688
Support levels: 3643, 3631
Gold is not updating local lows, a cascade bottom is forming and the local bearish structure is breaking down. If the market manages to overcome the resistance of the correction, a bullish impulse may form!
Best regards, R. Linda!

ENA - BEARISH SETUP MIL:ENA charts looks bad, I think that a bearish move is loading 📉
Lower key demand zone:
0.6730 - 0.640 - 0.600 - 0.550$
I remain bullish above 0.500$ (long term).

USDCAD – Medium-Term H1 OutlookUSDCAD – Medium-Term H1 Outlook
USDCAD is maintaining a steady corrective uptrend, supported by sustained strength in the US Dollar. This broader USD momentum continues to benefit the pair in the medium term.
The recently filled gap has led to a minor pullback, but this reaction creates an attractive opportunity for long positions at current levels. From a structural perspective, the Point of Control (POC) on the Volume Profile aligns well with a liquidity-driven retracement zone, reinforcing this as a favourable entry for trend-following trades.
Trading Plan (H1)
Buy Entry: 1.3760 – 1.3770
Stop Loss: 1.3730
Take Profit: 1.3795 – 1.3820 – 1.3850 – 1.3875
I will continue to monitor the market and share updates as price action unfolds. Wishing you successful trades with this scenario.

HINO📊 HINO (PSX) Analysis (One can also buy on current market price)
🔎 Fundamentals
🚌 Buses & Trucks: Orders surged 80% 🚀
💰 Undervalued Price → Attractive entry point for long-term investors
📈 Earnings Growth: EPS improved to 4.67 ✅
🤝 MFTBC (Mitsubishi Fuso Truck & Bus Corp.) agreement with HINO → backed by a 100% publicly listed global player 🌍
📉 Technicals
📍 3 Accumulation Areas → Strong buying interest spotted
📊 Trendline Break (Daily) → Closed at 562 → ✅ Buy Signal
🔄 Support Bounce: Price moves in the 562–582 range → Ideal Buy Zone
⚡ If Support Breaks: Next attractive Buy Zone → 360–390
Note: (One can also buy on current market price)

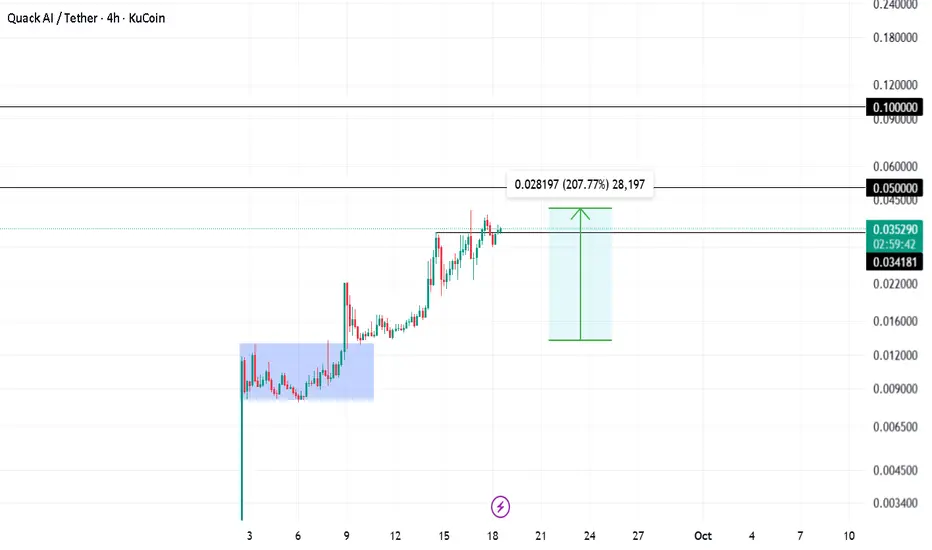
Q Pumped 207% Shared insights on Q trade a while ago. Been holding the trade for a while now and made easy 2x till now.
Hodling for 0.05 and 0.1 targets
Stop loss trailed!
LiamTrading – XAUUSD: A New Trend Taking ShapeGold has entered a new phase, beginning a sharp correction following Chairman Powell’s announcement of a Fed rate cut. On the H1 chart, a bearish Dow structure is clearly forming, suggesting the potential for sustained downside in the medium term.
Most buy-side liquidity has now been cleared, leaving limited scope for a strong recovery – aside from a brief FVG that appeared immediately after the news. Market sentiment indicates that activity during that phase carried little weight. The appearance of a gap highlights growing confidence among sellers in seizing control after the Fed’s statement.
This decline could drive gold towards the 363x area, and potentially extend to the 361x region. A critical level to watch remains 3651, a strong support where price previously rebounded by more than 20 dollars immediately after the announcement.
Trading plan for today:
Sell 3656 – 3659, SL 3666, TP 3651 – 3646 – 3638 – 3634 – 3626 – 3615
Buy 3634 – 3632, SL 3628, TP 3640 – 3652 – 3660
Buy zone 3607 – 3604, SL 3600, TP 3616 – 3625 – 3638 – 3647 – 3660
This is my personal view on XAUUSD for today. Please use it as a reference for your own trading. If you find it useful, follow me for further updates and gold market scenarios.

ANFIBO – GBPUSD Current H1 TrendI’d like to share my perspective on GBPUSD.
The uptrend on GBPUSD is well-structured, which is not surprising given that this pair often moves in line with gold for much of the time. The trendline shows a clear and sustainable upward direction.
Price has recently reacted at the dynamic resistance around the 1.618 Fibonacci extension. This should be considered only as a minor correction before the main bullish trend continues.
Trading Scenarios – Buy Continuation
Buy Setup 1
Entry: 1.3610 – 1.3600
Stop Loss: 1.3590
Take Profit: 1.3635 – 1.3665 – 1.3680 – 1.3740 – 1.3760
Buy Setup 2
Entry: 1.3580 – 1.3570
Stop Loss: 1.3550
Take Profit: 1.3595 – 1.3615 – 1.3630 – 1.3680 – 1.3740 – 1.3760
Stay tuned for my next updates to catch new trading signals as soon as market conditions shift.

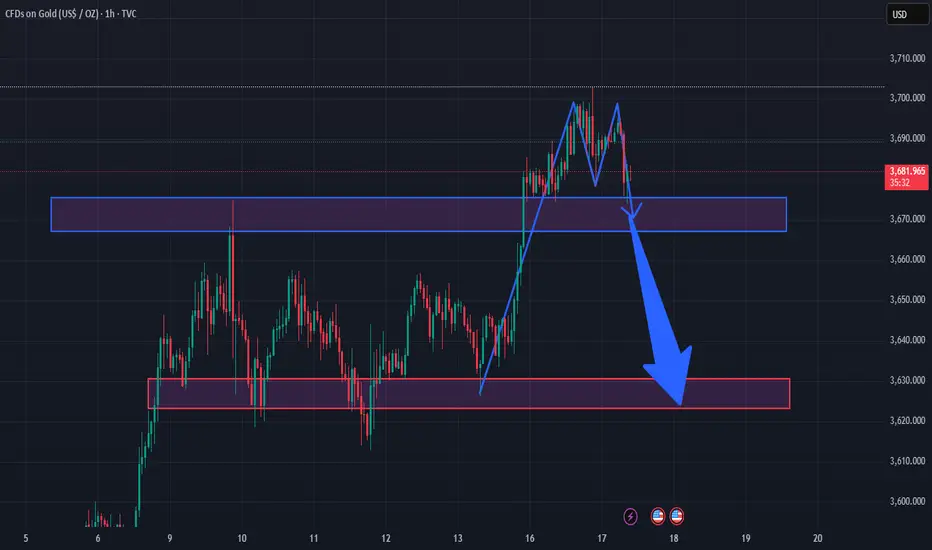
is forming a Double Top pattern1. Technical pattern
The gold chart (XAU/USD, H1 frame) is showing a Double Top pattern (2 peaks) - this is a classic bearish reversal pattern.
After creating 2 peaks around the 3,700 area, the price has turned down to the support area.
2. Important areas
Short-term resistance: around 3,695 - 3,705 (old peak).
Nearby support: 3,670 - 3,675 area (blue box). This is the neckline of the Double Top pattern.
Next strong support: 3,630 - 3,640 area (red box). This is the area where the price has maintained the previous uptrend.
3. Price scenario
If the price maintains the blue box (does not break the neckline) → it can bounce back to test the 3,695 - 3,705 area.
If the price breaks through the green box with strong volume → confirms the completion of the Double Top pattern, it is likely to fall to the red box 3,630 - 3,640.
The short-term trend is leaning towards bearish (down) due to the appearance of a reversal pattern.
4. Trading suggestions
Sell when the price clearly breaks through 3,670 - 3,675.
Take profit around 3,630 - 3,640.
Stop loss above the nearest peak 3,705 to limit risk.
👉 Summary: This chart is leaning towards a bearish scenario. Neckline 3,670 - 3,675 is the key to confirm the Double Top pattern.
GOLD → A s.triangle against the backdrop of a bullish trend... FX:XAUUSD is consolidating in anticipation of positive news from the Fed, namely a cut in interest rates. Against this backdrop, the dollar is falling, which only supports the price of gold...
Gold is trading in a sideways range around $3650 at the start of a week packed with central bank events. Despite the lack of a clear direction, the metal is finding support thanks to several factors.
Key drivers: Weak economic data from China, anticipation of the Fed's decision: On Wednesday, the Fed will almost certainly cut rates by 25 basis points, but there is a chance of 50 basis points. This supports gold.
The tone of Powell's comments will determine expectations for further cuts.
Technically, gold remains stable ahead of key events. China's weak economy and the Fed's dovish policy limit the potential for decline. A break above $3650 is possible with dovish signals from the Fed or an escalation of trade risks.
Resistance levels: 3646, 3657, 3675
Support levels: 3630, 3620, 3600
As part of the formation of a “symmetrical triangle” consolidation, I will consider a retest of the consolidation support with the possibility of further growth (distribution).
Sincerely, R. Linda!

BITCOIN → Consolidation in anticipation of a bullish driver...BINANCE:BTCUSDT is testing the 117K area as part of an upward movement triggered by the end of the bearish correction. The price is moving into consolidation. Focus on the range boundaries...
The market is awaiting the Fed's interest rate meeting. A rate cut could support the growth of the flagship, but before that, the market may form a manipulation in the form of a long squeeze.
The market is forming consolidation after breaking the local correction against the backdrop of a global bullish trend. Focus on the boundaries of the range.
Technically, I would highlight the support of local consolidation and the previously broken trend boundary as two key details that can be used in further trading: 114600, 113300. Behind this zone lies a pool of liquidity, and before a possible rise, the price may try to absorb it... Technically, we are seeing confirmation of a bullish market structure; all that remains is to wait for the appearance of a bullish driver and the market's readiness for growth.
Support levels: 114600, 113300, 110700
Resistance levels: 11700, 117860
A false breakdown of support followed by a close above one of the specified zones could attract buyer interest, which in turn could trigger a price increase within the global bullish trend.
Best regards, R. Linda!

EUR/NZD – Trendline Broken, Bears Warming UpAfter touching the psychological 2.00 handle once more at the end of August, EUR/NZD started to fall. Last week, the pair finally broke below the rising trendline that had been intact since June — a technical signal that momentum is shifting.
Following the recent low at 1.9627, the pair is now in a normal rebound. But rebounds after a trendline break are often just pauses before continuation. Once this corrective move is complete, I expect fresh downside pressure to return.
My trading plan:
• Look to sell rallies into resistance.
• Expect at least a 500-pip decline, targeting the 1.9200 support zone.
• The bearish scenario remains valid as long as price stays below 1.9950.

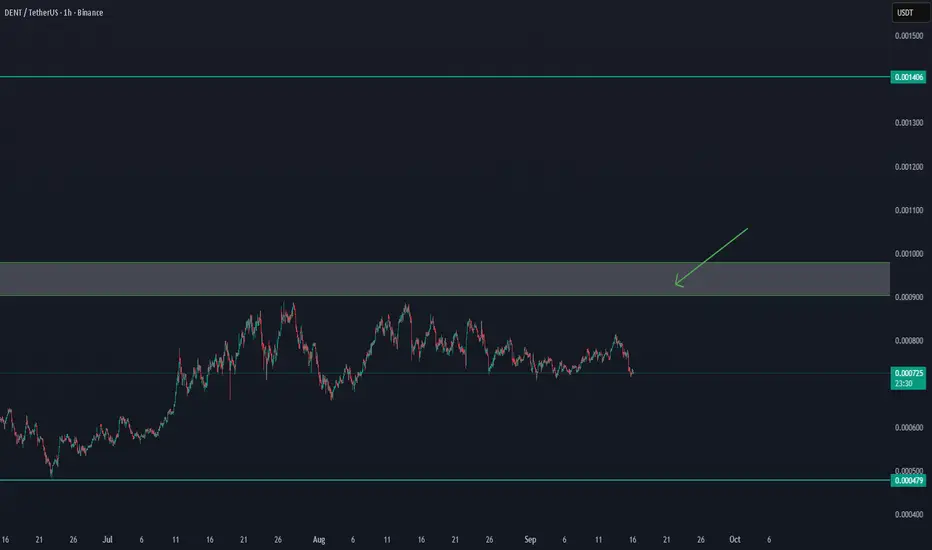
DENT'/USDT UPDATE Confirmation after $0,00093DENT/USDT UPDATE
DENT is showing signs of strength, but we need confirmation.
Key level to watch: $0.00093
✅ A clear breakout and hold above $0.00093 could trigger further upside momentum.
⚠️ Until then, price remains in a consolidation zone and risk of pullback is present.
Plan:
Wait for confirmation above $0.00093 before re-entering longs.
Next resistance levels to monitor: $0.00105 – $0.00120
Support remains around $0.00085 – $0.00080
Conclusion: Break and retest of $0.00093 will be the bullish signal for continuation.
SOUN Long SOUN Long position off of trend line retest. Jumped down on the 5 min time frame to get my entry. Pulled a fib off of the rally on market open. Got in on the .618. Perfect retest of the trend line (Closed on a doji candle. Stopped on .618 then turned right around. I will be closing half of my position at $15.21. Will close the rest at pervious high ($15.53)
Thank you for viewing. What are your thoughts?

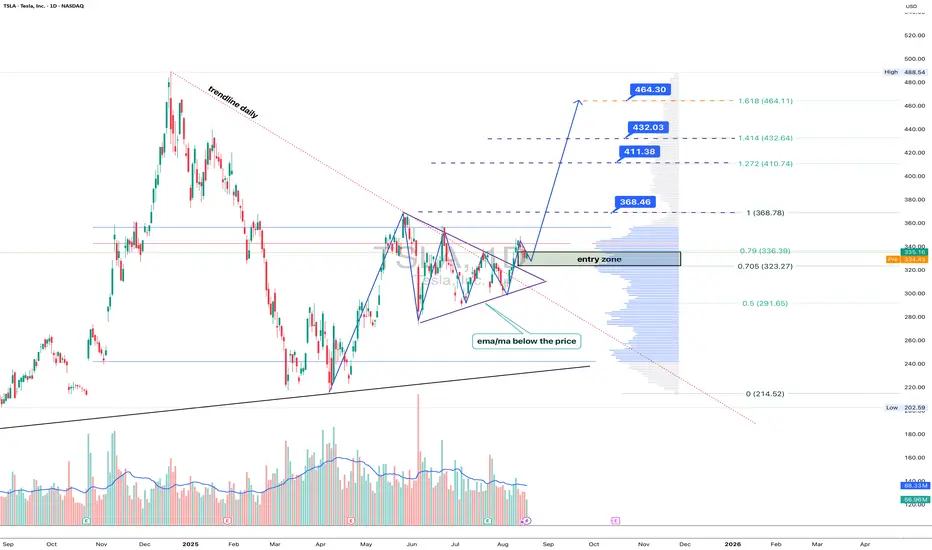
Tesla: breakout mode, Elon’s rocket fuel for the chartTechnically , Tesla broke out of a symmetrical triangle while holding above EMA/MA supports, which confirms bullish control. The breakout unlocks targets at 368.46 (Fibo 1), followed by 411.38, 432.03, and the 1.618 extension at 464.30. Volume profile confirms strong accumulation below, leaving the upside path less crowded.
Fundamentally , Tesla keeps investor attention alive. EV sales stabilized, but the focus has shifted to AI and robotaxi — Musk’s latest promises of disruption. With Fed rates peaking and yields easing, growth stocks regain momentum. Risks remain from Chinese competitors, yet Tesla’s margins are still leading the industry.
Tactical plan : entry zone stands at 323–336. As long as price holds above it, buyers target 368.46 → 411.38 → 464.30. A break below 323 would flip the bias back toward 291.
Bottom line: Tesla’s chart looks ready for lift-off. Musk might be dreaming of Mars, but for now, bulls are happy if he just launches the stock a few hundred dollars higher.
GOLD → Consolidation before continuing growth to 3700 FX:XAUUSD resumed its growth on Friday, approaching the $3,650 level, amid growing expectations of aggressive Fed rate cuts and geopolitical risks. The metal remains near record highs and is poised for a fourth consecutive week of gains.
Key drivers: Probability of a 25 bp rate cut on September 17 — 92%, chance of a 50 bp cut — 8%. Markets are expecting three cuts in 2024. US plans to impose new tariffs on India and China are supporting demand for safe havens.
Gold remains in a bullish trend. The weak US economy and geopolitics are pushing it to new highs, but profit-taking at current levels is possible.
There is no news today, so trading may be relatively calm.
Technically, if the price does not retest 3738 but begins to consolidate near 3657 and attempts a breakout, the chances of continued growth will increase.
Support levels: 3638, 3630
Resistance levels: 3649, 3657
I expect the market to reach the liquidity zone of 3638 before returning to retest the trigger. However, if MM deems this maneuver unnecessary and forms a trading range between 3657 and 3649, then closing above 3657 could lead to another bullish distribution.
Sincerely, R. Linda!

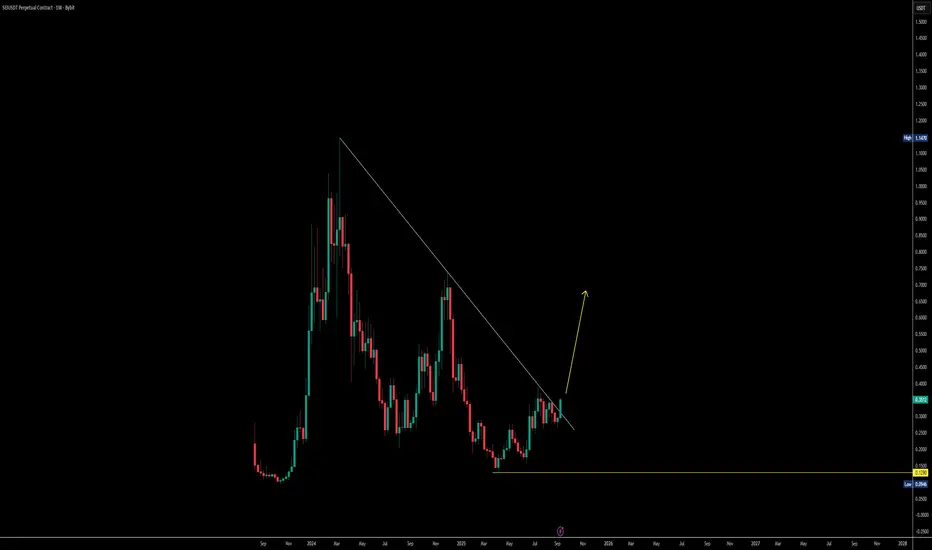
RSI + Breakout Confirm Bullish Pattern on SEIUSDT📈 SEIUSDT Weekly Breakout – Bulls in Control
If we zoom out to the weekly timeframe, SEI is doing something very important right now. The price is breaking above a major resistance zone that has been holding it back for a long time. When such a key resistance gets taken out, it often signals the start of a much bigger move.
Looking at the technicals:
RSI on weekly is pushing higher, showing strong momentum.
Structure looks clean — this isn’t just a small bounce, it’s shaping up as a true breakout pattern.
Market expectations are building for upside targets, with $0.75 as a first key level and potentially even $1.00 on the horizon if momentum continues.
Overall, this is a bullish setup where buyers are gaining control. If the breakout sustains, the upside returns could be significant in the coming weeks.
AIN PREPARING FOR BREAK OUTS One of the best charts in the current market.
Perfect accumulation tells about smart market maker.
Watching out closely , it can blast anytime

Bitcoin trend reversal done ? It is quite evident from the previous plan that we have faced trend reversal for bitcoin. We had a classic breakout followd by retest , consolidation and pumps. Bitcoin had been dumping for a while now and it we were expecting something like this in the near time .
Bitcoin is currently targeting 117k2 followed by 119k4 and 123k resistance for now.
A candle close below 115k will invalidate the bullish bias.
We have also shared a lot of altcoins trade along with the Btc view on our app.
Dont forget to check out ........


GOLD → Retest 3620 - 3600 (imbalance zones) on the uptrendFX:XAUUSD is consolidating ahead of important news. The market is currently testing support, but the bullish pattern remains intact despite the intraday correction.
Gold is trading near $3650 in anticipation of US inflation data (CPI), which will determine the further trend. So far, the metal is consolidating below a record high of $3675.
High CPI data: will strengthen the dollar and weaken gold (bets on Fed easing will decline).
Low data: will push gold to new highs (the likelihood of aggressive rate cuts will be confirmed).
At the moment, the probability of a rate cut on September 17 is 92% (25 bps), with an 8% chance of 50 bps.
Technically, the chart is forming a consolidation against the backdrop of a bullish trend, the market is testing support, and if the bulls hold their ground in the key zone, traders may return to buying.
Resistance levels: 3638, 3649, 3657
Support levels: 3620, 3607, 3600
There is a battle for the 3620 zone. Consolidation above this zone will confirm bullish strength; otherwise, we can expect a deeper correction to the 3607-3600 zone to retest the imbalance area before further growth.
Best regards, R. Linda!
