XAUUSD: Descending After Fake Breakout - Bears in ControlHello everyone, here is my breakdown of the current XAUUSD setup.
Market Analysis
XAUUSD initially spent a prolonged period trading inside a well-defined range, where price respected clear support and resistance boundaries. This range reflected market indecision, with neither buyers nor sellers able to gain sustained control. Eventually, price broke out to the upside, confirming bullish intent and triggering a strong impulsive rally.
Currently, after the rejection, price broke back below short-term structure and started forming a descending triangular structure, defined by a clearly respected descending resistance line. Each bullish attempt toward this trendline has been rejected, signaling that sellers remain in control. At the same time, price is gradually rotating lower toward the 4,350 Support Zone, which previously acted as a key demand and breakout area.
My Scenario & Strategy
My primary scenario: as long as XAUUSD remains below the 4,490 Resistance Zone and continues to respect the descending resistance line, the bearish bias remains valid. Rejections from this trendline favor further downside continuation toward the 4,350 Support Zone, which is the first major downside target. If price breaks and accepts below the 4,350 Support Zone, this would confirm bearish continuation and open the door for a deeper corrective move toward lower support levels.
However, if buyers manage to reclaim the descending resistance line and achieve a clean breakout and acceptance above the 4,500 resistance area, the short bias would be invalidated and the market could transition back into bullish continuation. For now, structure favors sellers, momentum is weakening near resistance, and price remains capped below key supply.
That's the setup I'm tracking. Thank you for your attention, and always manage your risk.
Triangle

GOLD - Storm 4475 ahead of the news. NFP aheadFX:XAUUSD is stabilizing at 4475 in a state of consolidation. However, ahead lie US employment data and the Supreme Court's decision on Trump's trade powers...
Fundamentals:
60K new jobs are expected to be created in December, unemployment may fall to 4.5%, and wage growth to 3.6% y/y. As for the Supreme Court, it will decide whether Trump can impose tariffs without Congress' approval (IEEPA law).
The market also continues to expect 2-3 interest rate cuts in 2026. Geopolitical tensions are supporting demand for defensive assets.
Today, the market is waiting for NFP. Strong data will lower expectations of Fed easing, strengthen the dollar, and put pressure on gold (to $4300), but weak NFP data will reinforce bets on rate cuts and support gold (to $4550). The court's decision on tariffs will affect trade policy and the dollar.
Resistance levels: 4475, 4500, 4525
Support levels: 4460, 4442, 4427
A breakout and consolidation above 4475 could open the way to 4500, a breakout of which could trigger a rally to 4525-4550, but given the volatility of the news, the market may test the support zone before a possible rise.
Best regards, R. Linda!

BTCUSD Holds Buyer Zone - Bulls Target 91,500 ResistanceHello traders! Here’s my technical outlook of BTCUSD (2H) based on the current chart structure. BTC previously traded inside a well-defined range, where price moved sideways for an extended period, showing balance between buyers and sellers. This consolidation acted as an accumulation phase. A strong breakout to the upside from the range confirmed renewed bullish interest and initiated an impulsive move higher. Following the breakout, price respected a rising Support Line, forming a sequence of higher highs and higher lows, which confirms a bullish market structure. As BTC pushed higher, it reached the Seller Zone / Resistance Level around 91,500, where selling pressure emerged. Price reacted from this level and pulled back, indicating that sellers are actively defending this resistance. The pullback, however, remained controlled and corrective, with price returning toward the Buyer Zone, which aligns with a key Support Level around 89,200–90,000 and the rising support trend line. Currently, BTC is holding above the Buyer Zone and the ascending support line, showing that buyers are still defending structure. The recent price action suggests consolidation rather than a breakdown, keeping the bullish scenario valid as long as support holds. My scenario: as long as BTCUSD remains above the Buyer Zone and respects the rising Support Line, the bullish bias remains intact. I expect buyers to defend this area and attempt another push toward the 91,500 Resistance Level (TP1). A clean breakout and acceptance above resistance would confirm bullish continuation and open the door for further upside. However, a decisive breakdown below the Buyer Zone would weaken the structure and increase the probability of a deeper corrective move. For now, price is at a key decision area, and patience with proper risk management is essential. Please share this idea with your friends and click Boost 🚀

GOLD - Correction and retest of support on a bullish trend FX:XAUUSD is forming a correction from the resistance level of 4500 and reaching a local low of 4415. Against the backdrop of DXY growth, the correction may continue. The market is awaiting economic news...
Mixed US data: JOLTS job openings fell to 7.146 million. ADP employment rose by 41,000. The ISM services index rose to 54.4, which is higher than expected.
Expectations for two Fed rate cuts in 2026 remain (≈61 bps). The fundamental backdrop is mixed, with additional confirming data needed.
Geopolitics supports demand: the US has confirmed negotiations on the acquisition of Greenland. China has imposed a ban on the export of dual-use goods to Japan. The focus is shifting to Friday's US employment report (NFP).
The correction in gold appears to be temporary amid continuing expectations of Fed policy easing and geopolitical tensions. The NFP report will be the decisive factor in determining the direction — weak data could trigger a new round of growth.
Resistance levels: 4442, 4475, 4497
Support levels: 4427, 4400
As part of the correction, gold may test the support zone of 4425-4400. Overall, the trend is bullish, and the market correction may be temporary. A false breakdown and the bulls holding the price above key zones could trigger growth towards the flat resistance.
Best regards, R. Linda!

XAUUSD Long: Demand Defended - Bulls Prepare for Push To $4,530Hello traders! Here’s a clear technical breakdown of XAUUSD (3H) based on the current chart structure. Gold is trading within a well-defined ascending channel, confirming sustained bullish control and a strong trending environment. Price has consistently respected both the channel support and resistance, forming higher highs and higher lows. This structure highlights healthy momentum rather than an exhausted move.
Earlier, XAUUSD pushed into the Supply Zone around 4,500–4,530, where selling pressure appeared and price experienced a sharp rejection. This rejection led to a corrective pullback, during which price briefly broke below short-term structure before finding support at the Demand Zone near 4,400. This area aligns with the channel support and acted as a key reaction level. Within the pullback, price formed a Head and Shoulders–type corrective pattern, which completed near demand. Instead of continuation lower, sellers failed to follow through, and buyers stepped in aggressively. Price reclaimed structure with a clean breakout back above local resistance and the rising Demand Line, signaling that the move lower was corrective rather than a trend reversal. Currently, XAUUSD is holding above the 4,400 Demand Zone and continues to respect the ascending channel. Price is consolidating and building higher lows, suggesting accumulation before the next impulse.
My scenario: as long as Gold holds above the demand zone and the rising demand line, the bullish structure remains intact. I expect buyers to defend this area and push price toward the 4,530 Supply Zone (TP1). A clean breakout and acceptance above supply would confirm bullish continuation and open the door for further upside expansion. However, a decisive breakdown below the demand zone would weaken the structure and increase the risk of a deeper correction. For now, the trend favors the bulls, with demand holding and momentum gradually rebuilding. Manage your risk!

EURUSD Rejection From Key Resistance, Target 1.1640Hello traders! Here’s a clear technical breakdown of EURUSD (1H) based on the current chart structure. After a strong bullish impulse earlier, EURUSD transitioned into a corrective phase and started trading inside a well-defined descending channel, indicating controlled bearish pressure rather than an aggressive sell-off. Price respected both the channel resistance and channel support, confirming the validity of this corrective structure. On the left side of the chart, we can see a breakout from a prior consolidation, followed by an impulsive bullish move. This rally eventually stalled and turned around near the upper highs, where selling pressure emerged and pushed price into the descending channel. During this phase, multiple reactions from the channel boundaries showed balanced participation from both buyers and sellers. As price moved lower, it approached the highlighted Seller Zone / Resistance Level around 1.1680. A short-term fake breakout above channel resistance occurred, but buyers failed to hold acceptance above it, signaling that sellers are still active at higher levels. Price then continued lower within the channel. The primary bearish scenario comes into play if EURUSD fails to hold above the 1.1680 Resistance / Seller Zone and shows clear rejection from this area. This zone aligns with the descending channel resistance, making it a high-probability area for sellers to step in. If price retests the 1.1680–1.1700 resistance area and forms bearish rejection signals (long upper wicks, bearish engulfing candles, or failure to hold above channel resistance), it would confirm that the move higher is corrective in nature. In this case, sellers are likely defending the structure and maintaining overall bearish control. Once rejection is confirmed, I expect price to resume its move lower inside the descending channel, targeting the 1.1640 Buyer Zone / Support Level as the first downside objective (TP1). A clean break and acceptance below this support would strengthen bearish momentum and open the path toward lower support levels, extending the correction further. However, if price breaks and holds above the descending channel resistance and the 1.1700 level, the short scenario becomes invalid, signaling a potential trend shift or deeper bullish continuation. For now, the market remains in a corrective bearish structure, and shorts are favored on pullbacks into resistance, as long as price stays below the key resistance zone. Please share this idea with your friends and click Boost 🚀

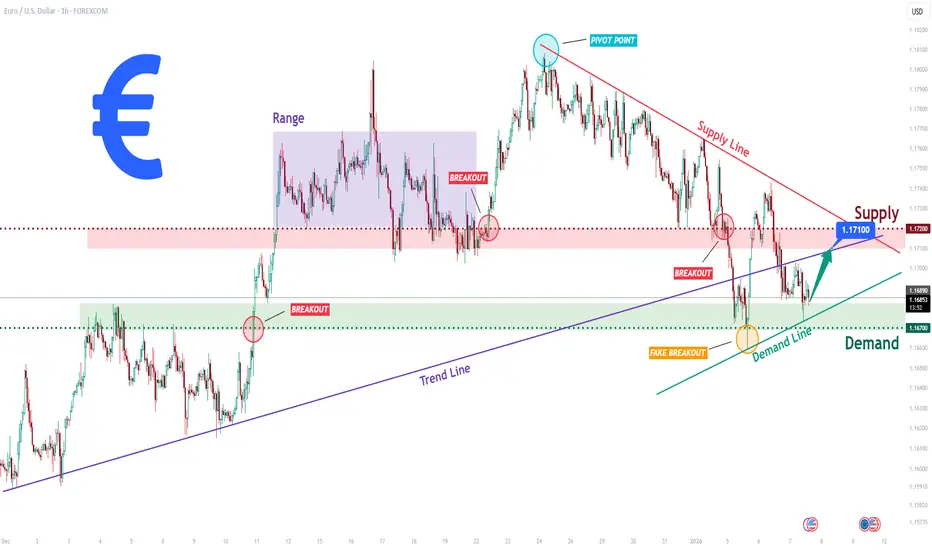
EURUSD Long: Compression Near Key Zones Signals Upcoming MoveHello traders! Here’s a clear technical breakdown of EURUSD (1H) based on the current chart structure. EURUSD previously traded within a well-defined ascending structure, respecting a rising trend line that acted as dynamic support during multiple pullbacks. This bullish phase showed consistent higher lows, confirming buyer control. After the impulsive upside move, price entered a consolidation range, highlighted on the chart, where buyers and sellers temporarily reached equilibrium. From this range, EURUSD executed a bullish breakout, confirming continuation and pushing price toward the upper structure. However, as price approached the Supply Zone around 1.1720–1.1750, bullish momentum started to fade. Multiple reactions, including fake breakouts and rejections near the pivot point, clearly signal strong selling pressure in this area. A descending Supply Line now caps price, reinforcing bearish pressure from above.
Currently, on the downside, price recently swept below short-term support, forming a fake breakout into the Demand Zone around 1.1670, which aligns with an ascending Demand Line. The quick recovery from this area suggests active buyers defending demand and preventing deeper downside for now. Currently, EURUSD is compressing between demand support and descending supply resistance, indicating a tightening structure and an upcoming directional move.
My scenario: as long as EURUSD holds above the 1.1670 Demand Zone and respects the rising demand line, a corrective bounce toward the 1.1710–1.1720 Supply Zone is possible. This area remains a key decision point. A strong rejection there would favor renewed bearish continuation, while a clean breakout and acceptance above supply would invalidate the bearish pressure and open the door for bullish continuation. Manage your risk!
SOLANA - retest resistance of the trading range BINANCE:SOLUSDT has been rising since the session opened amid a weak market. The altcoin is showing bullish momentum in a predominantly bearish market, with a focus on the 145.0 zone.
Bitcoin is rebounding from resistance amid a global downtrend. There is currently no bullish potential (across the entire market), which is putting pressure on altcoins overall.
SOL, against the backdrop of a neutral market, is seeking to test the resistance zone of 144.7 - 146.0 - a key liquidity zone that plays an important role for MM in the current circumstances.
A short squeeze and the formation of a reversal pattern could shift the imbalance towards sellers, which in turn could lead to a decline.
Resistance levels: 143.4, 144.7, 146.0
Support levels: 134.3, 127.55
Solana is trading in a neutral trading range of 145.0 - 123.0. The main trend is bearish. The bullish run and retest of resistance can be perceived as a hunt for liquidity. We are interested in the above-mentioned resistance zone and confirmation in the form of a false breakout to enter the market.
Best regards, R. Linda!

GBPJPY - Waiting for a Long Squeeze Before a Bullish RallyFX:GBPJPY is testing the key support area of 210.28 as part of a correction against the backdrop of an uptrend. What can we expect from the market?
The Japanese yen looks weak, forming a symmetrical triangle consolidation amid a global downtrend. A continued decline in the yen could trigger growth in the currency pair.
GBPJPY is consolidating between 210.28 and 211.59 amid a bullish trend. A manipulative decline is forming with the aim of hunting for liquidity. A long squeeze could trigger growth due to a shift in the imbalance towards the buyer.
Resistance levels: 210.7, 211.15
Support levels: 210.28, 210.05
There is a high probability of a false breakdown of the current trading range support. Focus on the 210.28 - 210.05 zone. After liquidity is captured, the upward movement may continue.
Best regards, R. Linda!

Nifty Defence Index is poised for a potential breakout Nifty Defence Index is poised for a potential breakout from a symmetrical triangle within a sustained uptrend channel, supported by recent geopolitical developments and pre-budget optimism that could further fuel upside momentum.
📊 Technical Setup: Bullish Continuation Potential
Price Action: The Nifty India Defence Index is currently trading near ₹7,891.65, showing signs of consolidation within a well-defined symmetrical triangle pattern. This formation is nested inside a broader ascending channel, indicating a long-term bullish structure.
Support Confirmation: Recent candles suggest that price is respecting the lower boundary of the channel, reinforcing it as a dynamic support zone.
Momentum Indicators: RSI readings across multiple timeframes (Weekly: 51.2, Monthly: 60.87) reflect neutral-to-positive momentum, with no signs of overbought conditions, leaving room for further upside.
📰 News-Driven Catalysts: Budget Optimism & Geopolitical Tailwinds
Recent developments have added fuel to the technical setup:
Pre-Budget Rally: Defence stocks like BEL, HAL, BDL, and Mazagon Dock have rallied up to 5% in early January 2026, driven by expectations of increased capital allocation in the upcoming Union Budget.
Geopolitical Escalation: The announcement of Operation Absolute Resolve and rising US-Venezuela tensions have triggered a global defence sector rally. Domestic players such as MTAR Technologies and Solar Industries surged over 6% and 3% respectively, pushing the Nifty Defence Index to a one-month high.
Policy Support: Fresh procurement approvals and a strategic push toward indigenous defence exports have reinforced investor confidence.
🔮 Forward Outlook: What to Watch
Factor Impact on Price Commentary
Triangle Breakout Bullish A breakout above the triangle’s upper trendline could trigger a sharp rally toward the channel’s upper boundary.
Budget 2026 Bullish Higher defence spending could act as a fundamental catalyst for sustained upside.
Global Tensions Bullish Continued geopolitical uncertainty may increase demand for defence assets.
RSI & Volume Neutral to Bullish RSI levels are constructive; watch for volume expansion on breakout confirmation.
🧭 Strategic Takeaway
If the index breaks above the triangle with volume confirmation, it could initiate a fresh leg toward ₹8,200–8,400, aligning with the channel’s upper resistance. Conversely, failure to hold the channel bottom (~₹7,700) may invite short-term consolidation. Traders should monitor budget announcements and global headlines closely, as they could act as immediate triggers.

Silver Forming an Ascending TriangleIn my previous analysis I thought Silver could possibly be forming a bull flag, but since the passage of time progressed I think it is forming an ascending triangle instead. Which is still bullish. Target price is approximately $95. Not financial advice, just a pattern I see potentially forming

PAEL - Technical Outlook PAEL is showing a potential breakout above a long-term descending resistance trendline, supported by increased volume and a firm base on the ascending trendline near 52. A sustained move above 54 could signal a strong bullish continuation with clearly defined targets:
• TP1: 56.03
• TP2: 57.82
• TP3: 60.20
• TP4: 62.63
Stop-loss is recommended at 51.30 to protect against false breakouts. Momentum indicators support a cautiously optimistic outlook.

Ascending Triangle appearing.ATRL Analysis
Closed at 764.18 (08-01-2026)
Ascending Triangle appearing.
Immediate resistance is around 765 - 790.
Crossing & Sustaining this range may give
a breakout towards 1200+
Breaking 645 may bring more selling pressure towards
560 - 600.

ATRL – Swing setupATRL has provided an upside breakout from a symmetrical triangle / compression zone on the daily chart. After multiple sessions of consolidation, price has maintained a higher-low structure and is showing strength supported by volume. The overall trend signals a bullish continuation as long as the price holds above key support levels.
Buying Zone:
• First Buy: 688–690 (CMP zone – already shared during market hours)
• Second Buy (on dip): 672 (trendline & structural support)
Stop Loss:
• 640 (below major structural support)
Targets:
• TP1: 720
• TP2: 740
• TP3: 775 (major breakout level)
Notes:
Price is trading above the ascending trendline and RSI is also indicating strength. Minor pullbacks are buyable as long as the structure remains intact. Partial profit booking is recommended in the 720–740 zone, while 775 remains the medium-term breakout target. The trend will remain bullish unless 640 is breached.
For educational & technical discussion purposes only.

$FISV ready to launchNASDAQ:FISV is trying to recover from a major selloff just months ago. One catalyst since then was heavy insider share purchases to establish confidence among investors.
Fundamentals aside, an ascending triangle has been forming and we're right at the apex, which sits in front of a massive gap. That gap fill could provide north of 70% returns, and it might just be the beginning of the recovery trade!

BTCUSD – DailyBitcoin (BTCUSD) has corrected sharply after a strong rally toward 120K+, and is now forming a higher low structure.
Price is currently compressed between:
• An ascending trendline
• A major horizontal resistance near 94,000
→ Ascending triangle / compression structure
Key Levels
• Dynamic Support:
Ascending trendline (87,000 – 88,000)
• Major Static Support:
85,000 – 86,000
• Key Resistance:
93,500 – 94,500
• Next Resistance:
98,000 → 102,000
Bullish Scenario (Primary)
If price:
• Closes above 94,500 (daily close)
• Confirms the breakout with a retest
➡️ Bullish continuation becomes likely.
Upside Targets:
98,000 → 102,000 → 110,000
Invalidation / Stop:
Daily close below 87,000
Bearish Scenario (Alternative)
If price:
• Breaks below the ascending trendline
• Closes under 87,000
➡️ Deeper correction is likely.
Downside Targets:
85,000 → 81,000
Bearish Invalidation:
Acceptance above 94,500
Final Takeaway
BTC is at a critical decision zone.
A breakout above 94K favors continuation, while losing 87K signals further downside.

ETERNAL is compressing under a major supply zone.ETERNAL (Zomato) Daily Chart
Validating this strictly against my breakout framework:
Flat resistance: ₹286–288
Touched 4+ times → strong supply zone
Rising trendline:
₹272 → ₹276 → ₹280 → ₹282 → higher lows
Buyers stepping in earlier each time
Price is compressing into resistance.
Apex not reached yet. Pressure building.
This is a textbook ascending triangle.
No breakout yet.
Today’s high was ₹292 but close is still below resistance.
Real confirmation happens only on a daily close above ₹291 with volume.
Triangle height ≈ ₹16
Breakout projection → ₹304+
Watching this for a clean expansion move.
#ETERNAL #Zomato #NSE #TechnicalAnalysis #Breakout
This is for educational purpose. Do your research before you invest.

Beautiful Breakout of Ascending Triangle.OBOY Analysis
Closed at 12.69 (09-01-2026)
Beautiful Breakout of Ascending Triangle.
10.90 - 11.55 seems to be a very Important Support.
Upside resistance is around 16, however mid way
resistance still lies around 12.50 - 13.50
Breaking 10 may bring the price towards 9 -9.10

$BIST:DENGE/FX:USDTRY update$BIST:DENGE/FX:USDTRY
risk of a decending triangle. cancelling long idea for now

Steel cast can be breakout swing investment ideaThe trendline are self explainatory and the candle stick pattern already given small wick about the trendline. In todays bearish market, the full body candle gives an entry opportunity for Breakout.

The 3-Step Rocket Booster Strategy + Non Farm Payrolls CatalystToday is the non farm payrolls
this economic data is known to be
a very good catalyst for price movements
This is why i had to hand in
this report to give you a heads up.
Yesterday i missed a trade in IBM NYSE:IBM
not only that about a week ago i made
a mistake in Starbucks..
The Starbucks mistake was due to
me not factoring
a very important pattern called
the ascending triangle
which is the one i use for my swing trading
Even though i am going to try
to give you better reports
With this one i am confident that
it will show us the outcome
we might be looking for
This is because its follwing the
3 step rocket booster strategy
1- The price is above the 50 ema
2- The price is above the 200 ema
3- The price has gapped up
The last step is very important because
its showing
you the ascending triangle
chart pattern
and you can see this
chart pattern
using the stochastic rsi
you can see below
look at how the lines have
crossed each other
Almost like a "rising triangle"
thats the chart pattern we
are looking for
Do you see it?
Rocket boost this content to learn more.
Disclaimer:Trading is risky please learn by
using a simulation account
to trade before you trade with real money.

Cipher Mining(CIFR) 1D: compression before expansionCipher Mining is a US-listed Bitcoin mining company with direct exposure to the BTC cycle and infrastructure scalability.
On the daily chart, price is forming a symmetrical triangle after the prior impulse. The key decision zone sits around 15, where the 0.786 Fibonacci level, diagonal support, MA100 and volume profile align. This area defines the execution zone, while direction is confirmed by higher timeframes.
Direction comes from the higher timeframes. On the weekly and monthly charts, indicators maintain a bullish configuration: moving averages are rising and positioned below price, the broader structure remains intact, and oscillators stay neutral-bullish with no reversal signals. This confirms that the current daily consolidation is occurring within a larger bullish context. The daily MA100 acts as dynamic support inside the range, strengthening the importance of the 15 level.
The base scenario assumes support holding at 15 followed by an upside breakout from the triangle. Initial targets sit near 20.5, followed by 25.5. A decisive breakdown below 15 invalidates the setup.
Fundamentally, CIFR remains a cyclical mining play. Revenue remains elevated, with the next quarterly estimate around $88M. EPS is still negative and free cash flow remains under pressure, which is typical during expansion phases. Strong financing inflows help support liquidity and ongoing infrastructure growth. The stock remains a leveraged bet on Bitcoin continuation.
In short: daily defines the entry, weekly and monthly define the direction.

Selena | XAUUSD – M30 | Ascending Channel Under HTF ResistancePEPPERSTONE:XAUUSD
Despite bullish momentum inside the channel, price remains below the recent swing high and HTF resistance. This keeps the structure conditional, with continuation dependent on a confirmed break in market structure.
Key Scenarios
✅ Bullish Case (Conditional)
– Strong reaction from channel support
– M30 close above 4495 → Bullish BOS confirmed
🎯 Target 1: 4525
🎯 Target 2: 4550 (Range High / Liquidity)
🎯 Target 3: ATH expansion
❌ Bearish Case
– Failure to hold channel support
– Acceptance below 4420
🎯 Downside: 4380 → 4320
Current Levels to Watch
Resistance 🔴: 4495
Support 🟢: 4420
Invalidation ❌: M30 close below channel
⚠️ Disclaimer: This analysis is for educational purposes only. Not financial advice.
❌ Bearish Case
– Failure to hold channel support
– Acceptance below 4420
🎯 Downside: 4380 → 4320
Current Levels to Watch
Resistance 🔴: 4495
Support 🟢: 4420
Invalidation ❌: M30 close below channel
⚠️ Disclaimer: This analysis is for educational purposes only. Not financial advice.
