AUDUSD → Pre-breakout consolidation for trend continuationFX:AUDUSD may continue its upward trend. After another local distribution, the currency pair is consolidating and may repeat the cycle
The dollar index continues to fall, the global trend is clear, and the price is testing multi-year lows. After yesterday's speech by Powell, the decline may intensify amid expectations of a rate cut, which will only support AUDUSD.
AUDUSD is moving within an uptrend, stopping below resistance at 0.6583, but is not going to fall.
There was a false breakout (the zone was tested), the structure is not broken, and the price continues to squeeze towards resistance, which could lead to a breakout and growth
Resistance levels: 0.6583
Support levels: 0.6566, 0.6556
There is potential accumulation in the market, and the market is choosing growth against the backdrop of a falling dollar as its direction. Accordingly, the currency pair is one step away from a possible realization phase. Thus, if the price breaks 0.6583 and consolidates above this zone, it may continue to grow in the short and medium term.
Best regards, R. Linda!
Triangle

ULTRACEMCO - 1 year INVERTED TRIANGLE══════════════════════════════
Since 2014, my markets approach is to spot
trading opportunities based solely on the
development of
CLASSICAL CHART PATTERNS
🤝Let’s learn and grow together 🤝
══════════════════════════════
Hello Traders ✌
After a careful consideration I came to the conclusion that:
- it is crucial to be quick in alerting you with all the opportunities I spot and often I don't post a good pattern because I don't have the opportunity to write down a proper didactical comment;
- since my parameters to identify a Classical Pattern and its scenario are very well defined, many of my comments were and would be redundant;
- the information that I think is important is very simple and can easily be understood just by looking at charts;
For these reasons and hoping to give you a better help, I decided to write comments only when something very specific or interesting shows up, otherwise all the information is shown on the chart.
Thank you all for your support
🔎🔎🔎 ALWAYS REMEMBER
"A pattern IS NOT a Pattern until the breakout is completed. Before that moment it is just a bunch of colorful candlesticks on a chart of your watchlist"
═════════════════════════════
⚠ DISCLAIMER ⚠
Breakout Area, Target, Levels, each line drawn on this chart and any other content represent just The Art Of Charting’s personal opinion and it is posted purely for educational purposes. Therefore it must not be taken as a direct or indirect investing recommendations or advices. Entry Point, Initial Stop Loss and Targets depend on your personal and unique Trading Plan Tactics and Money Management rules, Any action taken upon these information is at your own risk.
═════════════════════════════

GOLD - Price can continues rise to resistance level and break itHi guys, this is my overview for XAUUSD, feel free to check it and write your feedback in comments👊
Price made an upward impulse from the support line of the triangle and rose to the resistance line, breaking two levels.
Then the price dropped back, after which repeated impulse and exited from the triangle, reaching the resistance area.
After this movement, Gold started to trades inside a wedge, where it dropped from the resistance line to the support line.
Next, the price in a short time rose from this line to the resistance line again, breaking $3230 and $3400 levels.
But recently, it made a correction to the support line, breaking $3400 level again, and then started to grow.
Now, I expect that Gold can little decline and then continue to move up to $3470, breaking the resistance level.
If this post is useful to you, you can support me with like/boost and advice in comments❤️
Disclaimer: As part of ThinkMarkets’ Influencer Program, I am sponsored to share and publish their charts in my analysis.

AUDCHF AUDCHF is preparing to break through support and fallWeak market structure. Gradually declining lows and no reaction to support at 0.5211. Buyers are trying to keep the price above 0.5211, but under market pressure their strength is weakening.
Relative to 0.5211, we see the formation of consolidation, which is of a “pre-breakdown” nature.
Accordingly, a break below the 0.5211 support level could trigger the activation of buyers' SL orders, leading to liquidation and a downward price distribution.
Potential targets include 0.518 and 0.5164.

XAUUSD Forming Triangle Pattern – Eyeing Breakout After Wave (e)🚨 Gold (XAUUSD) Technical Analysis – 3H Chart
Gold is currently forming a classic contracting triangle pattern (ABCDE), with wave (e) in progress. Price is bouncing from a strong buyers’ zone near 3269.60, showing signs of upward pressure.
📊 Current Structure:
Wave count: (a)-(b)-(c)-(d)-(e)
Consolidation within a symmetrical triangle
Key support: 3269.60
Resistance zone to watch: 3408.00
📈 Potential Scenario:
If price holds above the buyer’s zone, we can expect a bullish wave (e) push towards the upper trendline at 3408, potentially leading to a breakout continuation.
📍 Trade Plan (Educational Purpose):
Long Setup Valid Above: 3269.60
Target: 3408.00
Stop Loss (SL): Below 3260 (based on your risk profile)
---
🧠 Why This Matters?
This triangle setup often leads to strong breakout moves, especially in commodities like gold during fundamental uncertainty or dollar index shifts. The market is compressing — be prepared for the breakout move.
---
📢 Follow for more clean Elliott Wave + Price Action setups!
💬 Drop your analysis in the comments. Let’s grow together!

Gold setup: ascending triangle and Trump’s debt bombGold just formed an ascending triangle, and a breakout could send it $300 higher. In this video, we analyse the new pattern, the key breakout level, and why Trump’s new tax bill and Powell’s potential replacement could spark a major move. Will fundamentals match the technicals? Watch to find out.

RSKD - breakout confirmed, now waiting for retestRiskified (RSKD) shows a textbook breakout setup: daily triangle plus 4H bullish flag. Price already broke out and is now retesting the 0.618 Fibonacci retracement at $5.21, which also matches the flag resistance flip and EMA cluster. This is a clean buy zone with strong technical alignment.
Volume spiked during the breakout, trend structure remains intact, and moving averages are converging — usually a precursor to strong moves. The current pullback is orderly, and if buyers show strength on this retest, the price could target $6.00, then $6.54, and potentially $7.25 (1.618 extension).
Fundamentally, Riskified offers fraud prevention tech for e-commerce. The business is benefiting from global growth in online transactions and improved margin control. While still unprofitable, recent quarters showed progress toward positive operating leverage and strong client acquisition.
Tactical plan:
— Entry on confirmation from $5.21 retest
— TP1: $6.00
— TP2: $6.54
— TP3: $7.25
— SL: below $4.90 or $4.43 support zone
You’ve been watching this one. The triangle broke. The pullback is clean. Maybe it’s time to stop watching and start participating.

GOLD 4H: structure broken - phase reversal beginsTwo key directional signals were recorded on the gold chart: first, a breakdown of the ascending channel, followed by a confident downward exit from the triangle with a clear fixation under the $3297 boundary. Both figures worked independently, but consistently - and strengthened the impulse towards selling.
The price has already gone beyond the lower boundary of the triangle ($3297), confirming the bearish scenario. Candlesticks closing under the level and local consolidation from below is a characteristic formation before the momentum continues.
Technical parameters:
- Channel breakout: completed
- Triangle breakout: $3297 level
- Retest from below: expected as confirmation
- EMAs reversed downwards, structure broken
- Volumes strengthened at the moment of breakout
Tactical plan:
- Sell after retest of $3297
- Targets on the move: $3248 and $3201
- Stop: above $3305 (above the area of false outs).
The current structure indicates the end of the accumulation phase and the beginning of the downward momentum. As long as the price holds below $3297 - shorts are the priority.

US30 Scalp short Swing failure patternSwing failure pattern with bearish FVG, wait for bearish candle confirmation, liquidity below

AUDNZD new bullish expected
OANDA:AUDNZD price on trend line, above is ASCENDING TRIANGL, currently is breaked, 1.08000 crucial zone breaked, price pushing strong bullish and technically how looks, its for expect still bullish.
SUP zone: 1.07950
RES zone: 1.09400

Symmetrical Triangle in EURCHF —Fundamental & Technical AnalysisToday, I want to examine the EURCHF ( FX:EURCHF ) Short position opportunity from both a Fundamental and Technical perspective.
First, let’s examine the EURCHF pair from a fundamental perspective:
The ECB’s dovish policy stance and weakening Eurozone data contrast sharply with the Swiss Franc’s safe-haven appeal and economic stability. With geopolitical tensions in the background, EURCHF may continue to slide lower, supporting short positions.
In terms of technical analysis , EURCHF is moving near a Heavy Resistance zone(0.967 CHF-0.940 CHF) .
In terms of Classical Technical Analysis , EURCHF is moving inside a Symmetrical Triangle Pattern . The point to note about this example is that every time EURCHF approaches the upper lines of the symmetrical triangle , it starts to decline with a lot of momentum . And considering the previous movement of EURCHF, which was bearish, it is better to look for short positions from inside the symmetrical triangle.
Based on the above explanation , I expect EURCHF to move back towards the lower lines of the symmetrical triangle pattern .
Note: Stop Loss(SL): 0.94120 CHF
Please respect each other's ideas and express them politely if you agree or disagree.
Euro/Swiss Franc Analyze (EURCHF), 4-hour time frame.
Be sure to follow the updated ideas.
Do not forget to put a Stop loss for your positions (For every position you want to open).
Please follow your strategy and updates; this is just my Idea, and I will gladly see your ideas in this post.
Please do not forget the ✅' like '✅ button 🙏😊 & Share it with your friends; thanks, and Trade safe.

NETSOL Long term targetsLong term targets for NETSOL once it breaks out the triangle are listed in chart. You can take it either as Fib 1.618 or the price arrow top as your targets.

Bitcoin setup: bearish for now but watch Trump’s crypto deadlineBitcoin is sliding, and the technicals point lower with clear RSI divergence and a possible descending triangle. But this could all change fast. Trump’s crypto working group is set to propose major changes by 23 July. If the news points to deregulation or a return of ICOs, Bitcoin could explode higher. In this video, we break down the chart, the risks, and the potential trigger that could flip sentiment overnight.
This content is not directed to residents of the EU or UK. Any opinions, news, research, analyses, prices or other information contained on this website is provided as general market commentary and does not constitute investment advice. ThinkMarkets will not accept liability for any loss or damage including, without limitation, to any loss of profit which may arise directly or indirectly from use of or reliance on such information.

40–50% Decline Possible for Crude OilLight Crude Oil Futures broke below a descending triangle and re-tested the breakdown level on volume twice as high as the 50 day moving average (daily chart). I anticipate a 40–50% decline to approximately $30–40 over the next 6–12 months, despite geopolitical tensions in the Middle East. This move aligns with a broader macro correction. Long-term, I remain bullish on oil.

Gold. Path toward <3000. 1/July/2025XAUUSD, will gold reach ATH soon or below 3000 first?.. Based on cycle analysis and wave structure 50-50, make your own trading decision...

GOLD → Recovery and retest of resistance. DowntrendFX:XAUUSD has been recovering since the start of the session thanks to a weak dollar, but further growth is uncertain. However, the price is still below the key range and important levels.
At the beginning of the week, gold rebounded from monthly lows amid a weakening US dollar, which remains under pressure due to trade disputes with Japan, uncertainty surrounding the budget, and expectations of a Fed rate cut in September.
However, the technical picture for gold remains bearish, and further dynamics will depend on new statements from Fed officials, labor market data, and Jerome Powell's speech on Tuesday.
Technically, after breaking through the global range support, the price is forming a correction and testing 3294. Before a possible rise to 3320 or to the 0.7 Fibonacci zone, a correction to 3271 may form, which will determine the further development of the situation.
Support levels: 3271, 3255, 3245
Resistance levels: 3294, 3320, 3347
A retest of 3295 (0.5) Fibonacci is forming. There is a possibility of a false breakout with a possible correction. If, during the correction, buyers keep the price above 3271 and return to retest 3294, we will have a chance to attempt growth to 3320 - 3347
Best regards, R. Linda!

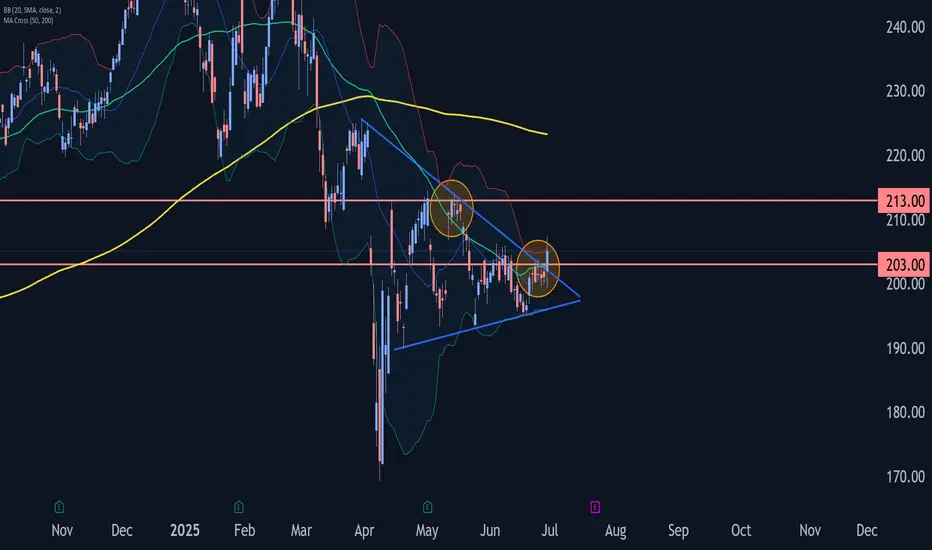
Apple Wave Analysis – 30 June 2025
- Apple broke resistance zone
- Likely to rise to resistance level 213.40
Apple recently broke the resistance zone between the resistance level 203.00 (which has been reversing the price from the start of June) and the resistance trendline of the daily Triangle from March.
The breakout of this resistance zone should add to the bullish pressure on Apple.
Apple can be expected to rise to the next resistance level 213.40, which reversed the previous waves (A), (C) and (2), as can be seen below.
$BSX VCP-style ascending triangleBoston Scientific (BSX)
Pattern
VCP-style ascending triangle. Three higher lows have squeezed price against the 108 ceiling while volume dries up each contraction.
Trigger & Risk Plan
• Buy-stop: 108.15 on ≥150 % average volume
• Stop: 102.00 (handle low / rising trend-line)
• Starter size only; add 25 % more if price closes above 110.50 the same day.
Reward Map
Measured triangle target 118 — followed by the cup-handle projection near 124-129 if momentum really kicks.
Why I Like It
• Relative strength already outperforming XLV and SPX.
• Medical-device peers SYK and MDT quietly firming — sector tailwind.
• “Overbought” RSI is a feature, not a bug, right before real breakouts.

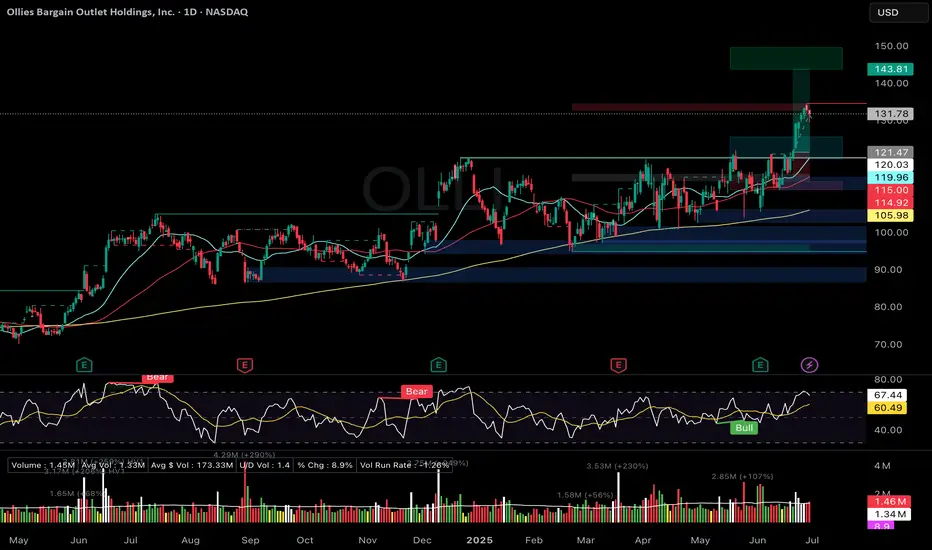
Case Study: Banking a +7 % Pop on OLLI’s VCP/ Ascending TriangleMomentum in discount retail has been stealth-strong all quarter, so when Ollie’s Bargain Outlet (OLLI) flashed a textbook volatility-contraction break I pulled the trigger. Below is the full play-by-play, numbers included, plus the process tweaks I’m carrying into the next trade.
1. The Setup
• Pattern: VCP-style ascending triangle under 121 resistance
• Context: Post-earnings drift sideways, volume drying up each contraction
• Catalysts: Strength across discounters (DG, WMT, DLTR) and bullish seasonality
• Risk: 1 % of account, stop pre-defined at 115
2. Execution
• 20 Jun – Stop-limit filled at 121.01 once intraday volume hit 2.6× ADV
• 24 Jun – Trimmed 3 sh at 129.13 (+6.7 %) to “feed the monster” and recycle BP
• 30 Jun – Trailing stop (ratcheted daily) closed remaining 7 sh at 129.94
3. Results
• Gross P&L: +86.89 USD, +7.18 % on position
• R-multiple: +1.45 R on initial risk
• Expectancy (TraderSync): +3.83 % — proof the process carries a positive edge
4. What Went Right
• Bought only after volume confirmed the breakout
• Stop never widened—only tightened
• Early partial locked in reward and removed emotional pressure
5. Improvement Plan
• Keep a 10 % “runner” until first close below 10-EMA or heavy distribution day
• Back-test a +25 % add on day-two follow-through (+2 % price, >1.5× volume)
• Simplify order flow by defaulting to single OCO brackets
NASDAQ:OLLI
NZDUSD → Pre-breakout consolidation. One step away from a rallyFX:NZDUSD is consolidating, but the chart shows signs of readiness to shift to a distribution phase, which could lead to a rally.
Against the backdrop of a falling dollar, which is continuing its main trend, the NZD may break out of consolidation in a distribution pattern. Since the accumulation is quite large (taking into account the long squeeze), the trend may be strong.
A pre-breakout consolidation is forming relative to 0.6080, followed by the price breaking through the resistance of the global trading range. Consolidation above 0.6080 will confirm the breakdown of the structure, which could trigger distribution
Resistance levels: 0.6080, 0.612
Support levels: 0.6062, 0.604
The price may be supported by a bullish trend and a decline in the dollar. A breakout from the 4-month consolidation may be accompanied by a continuation of the uptrend until the intermediate high of 0.6355 is reached in the medium term.
Best regards, R. Linda!

Navigating the ETH Volume Wall as Capital Rotates to High-Beta
In the intricate and often volatile theater of the cryptocurrency markets, Ethereum (ETH) currently finds itself in a moment of profound tension. As the undisputed king of smart contracts and the foundational layer for decentralized finance (DeFi), its price action sends ripples across the entire digital asset ecosystem. The current outlook presents a fascinating dichotomy: on one hand, Ethereum is staring down a formidable "volume wall," a dense zone of historical trading activity that acts as a powerful barrier to upward momentum. On the other hand, the tantalizing prospect of a decisive breakout above the key $2,900 level beckons, promising a new leg up for the bull market.
This standoff has created a fertile ground for a classic market phenomenon: capital rotation. As Ethereum grinds sideways, battling for every percentage point against heavy resistance, impatient capital is beginning to flow into more nimble, higher-risk assets within its orbit. Traders and investors are increasingly eyeing "cheap crypto"—smaller, more volatile altcoins built on or related to the Ethereum network. These "ETH beta" plays are rallying in anticipation of an eventual Ethereum breakout, offering the potential for outsized returns.
This comprehensive analysis will dissect the complex dynamics shaping Ethereum's current price outlook. We will explore the nature of the heavy volume wall that is capping its ascent and the strategic implications of the resulting price range. We will then delve into the mechanics of capital rotation, examining why traders are turning to lower-cap altcoins as a proxy for Ethereum's future success. Finally, we will weigh the bullish and bearish cases, charting the potential path to a $2,900 breakout while acknowledging the significant risks that could invalidate the optimistic thesis. For investors and market observers, understanding this intricate dance between consolidation, rotation, and breakout potential is paramount to navigating the next chapter in Ethereum's journey.
Part 1: The Great Wall of Ethereum - Deconstructing the Heavy Volume Range
To understand Ethereum's current struggle, one must first grasp the concept of a "volume wall." This is not a literal barrier, but a powerful technical and psychological construct visible on a price chart. It represents a price range where an unusually high volume of tokens has changed hands in the past. This area of high trading concentration becomes a major point of contention for future price movements, acting as a powerful magnet for both support and, in this case, resistance.
What is a Volume Wall and Why Does It Form?
A volume wall is best visualized using an indicator like the Volume Profile Visible Range (VPVR). Unlike traditional volume bars at the bottom of a chart that show volume per unit of time, the VPVR displays it horizontally, showing volume per price level. A large, protruding bar on the VPVR signifies a "High-Volume Node" (HVN), which is the technical term for a volume wall.
These walls form for several key psychological reasons:
1. Breakeven Sellers ("Bagholders"): A significant number of market participants may have bought ETH within this price range during a previous rally. When the price fell, they were left holding at a loss. Now, as the price returns to their entry point, their primary emotion is relief. Their goal is not to make a profit, but simply to exit their position at breakeven. This creates a steady stream of sell orders as the price enters the high-volume zone.
2. Strategic Profit-Takers: Investors who bought Ethereum at much lower prices see this high-volume area as a logical and predictable place to take profits. They recognize it as a zone of contention and potential reversal, making it an opportune moment to sell a portion of their holdings and de-risk.
3. Opportunistic Short-Sellers: Traders who are bearish on Ethereum view the volume wall as a high-probability area for the price to be rejected. They will strategically place short-sell orders within this range, adding to the selling pressure and betting on a move back down.
When these three forces converge, they create a formidable supply zone that can absorb a tremendous amount of buying pressure. For Ethereum to break through, it requires a catalyst strong enough to overwhelm this confluence of sellers.
Identifying Ethereum's Current Range
For the purpose of this analysis, let's assume this heavy volume wall for Ethereum is situated roughly between $2,750 and $2,850. This range becomes a battleground. When the price enters this zone, it often loses momentum and begins to move sideways in a "chop," characterized by volatile price swings without a clear direction.
The implications of being trapped below such a wall are significant. The market enters a state of consolidation or ranging. This means that for the time being, the explosive, directional trend is on pause. Bulls and bears are locked in a battle for control, and until one side emerges victorious, the price will likely remain contained. This period of consolidation, while frustrating for trend-followers, is a critical phase where the market digests previous gains, flushes out weak hands, and builds energy for its next major move. The key question for every trader is which direction that move will be.
Part 2: The Rotation Game - Chasing Beta in a Sideways Market
When a market leader like Ethereum enters a prolonged consolidation phase, a fascinating secondary effect begins to take hold: capital rotation. Traders and investors, particularly those with shorter time horizons, grow impatient with the lack of volatility in the primary asset. Their capital seeks higher returns and more immediate action, leading them to rotate out of the ranging asset and into more speculative plays. In the context of the crypto market, this often means moving into "high-beta" altcoins.
Understanding "ETH Beta"
In traditional finance, "beta" measures an asset's volatility in relation to a benchmark, like the S&P 500. An asset with a beta of 1.5 is expected to move 1.5% for every 1% move in the benchmark. In cryptocurrency, Ethereum itself often acts as a benchmark for the broader altcoin market.
"ETH beta" refers to altcoins that are highly correlated with Ethereum's price but exhibit much higher volatility. These are typically smaller, newer, or more speculative projects within Ethereum's ecosystem. The logic behind the "ETH beta play" is straightforward:
• If you believe Ethereum will eventually break through its resistance wall and rally, you can simply buy and hold ETH.
• However, if you want to maximize potential returns, you can instead buy a high-beta altcoin. The thesis is that when ETH finally moves up 10%, this smaller altcoin might surge 30%, 50%, or even more.
This strategy is essentially a leveraged bet on Ethereum's success, but without using financial leverage like futures or options. The leverage comes from the inherent volatility of the smaller asset.
The Allure of "Cheap Crypto"
The rotation often targets what is colloquially known as "cheap crypto." This term doesn't necessarily mean the project is undervalued, but rather that its token has a low unit price (e.g., under $1 or even fractions of a cent). This has a powerful psychological appeal:
• Accessibility: It feels more accessible to buy 1,000,000 tokens of a memecoin for $1,000 than to buy a fraction of one ETH.
• Perceived Upside: The low unit price creates the perception of explosive growth potential. It's psychologically easier to imagine a token going from $0.01 to $0.10 (a 10x return) than it is to imagine ETH going from $2,800 to $28,000.
During Ethereum's consolidation, we would likely see this rotation manifest in several key sectors of its ecosystem:
• Layer 2 Solutions: Projects like Arbitrum (ARB), Optimism (OP), and Polygon (MATIC) are prime candidates. They are fundamentally linked to Ethereum's scalability and success, making them a direct beta play. As traders anticipate an ETH breakout, they will front-run the move by accumulating these L2 tokens.
• DeFi Blue Chips and Dapps: Protocols for lending, borrowing, and trading, such as Uniswap (UNI), Aave (AAVE), or Lido (LDO), also fall into this category. Their usage and value are directly tied to the health of the Ethereum network.
• Memecoins and Newer Narratives: This is the highest-risk, highest-reward end of the spectrum. Memecoins built on Ethereum (like PEPE or SHIB) or on its Layer 2s can experience parabolic rallies based on pure speculation and social media hype, driven by the narrative that a rising ETH tide will lift all boats.
This rotation is a double-edged sword. While it signals underlying bullish conviction in the Ethereum ecosystem, it also diverts buying pressure away from ETH itself, potentially prolonging the consolidation phase. However, it is a clear sign that the market is positioning for an eventual breakout.
Part 3: The Bull Case - Charting a Path to the $2.9K Breakout
Despite the formidable resistance, a powerful bull case for Ethereum is building, suggesting that a breakout above the $2,900 level is not a matter of if, but when. This optimism is rooted in a combination of bullish technical patterns, strengthening on-chain fundamentals, and a powerful external narrative.
The Technical Setup for a Breakout
While the price may be moving sideways, a closer look at the chart often reveals underlying strength building beneath the surface. Several technical patterns and indicators could signal an impending breakout:
• Ascending Triangle Formation: A classic bullish pattern. This would be characterized by the price making a series of higher lows while being capped by the horizontal resistance of the volume wall (around $2,850-$2,900). The higher lows indicate that buyers are becoming more aggressive on each dip, squeezing the price upwards against the resistance. A breakout from the top of this triangle would be a powerful technical signal.
• Bullish Engulfing or Hammer Candlesticks: The appearance of strong bullish candlestick patterns at key support levels below the range would indicate that buyers are stepping in with force, absorbing selling pressure and defending the uptrend.
• Resetting Momentum Oscillators: During a consolidation phase, indicators like the Relative Strength Index (RSI) will cool off from "overbought" levels. If the RSI can reset back to neutral territory (around 50) while the price remains stable, it suggests the market is building up energy for another push higher without being overextended. A "hidden bullish divergence," where the price makes a higher low while the RSI makes a lower low, would be an even stronger signal of trend continuation.
• Support from Key Moving Averages: For the bull case to remain intact, Ethereum's price must hold above critical long-term moving averages, such as the 50-day and 200-day Simple Moving Averages (SMAs). These levels often act as dynamic support, and successful bounces from them reinforce the underlying bullish trend.
Fundamental and On-Chain Catalysts
Beyond the charts, Ethereum's fundamental health provides a strong tailwind for a potential rally:
• The Spot Ether ETF Narrative: The single most powerful potential catalyst on the horizon is the approval of a spot Ether ETF in the United States. Following the monumental success of the Bitcoin ETFs, the market anticipates that an Ether ETF would unlock a similar torrent of institutional capital. This narrative alone is enough to encourage accumulation, as investors look to position themselves ahead of a potential approval. Any positive news or regulatory progress on this front could provide the immense buying pressure needed to shatter the volume wall.
• Deflationary Supply Dynamics (The Burn): Thanks to the EIP-1559 upgrade, a portion of every transaction fee on Ethereum is "burned," or permanently removed from circulation. During periods of high network activity, this can make ETH a deflationary asset, meaning more coins are being destroyed than created. This programmatic scarcity is a powerful long-term value driver that makes holding ETH more attractive.
• The Growth of the Layer 2 Ecosystem: The success of Layer 2 solutions like Arbitrum and Optimism is not a threat to Ethereum but a testament to its success. These networks bundle transactions and settle them on the Ethereum mainnet, increasing its overall throughput and utility. A thriving L2 ecosystem drives demand for ETH as the ultimate settlement and data availability layer, strengthening its fundamental value proposition.
• Staking and Supply Sinks: A significant and growing portion of ETH's total supply is locked up in staking contracts to secure the network. This staked ETH is effectively removed from the liquid, circulating supply available for sale on exchanges. This continuous supply reduction creates a "supply shock" dynamic, where even a moderate increase in demand can have an outsized impact on the price.
When these technical and fundamental forces align, they create a powerful case that the consolidation phase is a temporary pause before the next major uptrend. A decisive break and close above $2,900 would liquidate short positions, trigger FOMO (Fear Of Missing Out) buying, and likely signal the start of a rapid move towards the next major psychological and technical target, potentially $3,500 or higher.
Part 4: The Bear Case and Prevailing Risks
A balanced analysis requires acknowledging the significant risks that could invalidate the bullish thesis. The volume wall is formidable for a reason, and a failure to break through could lead to a sharp reversal. Several factors could contribute to a bearish outcome for Ethereum.
Rejection at the Wall
The most immediate risk is a decisive rejection from the volume wall. If buying pressure wanes and sellers take firm control within the $2,750-$2,850 range, it could signal a local top. This would likely be confirmed by a break below the recent series of higher lows and key moving averages. Such a rejection could trigger a cascade of stop-loss orders from long positions, accelerating a move downwards to retest lower support levels, potentially in the $2,400-$2,500 range.
Macroeconomic Headwinds
As a major global asset, Ethereum is not immune to the broader macroeconomic environment. A "risk-off" sentiment sweeping through traditional markets would almost certainly impact crypto. Factors that could trigger this include:
• Hawkish Central Bank Policy: Unexpectedly high inflation data could force central banks like the Federal Reserve to maintain high interest rates for longer, or even signal further hikes. This "tight liquidity" environment is generally negative for risk assets like cryptocurrencies.
• Geopolitical Instability: An escalation of global conflicts can cause investors to flee to perceived safe havens like the US dollar or gold, pulling capital away from more speculative markets.
• Recessionary Fears: Signs of a weakening global economy could dampen investor appetite for risk, leading to broad-based selling across asset classes.
Regulatory Uncertainty
Regulatory risk remains a persistent cloud over the entire crypto industry, and Ethereum is at the center of a key debate. The U.S. Securities and Exchange Commission (SEC) has not definitively clarified whether it views ETH as a commodity (like Bitcoin) or a security. A negative ruling, or even prolonged legal battles suggesting it will be classified as a security, could have a chilling effect on the market. It would create significant compliance hurdles for exchanges and could derail the spot Ether ETF narrative entirely. Any negative headline on this front could be the catalyst that turns the volume wall from a temporary obstacle into an impenetrable ceiling.
Competitive Pressures
While Ethereum remains the dominant smart contract platform, it faces ever-growing competition from other Layer 1 blockchains (often dubbed "ETH Killers") like Solana, Avalanche, and others. These platforms boast high transaction speeds and low fees and are constantly vying for market share in the DeFi and NFT spaces. While a multi-chain future is the most likely outcome, a significant migration of developers and users away from Ethereum to a competitor could erode its network effect and negatively impact its long-term valuation.
Conclusion: A Pivotal Moment of Decision
Ethereum stands at a critical juncture, a crossroads where powerful bullish and bearish forces are locked in a tense equilibrium. The price is pinned against a heavy volume wall, a technical barrier representing the collective memory of the market. This has forced the asset into a period of consolidation, a sideways grind that is testing the patience of even the most steadfast bulls.
This very consolidation is fueling a secondary narrative of capital rotation, where traders, anticipating an eventual breakout, are channeling funds into higher-volatility "ETH beta" plays. The rallies in Layer 2 tokens and other ecosystem projects are a vote of confidence in Ethereum's future, a sign that the market is positioning for upside. The fundamental picture, bolstered by the potential of a spot ETF, deflationary supply mechanics, and a thriving ecosystem, provides a strong foundation for the bull case. The path to a $2,900 breakout seems not only possible but plausible.
However, the risks are undeniable. A failure to breach the wall could lead to a sharp correction, exacerbated by potential macroeconomic headwinds or negative regulatory surprises. The outcome of this battle will be pivotal. A successful breakout would reaffirm Ethereum's market leadership and likely kickstart a new wave of adoption and price appreciation across the entire altcoin space. A rejection would signal a deeper correction and a longer period of uncertainty. For now, the market holds its breath, watching the wall, waiting for the rotation to culminate, and anticipating the decisive move that will set the tone for the months to come.

Euro will make correction to support line of channelHello traders, I want share with you my opinion about Euro. In this chart, we can see how the price entered to triangle, where it at once bounced from the support line and rose to the 1.1100 support level, which coincided with the buyer zone. Soon, price broke this level, after a small correction, and continued to move up to the 1.1575 current support level, which coincided with the support area. This area also coincided with the resistance line of the triangle, and the Euro rebounded from this line and started to decline. In a short time, it declined to the buyer zone, where it turned around and started to move up. Soon, Euro exited from triangle and continued to rise inside an upward channel, where it made a correction first and then continued to grow. Later, EUR rose to 1.1575 current support level, one more time and even almost broke it, but failed and corrected. But soon, it finally broke this level and rose to the resistance line of the channel, where at the moment it continues to trade near. In my mind, Euro will rebound from this line and go to the correction until to support line of the channel, breaking the support level. For this case, my TP is located near this line - at the 1.1490 points. Please share this idea with your friends and click Boost 🚀
Disclaimer: As part of ThinkMarkets’ Influencer Program, I am sponsored to share and publish their charts in my analysis.

Brent crude: why I'm not trading oil right nowBrent crude surged earlier this month on war headlines, and our trade setups nailed the moves. But right now, the market offers no edge. Volatility is fading and price is stuck in a large triangle. Unless you have geopolitical insight, there's no clear reason to trade. In this video, I explain why I'm staying out and what I’ll look for next.
This content is not directed to residents of the EU or UK. Any opinions, news, research, analyses, prices or other information contained on this website is provided as general market commentary and does not constitute investment advice. ThinkMarkets will not accept liability for any loss or damage including, without limitation, to any loss of profit which may arise directly or indirectly from use of or reliance on such information.
