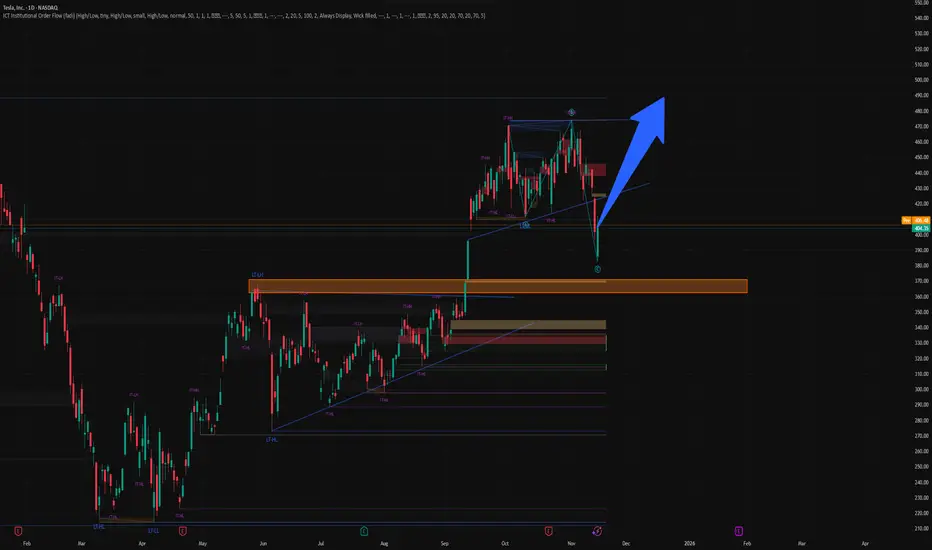
Tesla - The next bullrun is coming!🚗Tesla ( NASDAQ:TSLA ) is clearly breaking out:
🔎Analysis summary:
In mid 2025, Tesla perfectly retested a major confluence of support. After Tesla then created bullish confirmation, the recent strong rally was totally expected. And with the current triangle breakout, Tesla is just starting its next major parabolic rally much higher.
📝Levels to watch:
$400 and $600
SwingTraderPhil
SwingTrading.Simplified. | Investing.Simplified. | #LONGTERMVISION
Tslaanalysis

Tesla (TSLA) Shares Close at a Record HighTesla (TSLA) Shares Close at a Record High
On Tuesday, 16 December 2025, Tesla shares closed at a new all-time high, breaking above the $488 level.
As a result, TSLA:
→ surpassed its December 2024 peak;
→ is up by roughly 125% from this year’s lows;
→ made Elon Musk the first person in the world whose net worth has exceeded $600 billion.
Why are TSLA shares rising?
Elon Musk has officially confirmed that Tesla has begun testing driverless robotaxis in Austin, Texas, without safety monitors in the vehicle. This marks an important step towards the large-scale deployment of the Robotaxi concept.
Despite a decline in electric vehicle sales in November (following the removal of tax incentives by the new US administration), TSLA shares continue to rise as market participants are pricing in Tesla’s potential dominance in artificial intelligence and autonomous transport — a development that could unlock fundamentally new revenue streams for the company.
Supporting this outlook, several investment banks have raised their price targets for TSLA. For instance, Mizuho analysts lifted their target to $530.
Technical perspective
When analysing TSLA on 12 November, we:
→ identified an ascending channel and a support zone between $360 and $400;
→ suggested that the previous high was limiting bullish momentum, with the market entering a consolidation phase.
Since then (as shown by the blue arrow), TSLA shares:
→ broke out of the consolidation zone;
→ found support near the lower boundary of the ascending channel;
→ resumed their upward trend.
It is worth noting that trading volumes in early December were relatively low — which can be interpreted as a lack of selling pressure. However, the subsequent move into the upper half of the channel was accompanied by a surge in trading activity and the formation of a bullish gap (marked by the black arrow). This signals strong demand, with buyers willing to pay higher prices for a high-quality stock.
Looking ahead, it is possible that:
→ the former resistance at $465 will turn into a new support zone;
→ the current bullish impulse could drive attempts to challenge the psychological $500 level.
This article represents the opinion of the Companies operating under the FXOpen brand only. It is not to be construed as an offer, solicitation, or recommendation with respect to products and services provided by the Companies operating under the FXOpen brand, nor is it to be considered financial advice.

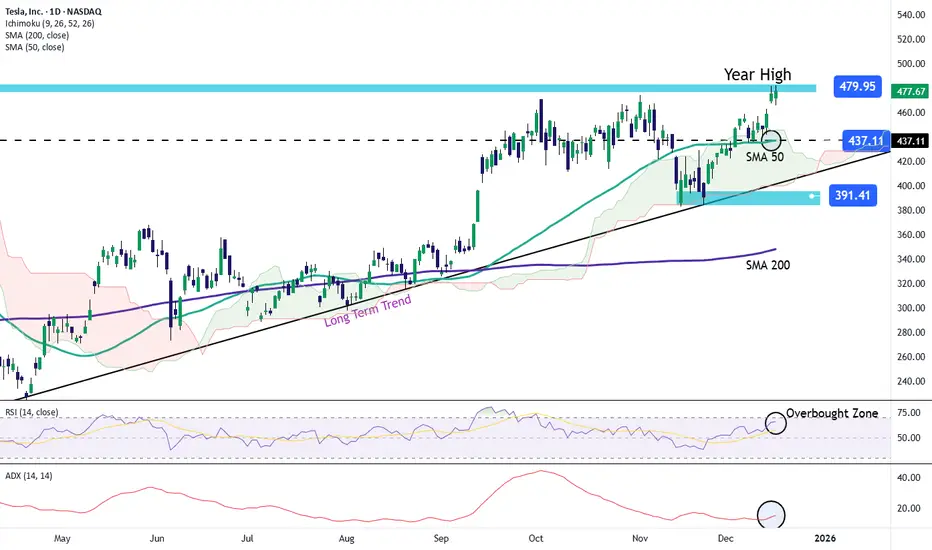
Tesla Stock Holds Strength and Breaks Above Yearly HighsTesla’s stock has achieved a streak of three consecutive bullish sessions, recording a gain of more than 5% over that period. For now, buying pressure has remained firm following recent announcements indicating that the company has confirmed unsupervised robotaxi testing, a development that could mark a significant milestone in Tesla’s autonomous vehicle program and become a project with major long-term impact. This announcement has reinforced confidence in the stock in recent sessions and may continue supporting consistent buying pressure in the coming days.
Long-Term Uptrend Remains Intact
It is important to remember that Tesla’s bullish movements have maintained a consistent upward trend since April of this year. In recent sessions, buying pressure has strengthened again, even pushing the price toward the 480-dollar zone — a level not seen consistently since December 2024.
If buying pressure remains stable in the short term, the long-term uptrend could continue dominating Tesla’s price action toward year-end. However, it is also important to consider that confronting current highs may create room for short-term bearish corrections.
RSI
At the moment, the RSI line continues to oscillate above the neutral 50 level, indicating that buying momentum still dominates short-term price action. However, the RSI is now approaching the overbought zone (70), which may signal a potential imbalance in momentum and open the door for short-term pullbacks.
ADX
The ADX line remains below the 20 level, suggesting a period of neutrality in average volatility over the last 14 sessions. This indicates that unless a stronger directional move occurs in the short term, a phase of persistent indecision may continue, potentially leading to temporary bearish corrections.
Key Levels to Watch:
480 dollars – Crucial resistance:
A level not seen since 2024 and a major high for 2025. Sustained buying above this level could reinforce the bullish bias and potentially push the price toward the psychological 500-dollar mark.
437 dollars – Nearby support:
This level aligns with the 50-period moving average and may act as initial support should short-term bearish corrections occur.
391 dollars – Final support:
This level corresponds to recent lows. A pullback toward this zone could reactivate a bearish bias and put the current bullish structure at risk.
Written by Julian Pineda, CFA, CMT – Market Analyst
Is Tesla Setting Up for a Rebound? Key Entry Levels Inside🎯 TSLA: The "Thief Strategy" Playbook | Swing/Day Trade Setup 📈
🔥 Quick Overview
Asset: Tesla, Inc. (TSLA)
Bias: 🐂 BULLISH
Strategy Type: Thief Layering Entry Method
Risk Level: Medium-High (Swing/Day Trade)
💰 The "Thief" Entry Strategy Explained
The "Thief Strategy" uses multiple limit orders (layering method) to accumulate position at different price levels. Think of it like setting traps at various floors of a building—you catch opportunities wherever price decides to visit! 🎣
📊 Entry Zones (Layer Your Orders):
Layer 1: $430.00
Layer 2: $435.00
Layer 3: $440.00
💡 You can add more layers based on your own risk appetite and account size. The beauty of layering? You average your entry and reduce timing risk!
🛡️ Stop Loss (SL):
Thief SL: $415.00
⚠️ Important Note: This is MY stop loss level based on the Thief Strategy framework. You're the captain of your own ship! 🚢 Adjust your SL based on YOUR risk tolerance and account management rules. Trade at your own risk—make money, take money, manage wisely!
🎯 Target (TP):
Primary Target: $490.00
🚨 Why $490? This zone represents a confluence of:
Strong resistance area
Potential overbought conditions
Historical trap zone where bulls get exhausted
📢 Thief OG's Reminder: I'm NOT saying you MUST take profit only at my TP level. If you see profits that make you smile, SECURE THEM! 💵 The market gives, and the market takes. Be greedy when you can, be smart always.
🔍 Technical Analysis Breakdown
Tesla is showing bullish momentum structure with potential for continuation toward the $490 resistance zone. The layering strategy allows us to build position as price potentially dips into demand zones before the next leg up.
Key Technical Levels:
Support Zone: $430-$440 (Our entry layers)
Invalidation: Below $415 (Stop loss)
Resistance Target: $490
📌 Related Pairs to Watch (Correlation Play)
Understanding correlated assets helps confirm your thesis:
AMEX:SPY (S&P 500 ETF)
TSLA often moves with broader market sentiment
Watch SPY for overall risk-on/risk-off environment
NASDAQ:QQQ (Nasdaq 100 ETF)
Tech-heavy index where TSLA is a major component
Strong correlation with TSLA price action
NASDAQ:NVDA (NVIDIA)
Both are high-beta tech growth stocks
Often move together during risk appetite shifts
TVC:DXY (US Dollar Index)
Inverse correlation: Strong dollar = pressure on growth stocks like TSLA
Weak dollar = tailwind for equities
💡 Key Point: If SPY/QQQ are bullish + DXY weakening = Strong confirmation for TSLA upside!
⚡ Trading Tips for Thief OG's
Don't FOMO — Let price come to your layers
Manage position size — Each layer should be equal weight
Trail your stop — Once profitable, protect gains
Watch volume — Confirm breakouts with volume spikes
Stay flexible — Market conditions change; so should you!
🎬 Final Words
This setup is all about patience, precision, and profit extraction! 🎯 The Thief Strategy isn't about stealing from the market—it's about being SMART and setting yourself up for success with calculated entries.
Remember: The best trades are the ones where you're prepared, not scared! 😎
✨ If you find value in my analysis, a 👍 and 🚀 boost is much appreciated — it helps me share more setups with the community!
#TSLA #TeslaStock #SwingTrading #DayTrading #ThiefStrategy #LayeringStrategy #StockMarket #TradingIdeas #TechnicalAnalysis #BullishSetup #TradingStrategy #RiskManagement #StockTrading #MarketAnalysis #TradingCommunity

Tesla - The triangle is still valid!🎀Tesla ( NASDAQ:TSLA ) can still confirm the breakout:
🔎Analysis summary:
Just two months ago, Tesla perfectly broke out of the major ascending triangle pattern. In the meantime we just witnessed a major consolidation at the all time high. Quite likely that Tesla will soon confirm the breakout, launching another parabolic rally from here.
📝Levels to watch:
$400
SwingTraderPhil
SwingTrading.Simplified. | Investing.Simplified. | #LONGTERMVISION

Tesla Reversal Signal Triggered at the 200 SMA!TSLA 🚗 Bullish Pullback Playbook — Smart Layered Entry Setup!
📈 Asset:
TSLA — Tesla Inc. (NASDAQ)
Swing Trade Playbook | Trend-Continuation Setup
🧠 Market Thesis
TSLA shows a bullish pullback into the 200-Day Simple Moving Average, a level historically respected by trend-followers. The latest Heikin-Ashi Doji Reversal signals buyers regaining momentum ⚡ — suggesting the pullback is stabilizing and demand is stepping back in.
This combination of trend support + reversal confirmation forms the core of this structured swing setup.
🎯 Plan Overview
A clean bullish continuation strategy using a refined layered entry method (professionally framed as “scaled limit entries”). This maintains your signature thief-style energy, but aligned with TradingView rules and presentation standards. 😎
🟢 Entry Plan (Layered / Scaled Limit Orders)
Using a scaling approach allows better average pricing during volatility.
Proposed buy-limit layers:
Buy Limit 1 → $420.00
Buy Limit 2 → $410.00
Buy Limit 3 → $400.00
👉 Traders may increase or reduce the number of layers based on risk tolerance and personal strategy.
🔻 Stop-Loss (Risk Control)
A defensive stop-loss is placed near $380.00, below recent liquidity pockets and under the 200 SMA structure.
⚠️ This level is optional — traders should select their own SL based on personal risk management.
🎯 Take-Profit Zone
Target area sits around $470.00, where:
Major historical resistance awaits
Overbought conditions often develop
High-volume sellers tend to re-enter
This zone is treated as a profit-taking escape point, but traders can exit based on their own judgment.
📡 Related Markets to Watch (Correlation Insight)
Keeping the global view helps improve trade confidence:
NASDAQ:QQQ — High correlation with mega-cap tech, TSLA often follows Nasdaq momentum.
NASDAQ:NDX — Strong tech index correlation; strength supports TSLA continuation.
SP:SPX — Broad-market risk sentiment gauge.
NASDAQ:NVDA / NASDAQ:AMD — Momentum flow in growth-tech impacts liquidity rotation into TSLA.
AMEX:XLY — Consumer Discretionary ETF (TSLA is a major component).
Key takeaway:
Strong tech-sector momentum + risk-on environment = enhanced TSLA bullish continuation probability 📊⚡
🧰 Notes for the Community
Dear Traders (Thief OG-style Family 😄) —
SL/TP levels shared here are only examples for educational purposes. You’re always free to manage your own positions using your own risk preferences. Trade smart, trade safe, trade stylish. 💼✨
✨ “If you find value in my analysis, a 👍 and 🚀 boost is much appreciated — it helps me share more setups with the community!”
This is a thief-style trading strategy presentation strictly for fun and educational purposes. Not financial advice.
#TSLA #Tesla #SwingTrade #BullishSetup #LayeredEntries #HeikinAshi #200SMA #NASDAQ #MomentumTrading #TechnicalAnalysis #TradingView #RiskManagement #TraderLifestyle #StockMarket

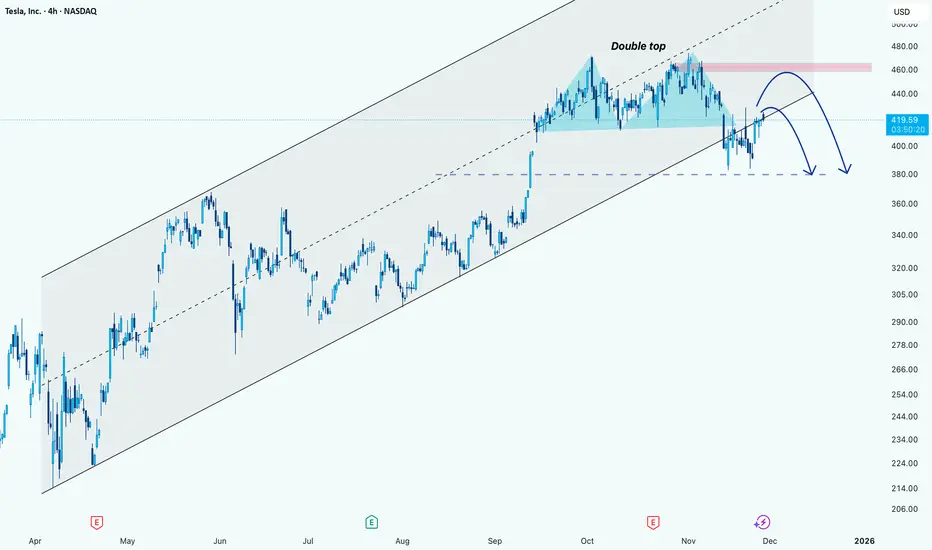
Tesla: A overview of itHi!
Trend Analysis:
TSLA has been trading in an ascending channel for several months, with higher highs and higher lows visible since April.
The recent price action broke above the midline of the channel but is currently consolidating near the $420-$425 area.
Pattern Formation:
A Double Top pattern near the $460 level formed.
This pattern signals a potential reversal if the price fails to break above the resistance zone (marked in pink).
The neckline of this double top appears around $400, which is also a key support zone.
Potential Price Action:
Short-term rebound:
TSLA could retest the resistance zone near $455-$460.
If it fails to break this area convincingly, the double top pattern could trigger a reversal.
Medium-term correction:
If the reversal occurs at the resistance zone, price may fall toward the neckline/support area near $380.
This aligns with the lower boundary of the channel and previous support levels.
TESLA IS ENTERING A CRITICAL ZONETesla currently remains in an uptrend while moving inside the existing ascending channel. The most recent reaction came from the trendline, but an important structure has formed above: a clear double top pattern . After the pattern completed, price declined and is now retesting the neckline, which has already acted as resistance. The 50 EMA is also positioned at this same level, adding confluence.
According to the mechanics of the double top, the expected downward projection is typically equal to the distance between the top of the pattern and the neckline. That measured move aligns almost perfectly with the lower support zone and the 200 EMA , forming a strong confluence area.
Additionally, there is an imbalance inside that lower region, which commonly pulls price back to fill it. RSI has formed a downtrend and is moving toward the 30 level, which supports the likelihood of a continued decline.
If price breaks above both the RSI downtrend and the neckline, the move back upward along the channel becomes possible. However, the bearish confirmations remain strong unless a significant positive catalyst invalidates the setup.

Tesla - Withstanding all weakness!🏹Tesla ( NASDAQ:TSLA ) can still break out:
🔎Analysis summary:
Since Tesla was listed on the Nasdaq back in 2013, we witnessed a lot of triangle breakouts. And starting all the way back in 2020, Tesla once again created a bullish triangle. Last month we saw the breakout and this month we have to see the confirmation
📝Levels to watch:
$400
SwingTraderPhil
SwingTrading.Simplified. | Investing.Simplified. | #LONGTERMVISION

TSLA: Wave 4 or Explosive Momentum – Get Ready for a Big MoveTSLA: Wave 4 or Explosive Momentum – Get Ready for a Big Move
📈 Weekly Scenarios
Bullish scenario:
The price holds the $436–$449 zone, ending the correction with wave 4.
Breaks above $470–$471, triggering wave 5 → target of $488–$505+.
Consolidation:
The price is in the $436–$471 range, without a clear breakout, preparing for the next impulse.
Bearish scenario:
Breakthrough of support at $425–$397 → possible reversal or deep correction instead of growth.
✅ Conclusion
Tesla is at an important wave crossroads – it either completes the correction and prepares for a strong rally, or reverses downward.
Key points to watch: $436–$449 (correction support) and $470–$471 (resistance breakout).
Confirmation of the wave structure and price reaction at these levels will be critical for making trading decisions.
Stop Overcomplicating Trading: The Consistency Blueprint No One Stop Overcomplicating Trading: The Consistency Blueprint Nobody Wants to Talk About
Two decades in the market have taught me a very real truth:
Profit isn’t about being the smartest or catching the breakout. It’s about showing up for yourself every week; especially when motivation disappears and the trades get hard.
I’ve been at this 20 years; through bull runs, ugly drawdowns, burnout, and those quiet Sunday reviews where nothing made sense. The only thing that’s kept me in the game and steadily profitable? Building ultra-simple consistency habits that actually fit my life.
Let me give it to you straight: here’s how to move the needle, no matter where you are:
Forget perfection. Track what REALLY matters.
For most, it’s not a magic strategy—often it’s reviewing trades, keeping promises to yourself, and taking care of your brain and sleep before the next setup.
Pick 2-3 metrics and make them sacred:
For me, it’s weekly trade review, a “focus” score for my setups, and legit sleep tracking. I only look at these, period.
Make review time non-negotiable:
I set aside 20 min a week, never skipped. It’s my reset button after wins and losses.
Write out quick wins & lessons—immediately after they happen.
Let the good trades teach you, but also let the ugly ones humble you and anchor your next week.
Adapt your process to real life:
Swing trading while working? Happens. Family? Kids? You can STILL win long-term—just make the review and tracking match your schedule, not some internet hustle template.
Build the feedback loop
When you slip, note it fast and tweak (don’t obsess). When you nail it, reward yourself—not with risk, but acknowledgment.
How do you know it works? Because it’s kept me in profit while teaching hundreds of traders to turn routines into actual results.
If you’re battling for consistency DM me “Tools” or drop it in the comments. I’ll send my simple routines that changed the game for me and dozens of traders.
Let’s build consistency that lasts and celebrate small wins relentlessly.
If I can help, I will.
Tesla - Here comes the third breakout!🚀Tesla ( NASDAQ:TSLA ) is finally breaking out:
🔎Analysis summary:
For the past four years, Tesla has been trading in a very clear ascending triangle pattern. But just last month, we finally saw the expected bullish triangle breakout. Considering all of the previous triangle breakouts, Tesla is setting up for another parabolic rally soon.
📝Levels to watch:
$450
SwingTraderPhil
SwingTrading.Simplified. | Investing.Simplified. | #LONGTERMVISION

TESLA PT-2 TRILLION DOLLAR PAY CHECKI hope everything is clear now. I have exited all positions here and I am not going into news.
Elon is not going to tell me where my money is going
NOTE:NOT TRADING TSLA

TESLA NOV 6 TRILLION DOLLAR PAY CHECKToday is the day for a lot of people with hope. Be careful & trade smartly.
I have explained the price action here.
YES I AM LONG
NOTE:IV IS HIGH SO STAY AWAY FROM OPTIONS

TSLA Triple TopTriple tops = market drop!
As soon as the market tanks, TSLA is in major trouble!
For 5 long years, people have been trying to pump this stock with no good results. Instead, they got a -75% decline and a -66% decline for their efforts.
This stock will fall bidless! All hype with no substance.
The question is, will the market stay up long enough to push it up one more time and sucker in the last fools before the kiss of death? We shall see!
It's now or never!
I am proudly shorting it! As I have successfully done twice before with huge gains. I am telling you, fanboys, point-blank before I get all the hate posts. ))

TSLA is going UP! .. time to buy!Tsla aka Tesla was stuck in-between 2 powerful support and resistance zones (the red and green lines) .. It finally broke to the upside and broke above the resistance level. It is now very likely to head to the next resistance zone which was the previous high (the next resistance zone has been drawn as the white line shown on the chart) - this is where we will be taking profit at. BUY NOW!

Tesla - The massive triangle breakout!🪩Tesla ( NASDAQ:TSLA ) is breaking out:
🔎Analysis summary:
Last month, we witnessed an incredible but expected rally of about +35% on Tesla. Furthermore, with this move Tesla is attempting to break above the previous all time highs. After bullish confirmation, this would also lead to a massive triangle breakout.
📝Levels to watch:
$400
SwingTraderPhil
SwingTrading.Simplified. | Investing.Simplified. | #LONGTERMVISION

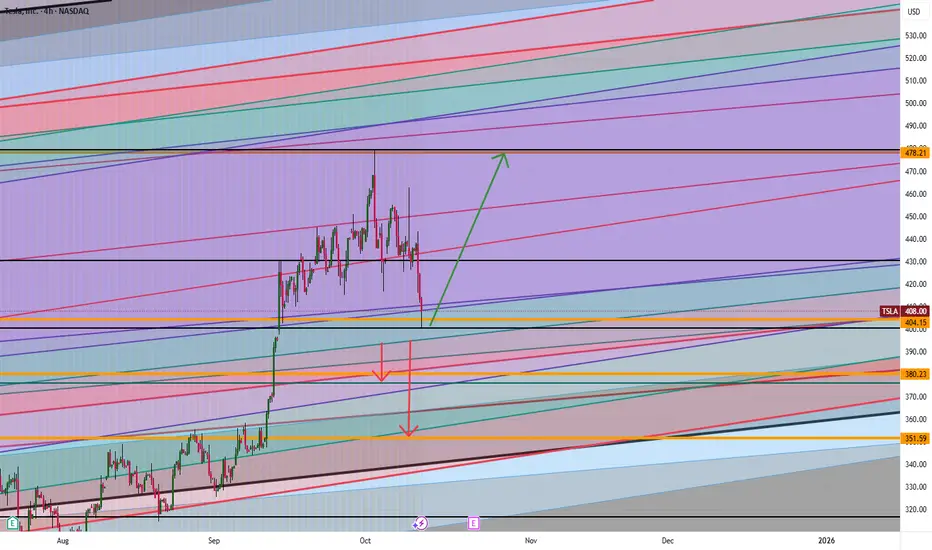
Tesla: Will It Blast Off or Fall Fast? The $404 Level Is the KeyTesla is at a big “make or break” point. If the price stays higher than $404, it could blast up to $437 or maybe even $478. But if Tesla drops below $404, watch out! It could fall down to $380 or even as low as $351.
Think about it:
What would you do if Tesla started moving toward those numbers? Do you think it will go up or will it go down?
If you’re not sure or have a question, send me a message! Sometimes asking one good question can help you make a smarter trade. What do you want to know about Tesla right now?
Mindbloome Exchange
Tesla reports Wednesday; analysts expect EPS of $0.55Tesla reports third-quarter earnings Wednesday after the close, with analysts expecting EPS of $0.55, down from $0.72 a year earlier, on revenue of $26.2B — up 4%. There’s room for an upside surprise after record Q3 deliveries of 497,099 vehicles, boosted by the now-expired $7,500 U.S. EV tax credit, which also trimmed inventories. Analysts will focus on Elon Musk’s plans for robotaxi scaling, autonomy progress, and upcoming models through 2026, along with updates on new “Standard” Model 3 and Y trims. Wall Street projects about 450,000 deliveries in Q4.
Tesla is holding firm near $418, with its RSI turning higher to signal improving momentum. A positive EMA crossover — along with clear angle and separation between the averages — would confirm a strengthening bullish trend.

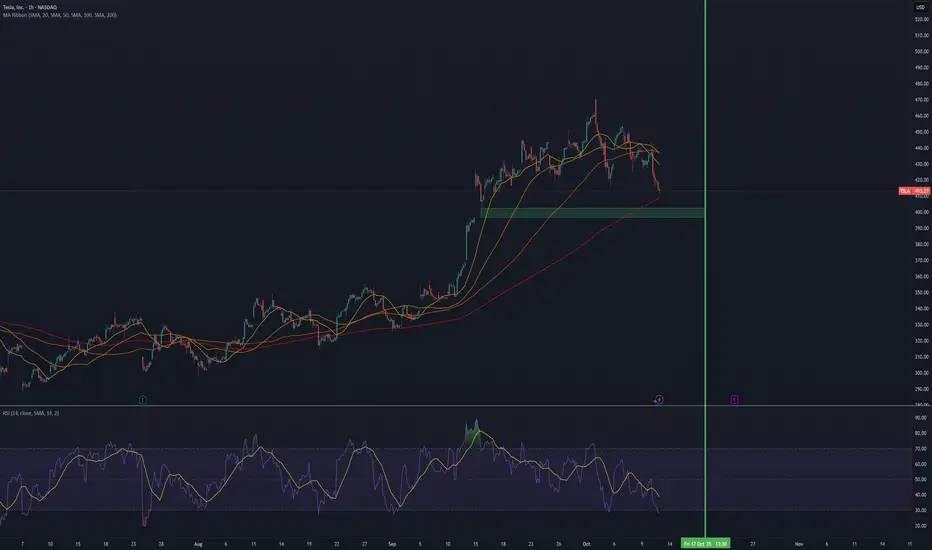
TSLA Week Ahead - ShortTSLA looks like a classic post-rally consolidation after that sharp pop from late September lows around $340. The candlesticks show solid volume on the upside thrusts (those red-to-green hammers mid-September), but we're seeing some profit-taking wicks lately, with the price hugging that rising EMA channel (orange line) around $410 support. That unfilled gap down at $396-$402 (from early October open?) is screaming "magnet" if we get any broader market weakness—gaps like that on high-beta names like TSLA often fill on light-volume Fridays, especially with no major catalysts this week.
The gap is likely to close 70% of the times in 30 day span.
What to Expect by EOD Friday (Oct 17)
No earnings till Oct 22, so this week's all about macro vibes (Fed chatter, CPI print Wed) and TSLA-specific noise like Robotaxi buzz or delivery whispers. Q3 deliveries hit 462k on Oct 2 (beat estimates), so that's baked in—focus shifts to affordable model teases.
Base Case (60% odds): Sideways grind to $415-425. We're in that expected move band of ±6% (~$388-438 from here). Light volume mid-week could keep us coiling in the channel; that gap stays open unless we dump on risk-off. Analysts are meh short-term (avg target $361, but that's 1Y noise), but one shop just hiked to $483. I'd fade any spike above $420 for a quick scalp—RSI's overbought on 1H.
Bull Case (25% odds): Push to $430+. X crowd's frothing—folks calling ATH break by 10/17 on "unstoppable momentum" and 5Y consolidation snap to $500. If CPI undershoots and Elon tweets FSD gold, we tag resistance. One forecast pegs exactly $425 EOW.
Bear Case (15% odds): Gap fill to $400. Volatility spikes if yields rip higher or China EV FUD hits (ZEV credit chatter ending soon). That purple MACD histogram's flattening—watch for divergence.
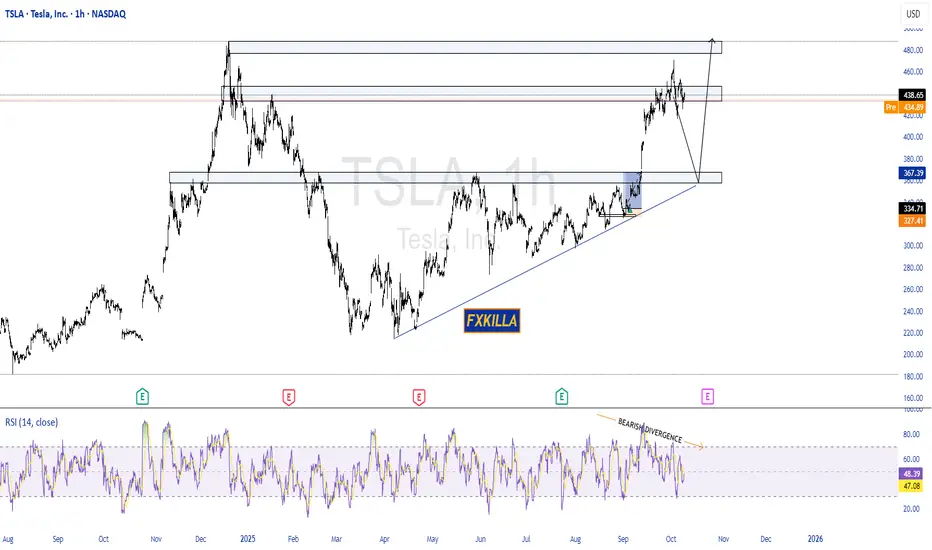
TESLA HIGH PROBABILITY SETUPS SOON!!!🚨 TESLA HIGH PROBABILITY SELL/BUY SETUPS 🚨
* Here We Can See Clearly The Next Potential Move For TSLA Coming Hours/Days.
* Keep Your Eyes Close On Your Trading Positions.
* Happy PIP Hunting Traders.
FXKILLA.
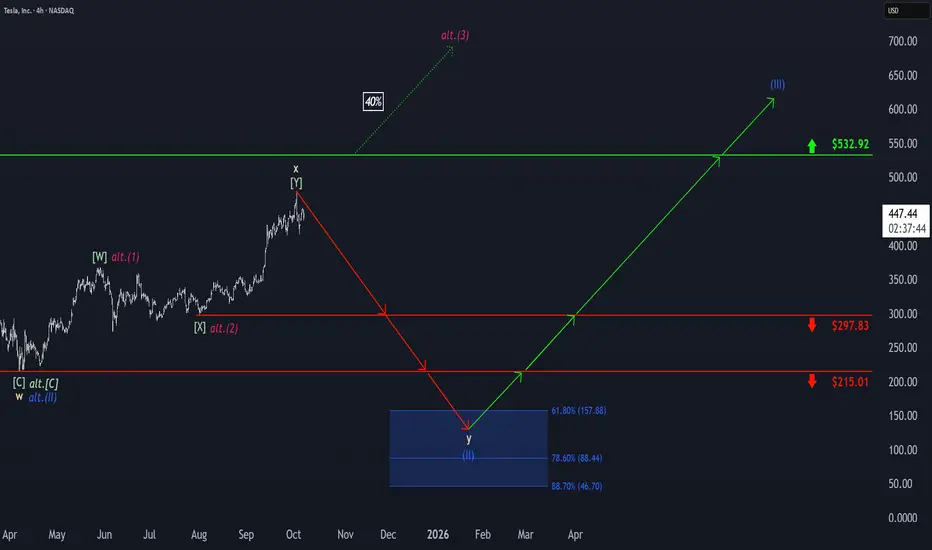
Tesla: Top Established!Tesla initially hit a new high before quickly reversing course with a notable move to the downside. As a result, we now view the corrective upward movement of beige wave x as complete and anticipate further sell-offs as part of wave y. The stock is expected to gradually break below the support levels at $297.83 and $215.01, ultimately reaching our blue Target Zone between $157.88 and $46.70, which we have identified for the final corrective low of blue wave (II). However, there remains a 40% chance that TSLA will not reach the blue zone at all but instead will break out directly above resistance at $532.92. In this case, we would consider blue wave alt.(II) already complete and locate the stock in a sustained (magenta) upward impulse. Even in our primary scenario, the new uptrend of the regular wave (III) is ultimately expected to surpass the $532.92 resistance.
$TSLA: Let The Rally Speak For Itself - 9/16/2025Based on the analysis, it’s confirmed that NASDAQ:TSLA has initiated a new rally following the completion of a lengthy and complex corrective structure at $288.
The stock bounced twice off the 50-week moving average, signaling strong support as the correction neared its end.
Due to the depth and complexity of the structure, Wave 3 is expected to unfold with high momentum, potentially delivering an explosive rally. Key upside targets are displayed in the chart — we’ll be watching closely to see how price reacts at those levels.
📚 Note: The internal structure and labeling were intentionally left visible in the chart for educational purposes. This is especially useful for traders interested in Modern Trading Algorithms and their structural variations.
Happy Trading, and let the rally speak for itself. 🚀
