Market Structure ExplainedHello, traders! 😎
Understanding market structure is key to consistent profits. If you’re not paying attention to how price moves, you’re essentially flying blind. Let’s break it down to help you navigate the market like a pro.
Price Structure: The Backbone of Price Action
Market structure is how price behaves over time, forming the foundation for all trading decisions. It's based on a few core principles: higher highs and higher lows in an uptrend, and lower highs and lower lows in a downtrend. This structure is confirmed through price action and key indicators like moving averages, support and resistance levels, and trendlines.
In an uptrend, the price pushes higher with each rally, creating higher highs and higher lows. This signals bullish momentum, and traders look for breakouts above resistance levels or retest entries at support. Tools like the 50-period moving average (MA) or EMA can act as dynamic support, confirming trend strength. The RSI (Relative Strength Index) helps confirm that the trend is not overbought and has room to run.
In a downtrend, lower highs and lower lows show that sellers are in control. Price breaks through support levels, and corrective rallies face resistance at lower highs. Traders look for retracements, often at key Fibonacci levels, before continuing lower. The MACD (Moving Average Convergence Divergence) confirms the bearish momentum when both the MACD and signal lines trend downward.
Trend vs. Range: The Battle of Market Phases
Trends occur when price moves clearly in one direction, either up or down. Traders love trends because they offer opportunities to ride the price movement for profits. However, sometimes the market enters a range or consolidation phase, where price bounces between support and resistance with no clear direction. In this phase, price moves in an impulse (fast movement) and correction (pullback) pattern, before potentially resuming the trend.
Trend Structure: Knowing When the Market is Shifting
In an uptrend, price makes higher highs and higher lows. When this structure changes—higher highs turn to lower highs and higher lows disappear—that’s a sign of a possible reversal or consolidation.
In a range, price consolidates and waits for the next move. A breakout from the range signals a shift in structure and could lead to the start of a new trend.
Understanding market behavior, whether in a trend or range, is crucial. Recognizing when the market is trending or consolidating helps you navigate price action effectively. Stick to the structure, and you'll stay on track through market moves 🔄
That said, markets are unpredictable. Always rely on your judgment, conduct thorough research, and have a solid plan in place before making any decisions. Make sure to do your homework and be prepared 🙂↕️
Uptrend

XAUUSD TO DROP TO 4300?Gold has been trading above 4k for the past few months before 2026, and still on a strong uptrend as it recently broke through a recent all time high, but currently the metal paired together with the USD is retracing backdown as we watch its movement. Is this a manipulative move or just a reversal downward as it broke an all-time high? From the fractal framework below, we see a recent pull to the upside which left a gap below, so I may guess the instrument is trying to fill its Gap then resume its move to the upside, but then we sit and watch.

Gold Drops More Than 200 USDAt the close of trading on December 29, gold plunged 201 USD to 4,331 USD. In the following session on December 30, prices edged slightly higher to around 4,350 USD.
The precious metal had set a new peak late last week at 4,548 USD, but the rally was quickly reversed. This move is largely attributed to aggressive profit-taking and year-end liquidation by short-term futures traders.
So far, although gold has shown some short-term volatility on the chart, the magnitude remains manageable. However, strong selling pressure may persist today and tomorrow, potentially leading to more significant price swings—especially if the current price channel is decisively broken.
If gold rebounds sharply in the coming days, today’s low could become the latest reaction low within the broader uptrend. In other words, price action over the next two sessions will be critical in determining gold’s direction in the weeks ahead.
From a technical standpoint, the next upside objective for February gold futures bulls is a break above the strong resistance at the record high of 4,548 USD. On the downside, bears are aiming to push prices below the key technical support at 4,200 USD.
What’s your view on where XAUUSD is heading next? Share your thoughts in the comments.

Gold Holds Firm as Markets Reassess MomentumOANDA:XAUUSD is trading around 4,500 USD per ounce, easing slightly from recent highs after an extended rally. The current price action reflects a short-term technical consolidation, as traders lock in profits following the establishment of new record levels.
The recent surge in gold has been driven by a combination of key macroeconomic factors. Geopolitical tensions remain elevated, particularly in the Middle East, while developments surrounding energy sanctions and trade flows in the Americas have increased risk aversion. These conditions continue to channel capital into gold as a preferred safe-haven asset.
At the same time, expectations of looser monetary policy remain a critical pillar of support. Recent U.S. economic data point to slowing growth, moderating inflation, and a softer labor market, reinforcing the view that the Federal Reserve could begin an interest-rate cutting cycle next year. This environment reduces the opportunity cost of holding gold.
From a technical standpoint, gold has broken above multiple consolidation zones and is now holding above a strong high-price base, suggesting that selling pressure remains limited. As long as key support levels are respected, the current pullback is viewed as constructive rather than trend-changing.
In the near term, gold may continue to move sideways while the market awaits fresh catalysts. However, with persistent geopolitical risks and expectations of lower interest rates, the medium-term outlook remains constructive, leaving the door open for another upside extension once buying momentum returns.

Gold Continues to Maintain Its Bullish Streak Into Year-EndHello everyone,
Today, OANDA:XAUUSD is taking a pause during the Christmas holiday period, currently trading around 4,479 USD. Although slightly lower than the previous session, gold continues to hold a strong high-price base after a powerful rally, driven by rising safe-haven flows, escalating geopolitical tensions, and expectations that the Fed may cut interest rates in 2026.
On the chart, price has broken out of the previous sideways range and formed a clear bullish structure. At the moment, gold is consolidating within the 4,450–4,525 range, with 4,520–4,525 acting as the nearest resistance (weak high)—a zone where liquidity may be drawn before the market commits to its next direction.
From a scenario perspective, as long as price holds above key support, any pullbacks are considered healthy, and the uptrend remains dominant. A decisive break above 4,525 could open the door toward 4,600 USD and beyond, especially if supportive factors such as low interest rates and ongoing geopolitical risks persist.
The preferred strategy at this stage remains buy-biased, focusing on patience, confirmation-based entries, trading in line with the trend, and avoiding FOMO.
What’s your view on the current XAUUSD trend? Feel free to leave a comment.
Wishing you a peaceful and joyful Christmas!

Intel aiming to previous two bottomsIntel is probably aiming to harvest a lot of liquidity from the previous two bottoms.

Gold Reaches Fresh Record HighsHello my friends,
Gold prices continue to surge, reaching a record high around 4,505 USD during this morning’s trading session. The precious metal is being driven higher by rising safe-haven demand as the Israel–Iran conflict and escalating tensions between the United States and Venezuela fuel geopolitical uncertainty. In addition, recently subdued U.S. inflation and weak labor market reports have increased market expectations for at least two 25-basis-point rate cuts from the Federal Reserve next year, a backdrop that is clearly supportive for gold.
From a technical perspective, there are no signs of weakness in gold. The nearest support stands around 4,470 USD. As long as prices remain above this level, any short-term pullbacks are considered healthy, and buyers retain the upper hand until a new high is formed.

Gold Hits a New All-Time HighHello everyone, let’s take a look at XAUUSD today.
Gold continues its strong rally, trading around 4,480 USD, up more than 111 USD compared to the same time yesterday. Notably, this marks a new all-time high, decisively breaking above the previous peak.
The sharp rise is driven by surging safe-haven demand at the start of a shortened trading week due to holidays, amid escalating geopolitical tensions.
Gold gained further momentum after weekend reports that the United States is pursuing a third oil tanker near Venezuela. According to a U.S. official, President Trump has intensified oil sanctions against the government of Nicolás Maduro.
Bloomberg reported that the tanker being pursued was operating under a false flag and is subject to a court seizure order, believed to be the Bella 1, a Panama-flagged vessel sanctioned by the U.S.
These actions follow earlier incidents in which the U.S. military boarded the supertanker Centuries and previously the vessel Skipper. The blockade appears to be pressuring Venezuela’s oil storage capacity and could lead to production declines and broader civil instability.
From a technical perspective, the next upside target for February gold futures bulls is a break above the strong resistance at 4,500 USD per ounce. Initial support is seen at 4,400 USD, followed by the overnight low at 4,365 USD.
I remain bullish on gold—what’s your view?

Gold Holds Firm at Elevated LevelsGold is trading today around 4,340 USD, almost unchanged from the previous session, indicating that the market remains stable at high levels after the recent strong rally.
Notably, during the prior U.S. session, gold surged to 4,367 USD, marking a new all-time high, before undergoing a mild pullback toward the end of the session. This highlights that buying interest remains highly active whenever the market is supported by favorable catalysts.
The main driver behind this move came from weaker-than-expected U.S. manufacturing data. The December Philadelphia Fed Manufacturing Index plunged to -10.2, far below forecasts, reigniting concerns about economic health and immediately triggering safe-haven flows into gold.
The release of these disappointing manufacturing figures alongside the November CPI and weekly jobless claims created a convergence effect, pushing gold into positive territory and driving prices to new record highs.
Although some forward-looking indicators continue to suggest growth expectations over the next six months, persistent price pressures and signs of economic slowdown are reinforcing expectations of a more accommodative monetary policy. This continues to provide a solid foundation for gold’s medium-term bullish trend.

EURUSD Market UpdateHello, it’s a pleasure to discuss FX:EURUSD with you.
The EUR/USD pair remains stable today after two days of mild declines, trading around 1.1740 at the time of writing.
From a technical perspective, the bullish momentum is strengthening as price continues to hold above the ascending trendline. The immediate resistance is seen at 1.176, followed by the key level at 1.1800.
I remain optimistic about EURUSD—what’s your view?

How To Rally After Pause In XAUUSD GoldThis video explains how the rally in XAUUSD Gold developed after a pause on the daily timeframe. The analysis focuses on how Gold formed a consolidation phase, how price held above key structure, and how momentum began to rebuild after the pause. By observing the shift in candle behavior, breakout strength, and follow-through, we explore how a rally can continue once the market completes a natural pause.
The purpose of this breakdown is to highlight how daily timeframe structure, pause formation, and momentum alignment can help understand price behavior in XAUUSD Gold—purely for educational and analytical learning.

DAL - Upside Extension Toward ATH Looks PossibleDAL - CURRENT PRICE : 64.20
DAL is showing a strong bullish breakout as price surges above the key horizontal resistance near 64, supported by rising volume and a clean reclaim of both the EMA50 and EMA200. Today’s breakout candle signals renewed momentum, while the ascending trendline beneath reinforces a steady higher-low structure. RSI pushing above 60 reflects strengthening buyers without entering overbought territory. With this decisive breakout, DAL may build momentum toward higher resistance levels and potentially work its way toward challenging its all-time high zone if buyers continue to control the trend. Bias remains bullish above 58–60 support, with further upside favored as long as the breakout holds.
ENTRY PRICE : 64.00 - 64.40
FIRST TARGET : 69.00
SECOND TARGET : 74.00
SUPPORT : 58.00

PATH - Price Reclaims 50-EMA and 200-EMAPATH - CURRENT PRICE : 14.50 - 14.70
PATH is gaining traction after reclaiming both the 50-EMA and 200-EMA, signalling a shift back into short-term bullish momentum 📈. Price strength is supported by rising RSI and an improving MACD cross, suggesting buyers are regaining control.
🔥 Bullish Points
Price reclaimed 50-EMA and 200-EMA
RSI trending above 50 → bullish momentum returning
MACD turning positive with increasing histogram
Volume uptick on recent green candles = buyers active
ENTRY PRICE : 14.50 - 14.70
FIRST TARGET : 16.00
SECOND TARGET : 17.30
SUPPORT : 13.00

SMCI cools the servers while the market warms up expectationsSMCI continues to move inside an ascending channel and is currently trading in the buy zone between the 0.618 and 0.786 Fibonacci levels. Strong demand appears within this range and the ma200 adds structural support as a dynamic base. Weekly divergence indicates weakening selling pressure and increases the probability of a renewed upward cycle. As long as price holds above the ma200 and stays within the channel, the structure remains bullish with the next targets at 41.88 and later at 62.35.
Super Micro Computer remains one of the global leaders in artificial intelligence server infrastructure. As of December 4, trailing twelve month revenue stands near 14.9 billion dollars. Net income exceeds 850 million dollars and cash reserves remain above three billion dollars. The company expands production of liquid cooled systems and next generation platforms for advanced model training. Global demand for artificial intelligence compute capacity continues to strengthen revenue and support margins. Minimal debt levels provide stability during market volatility.
As long as price remains within the buy zone between the 0.618 and 0.786 levels and above the ma200, the bullish continuation scenario remains valid. A confirmed breakout opens the way toward 41.88 and later toward 62.35. Technical and fundamental signals currently align which increases the probability of a new upward wave.
Servers cool down slowly, but trends usually heat up faster, especially with charts like this.

XAUUSD – Fresh Intraday + Weekly OutlookGold is sitting in a key decision zone right now. After last week’s strong push, the market is correcting but still holding the broader bullish structure. We’re basically in the classic phase where the market tests whether the upside trend is ready to continue or if we’ll get a deeper pullback first.
**Where price stands:**
– Still inside the 4H ascending channel.
– Holding above the main support cluster at **4170–4160**, a zone packed with volume and previous absorption.
– Trading beneath the heavy supply area **4235–4245**, which rejected price last time.
– The current pullback has only reached the 38–50% retracement of the latest rally, which is typical of a healthy correction, not a trend reversal.
**Intraday scenarios I’m watching:**
**1. Bullish rotation back into 4230–4240 (most likely while above 4190–4180)**
Signs to confirm:
– Price holds above VWAP or reclaims it.
– 5m–15m MACD turns up or shows bullish divergence.
– Volume drops on the downside and reappears on the buy side near the mid-Bollinger band.
Targets: **4230 first**, then **4235–4240** where the real test sits.
**2. Deeper correction toward 4175–4160**
Triggers:
– Clean breakdown below 4190 with growing sell volume.
– 15m MACD accelerating below zero.
– Price failing to re-enter the Bollinger mid-band after pushes.
Support zones:
– **4180–4175**
– **4170–4160** (major support / best demand zone)
If buyers defend that region again, it becomes a solid area to look for upside continuation.
**3. Full breakout squeeze above 4240**
Less likely immediately, but possible if USD/yields stay weak. In that case, **4245–4250** comes quickly into play, and a move toward the upper side of the 4H channel could follow.
**For the rest of the week:**
As long as 4160–4170 holds, the higher-timeframe trend stays bullish. The only thing stopping gold right now is the supply layer at 4235–4245. If the market spends several sessions failing there, we could see a wider range forming between 4170–4240. If it breaks with volume, the trend extends.
**What I’m monitoring now:**
– Price reaction vs. VWAP
– Volume behavior at both extremes
– Divergences on 5m–15m
– USD and yields (still the biggest driver this month)
This type of movement — impulse → range → sharp pullback → decision — is extremely typical for gold before choosing its next leg. The structure still slightly favors continuation higher, but the real confirmation will happen around **4235–4245**.

STLA - Golden crossSTLA had a Golden Cross on November 18, 2025. Now it will begin the recovery phase for this stock. The stock price is above all MA20, MA50, and MA200. Both RSI and MACD indicators support the uptrend. Hopefully, this prediction is accurate.
The price on 11.28.2025: $10.66 (Entry).
Price target: $11.43/ $13.12/ $17.81/ $25.38
Stop loss: $10.14.
IMO, amateur trader.
Good luck!

GBP/AUD: Upside Potential from High Volume ZoneCurrent Situation:
GBP/AUD price reached the resistance level at 2.03417, where limit players halted the upward movement and pushed the price down into a high volume zone. A small reversal structure is forming in this area, indicating a possible resumption of growth.
Primary Scenario:
We expect continuation of upward movement from the current support zone. The presence of an unfilled gap above confirms the probability of price attraction to these levels. The high volume zone serves as a platform for building buying interest from institutional participants.
Target Levels:
Primary target: filling the gap above current levels
Secondary target: updating the high around 2.03417 and beyond
Alternative Scenario:
If price fails to hold within the high volume zone and breaks below it with increased selling volume, this will invalidate the bullish scenario and open the path for a deeper correction.
Trading Plan:
Entry Zone: Current high volume zone (position already opened)
Key Resistance: 2.03417
Support Level: Lower boundary of the high volume zone
Position Management:
Monitor price development in the reversal zone. Upon confirmation of upward movement, partial profit-taking is recommended as price approaches the 2.03417 level, followed by trailing the remaining position.
Risk Management:
Stop-loss should be placed below the high volume zone to protect against the alternative scenario realization.

A clear long term support that could be used to buyIn the last 5 years this has been a multi year support, many instances we went up from here.
Also ex dividend payment on 24 nov, some free money.

TMB (Tamilnadu merca bank) right to enter for swing ??no, this is not right time to enter swing . as per my anlysis ,choch happened, after choch it need to colloect poi. my entry at 455 and sl at 424 and my target at 796..
all my analysis for educational purpose only

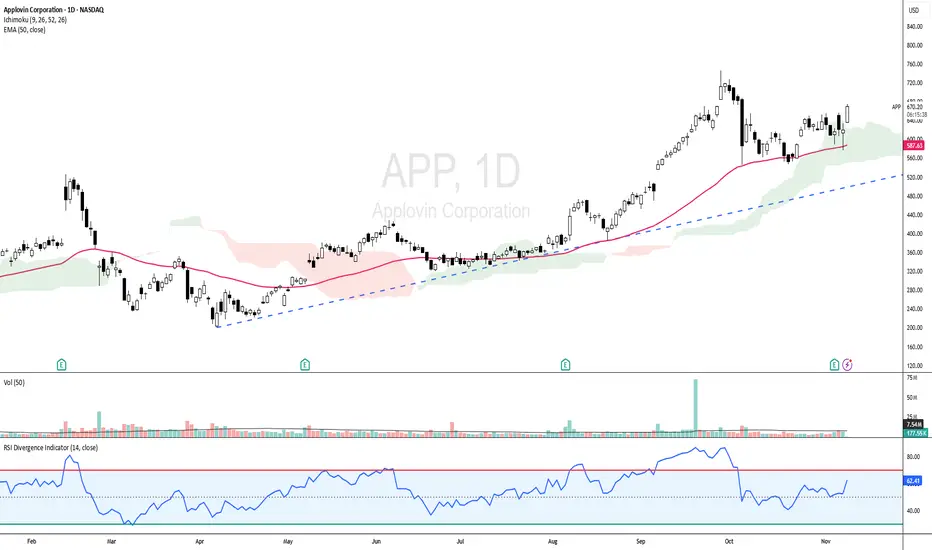
APP - UPTREND STILL INTACT!APP - CURRENT PRICE : 670.00 - 674.00
APP is showing strong bullish momentum as the price trades above the 50-day EMA and ICHIMOKU CLOUD , indicating a sustained uptrend. The RSI is in bullish territory but not yet overbought, indicating room for further upside. With the current setup, the stock has potential to retest its all-time high area if momentum continues.
ENTRY PRICE : 670.00 - 674.00
FIRST TARGET : 727.00
SECOND TARGET : 770.00
SUPPORT : 50-day EMA
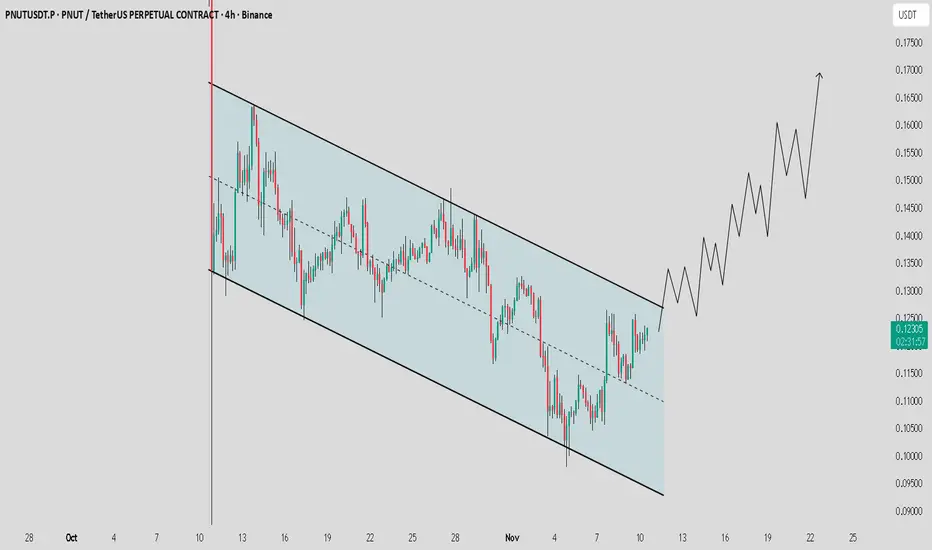
PNUT / USDT : Breakout from channel could ignite a strong rally
PNUT / USDT is moving cleanly within a descending channel and has now bounced from the mid-zone, heading towards the upper resistance line.
A confirmed breakout with volume could trigger a strong rally towards $0.18 - $0.22 in the coming days.
Watch for confirmation and manage risk wisely.
Nifty Metal Index NIFTY METAL INDEX Updated Chart for members Reference.
On Big Breakout (BO). On Confirmation Big rally on card 🧐
Support, Resistance /BO level, Tgt, Updated Tgt Marked in Chart.
Stocks to be noted
TATA STEEL
HINDALCO
JINDAL STEEL
SAIL
NMDC & NMDC STEEL
GALLANT ISPAT
WELSPUN
GPIL

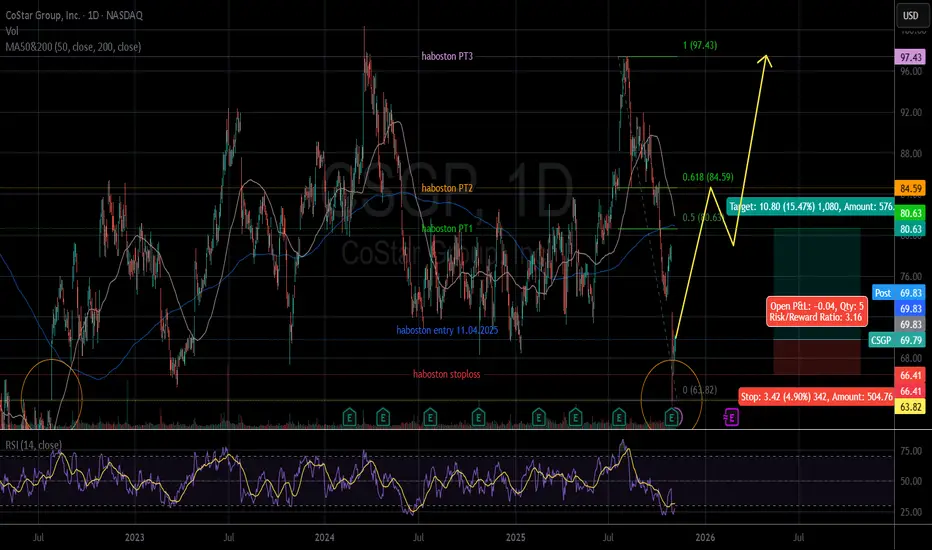
CSGP - Bullish, Reversal and rising againLast week, CSGO filled the gap at $63.82 on 27/07/2022.
So, the correction wave is over.
Use Fibonacci retracement to determine price targets.
The price after hour 11.04.2025: $69.83 (Entry).
Price target: $80.63/ $84.59/ $97.43
Stop loss: $66.41.
IMO, amateur trader.
Good luck!