Bullish momentum to extend?USDX is falling towards the support level, which is a pullback support that is slightly above the 38.2% Fibonacci retracement and could bounce from this level to our take profit.
Entry: 96.99
Why we like it:
There is a pullback support level that is slightly above the 38.2% Fibonacci retracement.
Stop loss: 96.31
Why we like it:
There is a pullback support level that aligns with the 61.8% Fibonacci retracement.
Take profit: 97.93
Why we like it:
There is a pullback resistance level that is slightly above the 61.8% Fibonacci retracement.
Enjoying your TradingView experience? Review us!
Please be advised that the information presented on TradingView is provided to Vantage (‘Vantage Global Limited’, ‘we’) by a third-party provider (‘Everest Fortune Group’). Please be reminded that you are solely responsible for the trading decisions on your account. There is a very high degree of risk involved in trading. Any information and/or content is intended entirely for research, educational and informational purposes only and does not constitute investment or consultation advice or investment strategy. The information is not tailored to the investment needs of any specific person and therefore does not involve a consideration of any of the investment objectives, financial situation or needs of any viewer that may receive it. Kindly also note that past performance is not a reliable indicator of future results. Actual results may differ materially from those anticipated in forward-looking or past performance statements. We assume no liability as to the accuracy or completeness of any of the information and/or content provided herein and the Company cannot be held responsible for any omission, mistake nor for any loss or damage including without limitation to any loss of profit which may arise from reliance on any information supplied by Everest Fortune Group.
Usdx

Potential bearish reversal?US Dollar Index has rejected off the resistance level whic his a pullback resistance that aligns with the 50% Fibonacci retracement andcould drop from this level to our take profit.
Entry: 97.37
Why we like it:
There is a pullback resistance level that aligns with the 50% Finbonacc retracememt.
Stop loss: 97.93
Why we like it:
There is a pullback resistance that is slightly above the 61.8% Fibonacci retracement.
Take profit: 96.30
Why we like it:
There is a pullback support that is slightly below the 50% Fibonacci retracement.
Enjoying your TradingView experience? Review us!
Please be advised that the information presented on TradingView is provided to Vantage (‘Vantage Global Limited’, ‘we’) by a third-party provider (‘Everest Fortune Group’). Please be reminded that you are solely responsible for the trading decisions on your account. There is a very high degree of risk involved in trading. Any information and/or content is intended entirely for research, educational and informational purposes only and does not constitute investment or consultation advice or investment strategy. The information is not tailored to the investment needs of any specific person and therefore does not involve a consideration of any of the investment objectives, financial situation or needs of any viewer that may receive it. Kindly also note that past performance is not a reliable indicator of future results. Actual results may differ materially from those anticipated in forward-looking or past performance statements. We assume no liability as to the accuracy or completeness of any of the information and/or content provided herein and the Company cannot be held responsible for any omission, mistake nor for any loss or damage including without limitation to any loss of profit which may arise from reliance on any information supplied by Everest Fortune Group.

Heading towards key resistance?US Dollar Index (USD) is rising towards the resistance level, which is an overlap resistance that aligns with the 50% Fibonacci retracement and could reverse from this level to our take profit.
Entry: 97.37
Why we like it:
There is an overlap resistance level that aligns with the 50% Fibonacci retracement.
Stop loss: 97.93
Why we like it:
There is a pullback resistance level that is slightly above the 61.8% Fibonacci retracement.
Take profit: 96.30
Why we like it:
There is a pullback support level.
Enjoying your TradingView experience? Review us!
Please be advised that the information presented on TradingView is provided to Vantage (‘Vantage Global Limited’, ‘we’) by a third-party provider (‘Everest Fortune Group’). Please be reminded that you are solely responsible for the trading decisions on your account. There is a very high degree of risk involved in trading. Any information and/or content is intended entirely for research, educational and informational purposes only and does not constitute investment or consultation advice or investment strategy. The information is not tailored to the investment needs of any specific person and therefore does not involve a consideration of any of the investment objectives, financial situation or needs of any viewer that may receive it. Kindly also note that past performance is not a reliable indicator of future results. Actual results may differ materially from those anticipated in forward-looking or past performance statements. We assume no liability as to the accuracy or completeness of any of the information and/or content provided herein and the Company cannot be held responsible for any omission, mistake nor for any loss or damage including without limitation to any loss of profit which may arise from reliance on any information supplied by Everest Fortune Group.

DXY, USDXThe DXY price is in a key support zone. If the price can hold above 95.06, I expect there is a chance of an upward movement.
🔥Trading futures, forex, CFDs and stocks carries a risk of loss.
Please consider carefully whether such trading is suitable for you.
This content is not financial advice. Always conduct your own financial due diligence.
>>GooD Luck 😊
❤️ Like and subscribe to never miss a new idea!

DXYDXY price is in a sideways movement. The price has a chance to test the 97.2 and 96.7 zones. If the price fails to break through 96.7, a rebound is expected.
🔥Trading futures, forex, CFDs and stocks carries a risk of loss.
Please consider carefully whether such trading is suitable for you.
This content is not financial advice. Always conduct your own financial due diligence.
>>GooD Luck 😊
❤️ Like and subscribe to never miss a new idea!

Bearish drop off?USDX has rejected off the resistance level, which is an overlap resistance, and could drop from this level to our take profit.
Entry: 98.96
Why we like it:
There is an overlap resistance level.
Stop loss: 99.27
Why we like it:
There is a multi-swing high resistance level.
Take profit: 98.51
Why we like it:
There is an overlap support that is slightly below the 50% Fibonacci retracement.
Enjoying your TradingView experience? Review us!
Please be advised that the information presented on TradingView is provided to Vantage (‘Vantage Global Limited’, ‘we’) by a third-party provider (‘Everest Fortune Group’). Please be reminded that you are solely responsible for the trading decisions on your account. There is a very high degree of risk involved in trading. Any information and/or content is intended entirely for research, educational and informational purposes only and does not constitute investment or consultation advice or investment strategy. The information is not tailored to the investment needs of any specific person and therefore does not involve a consideration of any of the investment objectives, financial situation or needs of any viewer that may receive it. Kindly also note that past performance is not a reliable indicator of future results. Actual results may differ materially from those anticipated in forward-looking or past performance statements. We assume no liability as to the accuracy or completeness of any of the information and/or content provided herein and the Company cannot be held responsible for any omission, mistake nor for any loss or damage including without limitation to any loss of profit which may arise from reliance on any information supplied by Everest Fortune Group.

DXY, USDXDXY is currently approaching the support zone at $98. If this support holds strong and the price fails to break through $98, a rebound is possible. Consider buying in the red zone.
🔥Trading futures, forex, CFDs and stocks carries a risk of loss.
Please consider carefully whether such trading is suitable for you.
This content is not financial advice. Always conduct your own financial due diligence.
>>GooD Luck 😊
❤️ Like and subscribe to never miss a new idea!

Bearish reversal off pullback resistance?USDX is reacting off the resistance level, which is a pullback resistance that aligns with the 50% Fibonacci retracement and could reverse from this level to our take profit.
Entry: 98.89
Why we like it:
There is a pullback resistance level that aligns with the 50% Fibonacci retracement.
Stop loss: 99.39
Why we like it:
There is an overlap resistance level.
Take profit: 98.36
Why we like it:
There is a pullback support level that aligns with the 50% Fibonacci retracement.
Enjoying your TradingView experience? Review us!
Please be advised that the information presented on TradingView is provided to Vantage (‘Vantage Global Limited’, ‘we’) by a third-party provider (‘Everest Fortune Group’). Please be reminded that you are solely responsible for the trading decisions on your account. There is a very high degree of risk involved in trading. Any information and/or content is intended entirely for research, educational and informational purposes only and does not constitute investment or consultation advice or investment strategy. The information is not tailored to the investment needs of any specific person and therefore does not involve a consideration of any of the investment objectives, financial situation or needs of any viewer that may receive it. Kindly also note that past performance is not a reliable indicator of future results. Actual results may differ materially from those anticipated in forward-looking or past performance statements. We assume no liability as to the accuracy or completeness of any of the information and/or content provided herein and the Company cannot be held responsible for any omission, mistake nor for any loss or damage including without limitation to any loss of profit which may arise from reliance on any information supplied by Everest Fortune Group.

USDX H1 (07.1.2026)Thinking short :
1.USDX did not break the previous high
2.There are reversal patterns on the resistance (M15 double top & a pinbar candle)

US Dollar RECAPDollar Index (DXY) — Range Heat Building
You’ve got a weekly bearish range, with a key high at 99.8 and price now trading into bearish distribution around 99.0.
The dollar’s been front and center this week — while Washington argues over funding, it’s been doing real damage across cross-asset charts.
Price has been printing higher lows all week, grinding inside this bearish range.
That’s your profit-taking zone, not an add-on zone.
Stay patient. Let the range speak.

US DOLLAR LIQUIDITY GAMES🇺🇸 US Dollar Range Politics – Liquidity Before Clarity
The dollar isn’t trending — it’s negotiating.
📊 Current Setup
U.S. Dollar Index (DXY): 98.322 → testing the value area high
Range Floor: 96.747 → the value area low
Structure: Bearish range, with liquidity being hunted before any true direction emerges.
🏛️ Macro Backdrop
Tariffs are reshaping global flows.
Fiscal gridlock + shutdown risk clouds investor confidence.
Inflation + Fed policy signals remain mixed.
Every headline feels like an amendment to a bill no one fully understands.
The result: the dollar drifts sideways in a liquidity-seeking phase. Traders should expect chop inside the box until a decisive catalyst (data, Fed action, or policy shift) provides clarity.
🌍 Cross Pair Impact
This stalemate spills into the majors:
EURUSD & GBPUSD → reflecting the same sideways ranges and fake-outs.
USDJPY → volatility compressed, waiting for dollar direction.
Crosses are trading in sympathy — liquidity hunts on both ends, with no clean trend until DXY escapes its range.
🧭 Takeaway: The dollar is boxed in by politics and policy. Patience rules here: trade the range, wait for the breakout.

US DOLLAR LIQUIDITY GAMES MAPThe U.S. Dollar is testing traders resolve.
Price action keeps pressing higher, and a daily close above 97.394 would confirm a classic “fractal low” — the kind of structural pivot that lures late buyers before the real move unfolds.
3 Key Insights
Macro Calendar – Stay alert:
Thu – Final Q2 GDP, Weekly Jobless Claims, Durable Goods Orders.
Fri – Core PCE Price Index, Personal Income & Spending, University of Michigan Sentiment (final).
These are the week’s steering currents for USD flows.
A daily close above 97.394 is the key trigger to confirm a fresh leg higher.
• EUR/USD short bias remains valid while DXY stays bid, but expect intraday volatility around data releases.

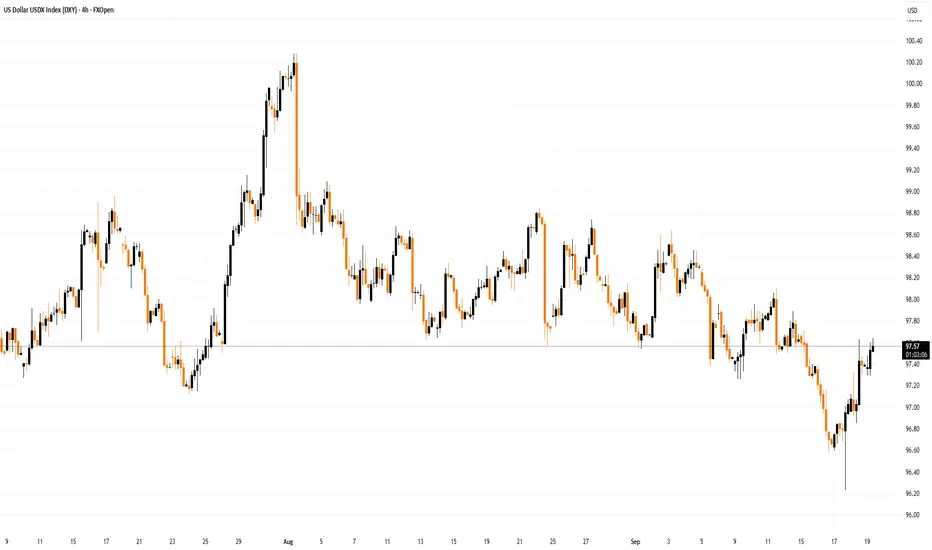
What Was Important for the US Dollar Index (DXY) This WeekWhat Was Important for the US Dollar Index (DXY) This Week
The long-awaited event — the Fed’s first rate cut of 2025 — has taken place. What is particularly important to note is the price action on the US Dollar Index (DXY) chart.
The value of the USD against a basket of other currencies made a two-step move, forming a pin-bar candle with a long lower shadow:
→ Arrow 1: When the Fed actually announced the easing, the dollar weakened as expected on this “dovish news.”
→ Arrow 2: But at the subsequent press conference, Fed Chair Jerome Powell delivered a series of “hawkish” remarks that shifted the market mood and drove the dollar higher. He stressed that this cut does not mark the beginning of “a series of continuous rate reductions,” and that further decisions will be taken “based on incoming economic data.”
Powell also stated plainly that the option of a more aggressive 50-basis-point cut had not gained sufficient support among FOMC members. Therefore, the “down-then-up” move highlights a sharp change in trader sentiment within a short timeframe, as expectations failed to materialise.
Technical Analysis of the DXY Chart
In our 9 September analysis, we confirmed the relevance of:
→ the descending channel (shown in red) defined by a sequence of lower highs and lower lows;
→ the intermediate QL and QH lines, which divide the channel into quarters.
Notably, at Wednesday’s low the price:
→ touched the QL line, underscoring its strength;
→ formed a clear Liquidity Grab pattern (in the terminology of the Smart Money Concept methodology).
From the perspective of Richard Wyckoff’s method, Wednesday’s low may be viewed as a Spring pattern, which preceded a Mark-Up phase of rising prices.
How Might Events Unfold Next?
Given the above, we could assume that the hawkish tone could serve as a longer-term factor for the DXY index. The 97.55 level appears to act as resistance, but it is possible that we may see an attempt to break through it, with the next target being the QH line.
This article represents the opinion of the Companies operating under the FXOpen brand only. It is not to be construed as an offer, solicitation, or recommendation with respect to products and services provided by the Companies operating under the FXOpen brand, nor is it to be considered financial advice.
Title: USDX 4H — expectations vs realityThe dollar index once again finds itself in a position where heroic posture doesn’t match reality. Price is capped at 97.85 right at the 0.382 Fibonacci level and every move higher quickly fades like a spark in the rain. If the breakout fails the road towards 97.24 and 96.90 seems far more realistic since the 0.618 retracement and demand zone are located there.
Moving averages are pressing from above, volumes don’t support the bulls and technically the setup favors weakness rather than strength.
Watching USD behavior every dip in gold silver euro and pound becomes a clear swing trading buy opportunity.
Fundamentally the dollar is also under pressure as markets expect a dovish Fed, Treasury yields stay weak and risk appetite drives capital into other assets. In the end the greenback looks more like a tired runner than a sprinter ready to race.

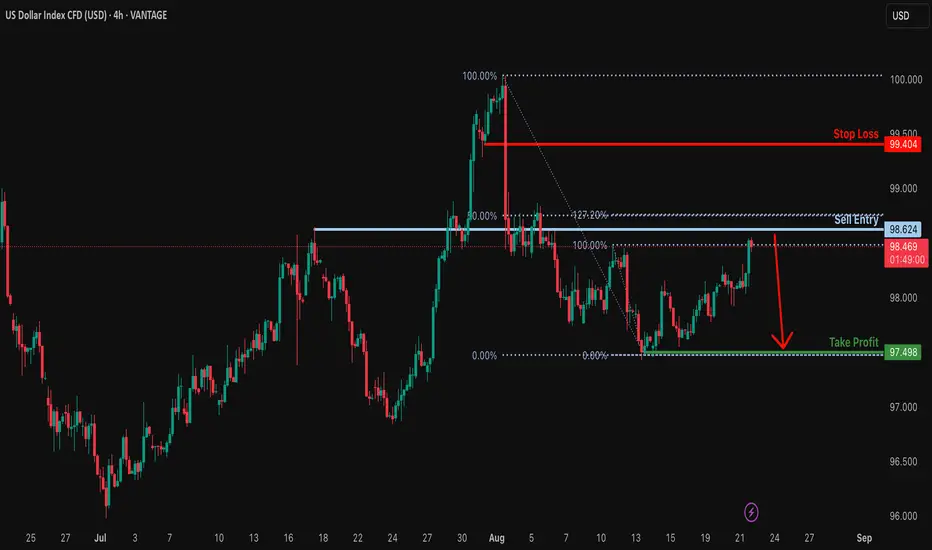
Potential bearish reversal?USDX is rising towards the resistance level which is an overlap resistance that is slghtly below the 50% Fibonacci retracement and the 127.2% Fibonacci extension and could revrse from this level to our take profit.
Entry: 98.62
Why we like it:
There is an overlap resistance level that is slightly below the 50% Fibonacci retracement and the 127.2% Fibonacci extension.
Stop loss: 99.40
Why we like it:
There is a pullback resistance level.
Take profit: 97.49
Why we like it:
There is a swing low support.
Enjoying your TradingView experience? Review us!
Please be advised that the information presented on TradingView is provided to Vantage (‘Vantage Global Limited’, ‘we’) by a third-party provider (‘Everest Fortune Group’). Please be reminded that you are solely responsible for the trading decisions on your account. There is a very high degree of risk involved in trading. Any information and/or content is intended entirely for research, educational and informational purposes only and does not constitute investment or consultation advice or investment strategy. The information is not tailored to the investment needs of any specific person and therefore does not involve a consideration of any of the investment objectives, financial situation or needs of any viewer that may receive it. Kindly also note that past performance is not a reliable indicator of future results. Actual results may differ materially from those anticipated in forward-looking or past performance statements. We assume no liability as to the accuracy or completeness of any of the information and/or content provided herein and the Company cannot be held responsible for any omission, mistake nor for any loss or damage including without limitation to any loss of profit which may arise from reliance on any information supplied by Everest Fortune Group.
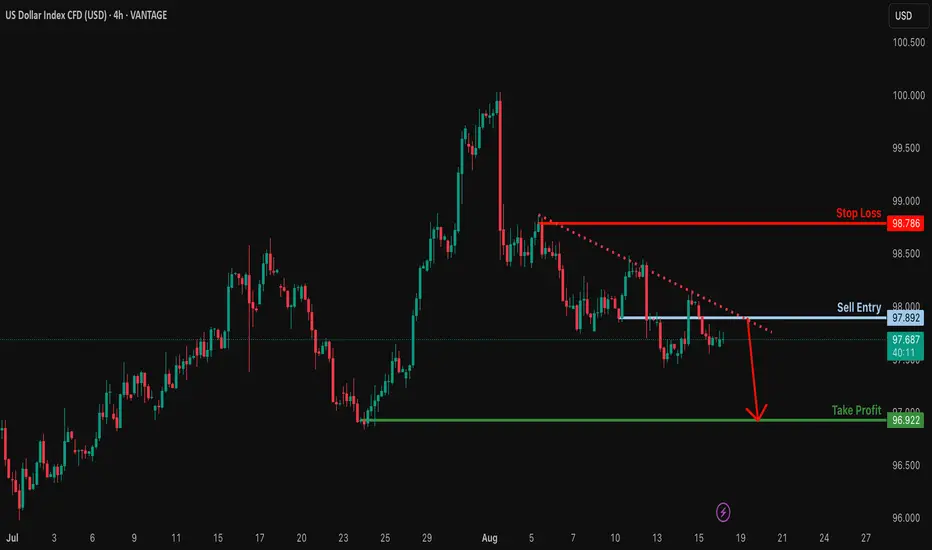
Potential bearish drop?USDX is rising towards the resistance, which is a pullback resistance, and could drop from this level to our take-profit.
Entry: 97.89
Why we like it:
There is a pullback resistance.
Stop loss: 98.78
Why we like it:
There is a pullback resistance.
Take profit: 97.92
Why we like it:
There is a swing low support.
Enjoying your TradingView experience? Review us!
Please be advised that the information presented on TradingView is provided to Vantage (‘Vantage Global Limited’, ‘we’) by a third-party provider (‘Everest Fortune Group’). Please be reminded that you are solely responsible for the trading decisions on your account. There is a very high degree of risk involved in trading. Any information and/or content is intended entirely for research, educational and informational purposes only and does not constitute investment or consultation advice or investment strategy. The information is not tailored to the investment needs of any specific person and therefore does not involve a consideration of any of the investment objectives, financial situation or needs of any viewer that may receive it. Kindly also note that past performance is not a reliable indicator of future results. Actual results may differ materially from those anticipated in forward-looking or past performance statements. We assume no liability as to the accuracy or completeness of any of the information and/or content provided herein and the Company cannot be held responsible for any omission, mistake nor for any loss or damage including without limitation to any loss of profit which may arise from reliance on any information supplied by Everest Fortune Group.
Potential bearish reversal?US Dollar (USDX) has rejected off the resistance level which is a pullback resistance that aligns with the 23.6% Fibonacci retracement and could drop from this level to our take profit.
Entry: 98.40
Why we like it:
There is a pullback resistance that lines up with the 23.6% Fibonacci retracement.
Stop loss: 99.94
Why we like it:
There is a swing high resistance.
Take profit: 96.92
Why we like it:
There is a swing low support 61.8% Fibonacci projection.
Enjoying your TradingView experience? Review us!
Please be advised that the information presented on TradingView is provided to Vantage (‘Vantage Global Limited’, ‘we’) by a third-party provider (‘Everest Fortune Group’). Please be reminded that you are solely responsible for the trading decisions on your account. There is a very high degree of risk involved in trading. Any information and/or content is intended entirely for research, educational and informational purposes only and does not constitute investment or consultation advice or investment strategy. The information is not tailored to the investment needs of any specific person and therefore does not involve a consideration of any of the investment objectives, financial situation or needs of any viewer that may receive it. Kindly also note that past performance is not a reliable indicator of future results. Actual results may differ materially from those anticipated in forward-looking or past performance statements. We assume no liability as to the accuracy or completeness of any of the information and/or content provided herein and the Company cannot be held responsible for any omission, mistake nor for any loss or damage including without limitation to any loss of profit which may arise from reliance on any information supplied by Everest Fortune Group.

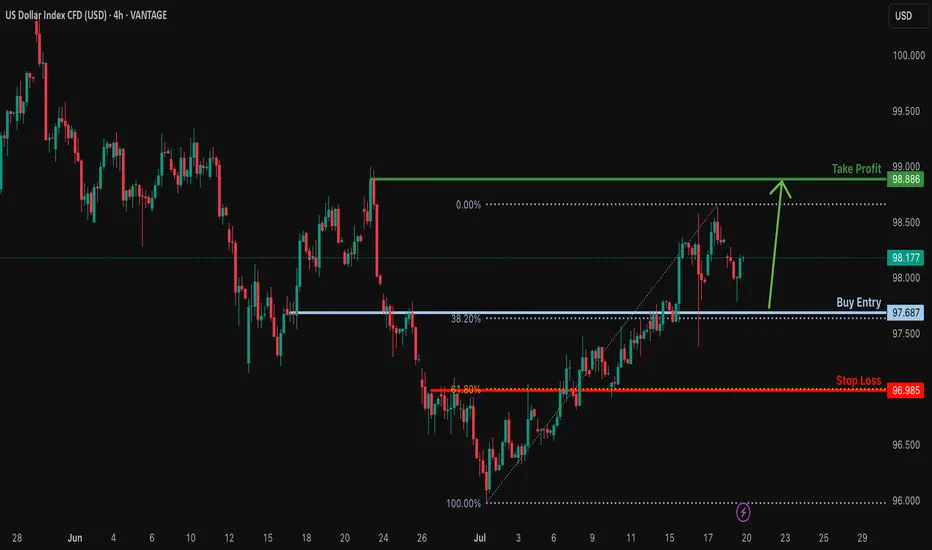
Bullish continuation for the Dollar?The price is falling towards the support level which is a pullback support that lines up with the 38.2% Fibonacci retracement and could bounce from this level to our take profit.
Entry: 97.68
Why we like it:
There is a pullback support that aligns with the 38.6% Fibonacci retracement.
Stop loss: 96.98
Why we lik eit:
There is an overlap support that aligns with the 61.8% Fibonacci retracement.
Take profit: 98.88
Why we like it:
There is a pullback resistance.
Enjoying your TradingView experience? Review us!
Please be advised that the information presented on TradingView is provided to Vantage (‘Vantage Global Limited’, ‘we’) by a third-party provider (‘Everest Fortune Group’). Please be reminded that you are solely responsible for the trading decisions on your account. There is a very high degree of risk involved in trading. Any information and/or content is intended entirely for research, educational and informational purposes only and does not constitute investment or consultation advice or investment strategy. The information is not tailored to the investment needs of any specific person and therefore does not involve a consideration of any of the investment objectives, financial situation or needs of any viewer that may receive it. Kindly also note that past performance is not a reliable indicator of future results. Actual results may differ materially from those anticipated in forward-looking or past performance statements. We assume no liability as to the accuracy or completeness of any of the information and/or content provided herein and the Company cannot be held responsible for any omission, mistake nor for any loss or damage including without limitation to any loss of profit which may arise from reliance on any information supplied by Everest Fortune Group.
DXYDXY price has come down to test the important support zone 96-95. If the price cannot break through the 95 level, it is expected that the price will rebound. Consider buying the red zone.
🔥Trading futures, forex, CFDs and stocks carries a risk of loss.
Please consider carefully whether such trading is suitable for you.
>>GooD Luck 😊
❤️ Like and subscribe to never miss a new idea!

USD Roadmap: Bullish Recovery or Structural Breakdown?TVC:DXY CAPITALCOM:DXY
🟢 Scenario A – Bullish Rebound (Red Arrow Up):
Price bounces from the lower channel and breaks toward:
107.348, 110.176, or even 111.901 resistance area.
If the dollar is supported by China buying USD, hawkish Fed, or geopolitical tensions, this scenario gains weight.
🔸 Resistance: Blue downward-sloping line (possible trendline resistance or lower high area)
🔸 Risk: Price could form a lower high and then reverse.
🔴 Scenario B – Bearish Breakdown (Red Arrow Down):
If the USD fails to break above resistance (around 107–112) and gets rejected…
Then we see a move back down, possibly breaking the long-term channel, aiming for the lower diagonal support zone or even sub-92.
🔸 This would signal a major shift in USD strength, possibly driven by:
Fed rate cuts
Global de-dollarization
China not supporting USD
Stronger EUR or CNY

DXYDXY price is near the support zone 98.74-97.87. If the price cannot break through the 97.87 level, it is expected that the price will rebound. Consider buying the red zone.
🔥Trading futures, forex, CFDs and stocks carries a risk of loss.
Please consider carefully whether such trading is suitable for you.
>>GooD Luck 😊
❤️ Like and subscribe to never miss a new idea!
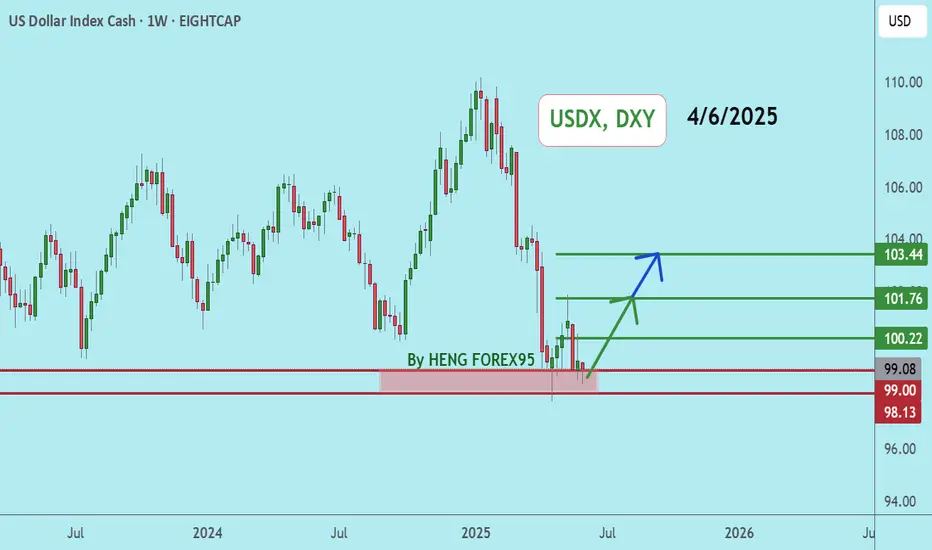
Dollar Bounce to 103 Incoming or Straight to 96?Will the Dollar Keep Tumbling, or Are We About to Bounce Back to 103 in May?
Checking out the monthly charts, April finally delivered a close under that critical 100 level, breaking a floor that held firm for years:
Zooming into the weekly chart, we’ve retraced back to test the 100 level from below. It’s now acting as resistance—so, is another big drop coming?
Long term, my bias is clear: the dollar looks set to keep sliding lower after breaking the crucial 100 mark. But if we flip to the daily charts, we can clearly see signs of a short-term bounce brewing. It looks like price might want to squeeze back inside the range, aiming for that juicy sell zone around the 103 mark—the very origin of the leg down that initially broke 100:
This 103 area is a prime spot for short-term bulls, and an even better opportunity to start loading up on shorts for a move down towards the Monthly buy zone around 96.
Personally, I won’t trade USDX directly to the upside—I'll instead use this analysis to play setups on pairs like EURUSD and AUDUSD, as they're approaching key resistance areas right now.
My game plan: wait patiently for price to reach around 103, then start hunting for sell signals. But first, we’ll need a solid daily close back above 100, something I think we could see happen this week.
Don’t forget—we’ve got the Fed’s interest rate decision coming up, which might trigger some volatility. We could easily rally up to 103 ahead of the decision and then see a sell-off afterward. Of course, if the Fed throws us a curveball, the dollar might never get back above 100, and just continue dropping straight away.
Right now, the 100 level is crucial—so watch closely.
What’s your take? Drop your thoughts below! 😊

USDX,DXYUSDX price is near the important support zone 98.23-97.75. If the price cannot break through the 97.75 level, it is expected that in the short term there is a chance that the price will rebound.
**Very Risky Trade
🔥Trading futures, forex, CFDs and stocks carries a risk of loss.
Please consider carefully whether such trading is suitable for you.
>>GooD Luck 😊
❤️ Like and subscribe to never miss a new idea!
