Nifty Playbook W1 (as of Dec 29, 2025)Nifty playbook Week 1 (as of Dec 29, 2025):
• Dotted projectile lines → My exhaustion zones (VAR-based) — where momentum typically fades and reversals kick in.
• Range lines → My standard expected up/down volatility range.
• Key S/R lines (some marked by specific candle timeframe closes) → Strong support/resistance levels for added conviction.
Playbook summary: Now just watch the chart dance. Wait for price to interact with exhaustion zones + range boundaries + key S/R. When confirmation hits, execute the flip mechanism exactly as outlined in my 23 Dec idea (reversal trade on exhaustion failure or breakout).
Stay patient — the market will show its hand.
Volatility

Amazon.com May Be CoilingAmazon.com has done little since the summer, but some traders may think it’s poised to move in the New Year.
The first pattern on today’s chart is the price area between roughly $233 and $234. This matches the closing price on July 31 before a bearish earnings gap. It’s also near a weekly low on November 14 and a weekly close on November 28. AMZN ended last week slightly below that zone, which may create potential for a breakout.
Second, the e-commerce giant has pushed through a falling trendline that started in early November.
Third, the 50- and 100-day simple moving averages are near each other. Bollinger Bandwidth has also compressed. Could that period of sideways movement lay the groundwork for a new trend?
Next, MACD is rising and the 8-day exponential moving average (EMA) crossed above the 21-day EMA. That may reflect emerging short-term bullishness.
Finally, AMZN is an active underlier in the options market. (Its average daily volume of 556,000 contracts ranks fifth in the S&P 500, according to TradeStation data.) That could help traders take positions with calls and puts.
TradeStation has, for decades, advanced the trading industry, providing access to stocks, options and futures. If you're born to trade, we could be for you. See our Overview for more.
Past performance, whether actual or indicated by historical tests of strategies, is no guarantee of future performance or success. There is a possibility that you may sustain a loss equal to or greater than your entire investment regardless of which asset class you trade (equities, options or futures); therefore, you should not invest or risk money that you cannot afford to lose. Online trading is not suitable for all investors. View the document titled Characteristics and Risks of Standardized Options at www.TradeStation.com . Before trading any asset class, customers must read the relevant risk disclosure statements on www.TradeStation.com . System access and trade placement and execution may be delayed or fail due to market volatility and volume, quote delays, system and software errors, Internet traffic, outages and other factors.
Securities and futures trading is offered to self-directed customers by TradeStation Securities, Inc., a broker-dealer registered with the Securities and Exchange Commission and a futures commission merchant licensed with the Commodity Futures Trading Commission). TradeStation Securities is a member of the Financial Industry Regulatory Authority, the National Futures Association, and a number of exchanges.
Options trading is not suitable for all investors. Your TradeStation Securities’ account application to trade options will be considered and approved or disapproved based on all relevant factors, including your trading experience. See www.TradeStation.com . Visit www.TradeStation.com for full details on the costs and fees associated with options.
Margin trading involves risks, and it is important that you fully understand those risks before trading on margin. The Margin Disclosure Statement outlines many of those risks, including that you can lose more funds than you deposit in your margin account; your brokerage firm can force the sale of securities in your account; your brokerage firm can sell your securities without contacting you; and you are not entitled to an extension of time on a margin call. Review the Margin Disclosure Statement at www.TradeStation.com .
TradeStation Securities, Inc. and TradeStation Technologies, Inc. are each wholly owned subsidiaries of TradeStation Group, Inc., both operating, and providing products and services, under the TradeStation brand and trademark. When applying for, or purchasing, accounts, subscriptions, products and services, it is important that you know which company you will be dealing with. Visit www.TradeStation.com for further important information explaining what this means.

AUXX.TO — Swing Trade Idea💰 AUXX.TO — Swing Trade Idea
🏢 Company Snapshot
Gold X2 Mining Inc. is a TSXV-listed junior gold explorer with exposure to precious metals.
Why now: gold strength + junior miners showing relative momentum; AUXX is emerging from a multi-month base into a higher-high structure.
📊 Fundamental Context (Trade-Relevant Only)
Valuation: Typical junior explorer — priced on optionality, not earnings; leveraged to gold moves.
Balance Sheet: Low operating leverage; financing risk typical but manageable near-term.
Cash Flow: Pre-revenue; price action is the signal.
Dividend: None.
Fundamental Read: This is a technically driven momentum trade with gold acting as the macro tailwind.
🪙 Industry & Sector Backdrop
Short-Term (1–4 weeks): Gold miners showing improving momentum as gold holds elevated levels.
Medium-Term (1–6 months): Select juniors outperforming TSX on beta expansion.
Macro Influence: Gold bid on rate expectations and risk hedging.
Sector Bias: Bullish
📐 Technical Structure (Primary Driver)
Trend: Price firmly above rising 50-SMA; long-term trend constructive.
Momentum: RSI(2) reset into support zone, consistent with continuation pullbacks.
Pattern: Bullish pullback within an established uptrend; prior breakout above 0.60 holding.
Volume: Expansion on impulse leg; lighter volume on consolidation = constructive.
Key Levels
Support: 0.58 – 0.60
Resistance: 0.70 – 0.74
🎯 Trade Plan (Execution-Focused)
Entry: 0.60 – 0.62 (pullback into prior breakout + 50-SMA confluence)
Stop: 0.56 (loss of structure and trend invalidation)
Target: 0.74 (measured move into prior supply / range extension)
Risk-to-Reward: ~2.5R
Alternate Scenario: If price loses 0.58 on a closing basis, stand aside and reassess near the rising 50-SMA or prior base.
🧠 Swing Trader’s Bias
Price remains in a controlled uptrend above the 50-SMA with momentum resetting, not breaking. Looking for continuation from the 0.60–0.62 demand zone toward 0.74 for a clean 2.5R swing. A daily close below 0.56 invalidates the setup.

NQ Power Range Report with FIB Ext - 12/29/2025 SessionCME_MINI:NQH2026
- PR High: 25879.00
- PR Low: 25843.00
- NZ Spread: 80.5
No key scheduled economic events
Session Open Stats (As of 12:55 AM)
- Session Open ATR: 353.46
- Volume: 21K
- Open Int: 270K
- Trend Grade: Long
- From BA ATH: -2.2% (Rounded)
Key Levels (Rounded - Think of these as ranges)
- Long: 26521
- Mid: 25264
- Short: 24008
Keep in mind this is not speculation or a prediction. Only a report of the Power Range with Fib extensions for target hunting. Do your DD! You determine your risk tolerance. You are fully capable of making your own decisions.
BA: Back Adjusted
BuZ/BeZ: Bull Zone / Bear Zone
NZ: Neutral Zone

CMCT Squeeze Indicator AnalysisUsed the EMA 9, EMA 21, Squeeze Indicator, and ATR indicator to map out squeeze zones and price movement in the last month plus. The bulls over at CMCT have brass balls and diamond hands and have locked the float. Despite massive manipulation this thing is about to go to the moon. Last week they washed 60% SI down to 4% on Monday with no covering and just last Thursday accrued another 56% Live Short Interest just to suppress the momentum. The pressure cooker is boiling and the shorts keep trying to put the fire out with gasoline by continuing to short with 400% CTB. I am no chart guru, this is my first time posting a chart and my first time using any of these indicators. Regardless, Ive been hodling and accumulating for 2 weeks and can sense the shift. Now would be a great time to get in and HODL for 20+ Lets finish 2025 with a bang! BULLS UNITE!
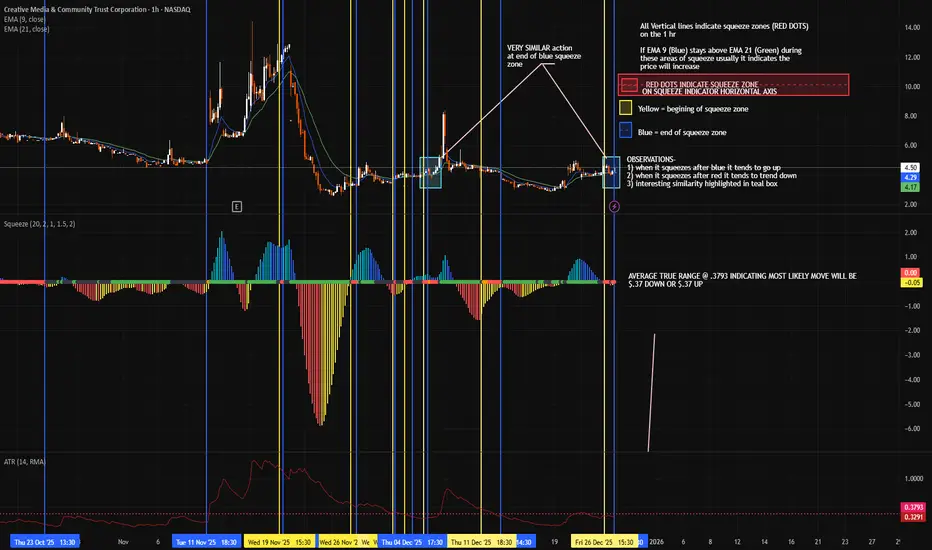
CMCT SQUEEZE IMMINENTUsed the EMA 9, EMA 21, Squeeze Indicator, and ATR indicator to map out squeeze zones and price movement in the last month plus. The bulls over at CMCT have brass balls and diamond hands and have locked the float. Despite massive manipulation this thing is about to go to the moon. Last week they washed 60% SI down to 4% on Monday with no covering and just last Thursday accrued another 56% Live Short Interest just to suppress the momentum. The pressure cooker is boiling and the shorts keep trying to put the fire out with gasoline by continuing to short with 400% CTB. I am no chart guru, this is my first time posting a chart and my first time using any of these indicators. Regardless, Ive been hodling and accumulating for 2 weeks and can sense the shift. Now would be a great time to get in and HODL for 20+ Lets finish 2025 with a bang! BULLS UNITE!

SLV | Next Leg Higher Is Here | LONGiShares Silver Trust seeks to reflect generally the performance of the price of silver. The Trust seeks to reflect such performance before payment of the Trust's expenses and liabilities. It is not actively managed. The Trust does not engage in any activities designed to obtain a profit from, or to ameliorate losses caused by, changes in the price of silver.

gravestone after a strong uptrend gravestone in past week, as long as its below past week high, a shortsell candidate with that stop into consideration.

ALUMINIUM trend may push it towards ATH the script is trading less than 10% away from ATH .
7 Days healthy consolidation already took place
the stock is trading with healthy volumes .
hindalco too trading healthy

$MSTR - Houston, we may have a problem...NASDAQ:MSTR is sitting at a very important spot on it's daily chart. It's important to monitor and consider the moves CRYPTOCAP:BTC makes when doing any sort of analysis on $MSTR. For this chart I have a CRYPTOCAP:BTC chart linked as well and it's also not looking the prettiest .
You'll see my fibonacci set up from the March 2025 lows > July 2025 highs for NASDAQ:MSTR here.
NASDAQ:MSTR broke below the 1.272 fib-extension and attempted to get back above it over the last ~7 trading days but open and closed below it on every daily candle, the weekly candle opened below that level and looks like the chances are ever-growing that it will close below that level as well. This is not a good indicator for a bullish thesis.
There is some possible positives for bulls though, many gaps have been made along the way down to the levels we are at. There are some descending RSI wedges on a few times frames that could result in a nice breakout to the upside if this recover or reverse here.
I'll be watching these levels closely to close out the year.
If there is a break below $153 I anticipate NASDAQ:MSTR will continue to dive down more with the Next Most Likely Reversal/Support Levels being at the 1.618 extension. This could be catastrophic for NASDAQ:MSTR based on their business model and the assumption here would be that CRYPTOCAP:BTC has not reversed either.
If there is a reclamation of the 1.272 fib level along with some CRYPTOCAP:BTC support you could expect some volatile moves to the upside.

Both Volatility Indexes Are Calm — That’s the SignalMarkets often focus on the TVC:VIX , but that only shows half of the risk picture.
This chart compares the two volatility indicators that really matter.
The VIX measures implied volatility in S&P 500 options.
It reflects equity sentiment, liquidity conditions, and demand for downside protection.
🟢 Low VIX usually signals confidence or complacency
🔴 High VIX reflects stress and risk aversion
The TVC:MOVE Index, on the other hand, measures implied volatility in U.S. Treasury yields.
It captures uncertainty around interest rates, inflation, and monetary policy — in other words, macro risk.
MOVE is often described as the VIX of the bond market.
Why the relationship matters
Bonds determine the discount rate used to value all assets.
Because of that, bond volatility tends to lead equity volatility.
Historically:
• Spikes in MOVE often come before spikes in VIX
• When rates reprice, equity multiples usually follow
What low VIX + low MOVE imply today
When both indicators are compressed:
• The market is pricing macro stability and policy predictability
• Volatility is cheap across asset classes
• Carry, leverage, and long-duration trades are encouraged
Risk hasn’t disappeared — it’s simply underpriced.
Key takeaway
Calm in both bonds and equities usually signals confidence…
or sets the stage for the next regime shift.
That’s why monitoring both VIX and MOVE matters far more than watching either one in isolation.

US 100 Index – Can the Year End Rally Continue?News released yesterday that Alphabet were going to buy data center partner Intersect in a deal worth around $5 billion to give it more power generation, alongside the on-going battle between Netflix and Paramount for Warner Bros has thrown the spotlight back on US stock indices, especially now that Larry Ellison, Chairman of Oracle and the world’s 5th richest man is now heavily involved in the deal.
Turning focus to the US 100 index, traders may now be wondering if it can turn its current 3 day winning streak into a longer string of daily gains, even pushing itself back up to challenge its record high set on October 30th at 26277, or whether the rally could run out of steam around current levels (25445, 0630 GMT).
With the Christmas Day holiday less than 48 hours away, today’s volatility driver could be the release of two pieces of US economic data. First up at 1330 GMT is the latest Q3 GDP growth update. Although it’s a second estimate, this could provide further insight into the current health of the US economy and shed some light on whether the market’s expectation of 2 further 25bps interest rate cuts from the Federal Reserve in 2026 is spot on, overblown or understated.
Then, next up is the US consumer confidence reading at 1500 GMT. This number has been under pressure in recent months with households worried about their financial situation and job security. Traders may be looking to see if the number has rebounded at all, which if it has, could be good news for spending and corporate profits over the important festive period.
Technical Update: Santa Rally Only Extends Sideways Range
If the latest 3.7% rally in the US 100 index from its December 17th low at 24644 can even be described as a “Santa rally,” it hasn’t so far at least brought too much in the way of Christmas cheer. As the chart below shows, price action is still trapped between the October 30th high at 26277 and the November 21st low at 23834, suggesting the index remains caught within a broad more balanced range at best.
As we move into the Christmas–New Year trading period, traders may be looking to identify key support and resistance levels to monitor in case a confirmed breakout triggers a more sustained move in the direction of the price break.
Potential Resistance Levels:
Following the latest price strength, the December 10th high at 25844 could now mark the first resistance level. While not a guarantee of further gains, closing breaks above 25844 may now be needed to open the way for additional price strength.
As the chart above shows, if the 25844 resistance were to give way on a closing basis the focus could then shift to the high from October 30th which stands at 26277. A break above that level could then open the way for scope for further upside.
Potential Support Levels:
Of course, the resistance levels highlighted above currently remain intact, and while they do price weakness can still emerge. If that happens, traders could be monitoring how the 25094 level is defended on a closing basis. This level represents half of the latest rally and could be the first support focus.
Closing breaks below 25094 could signal further price weakness, possibly leading to a test of 24644, which is the December 17th low. Closes below 24,644 could then warn of a deeper decline toward 23834.
The material provided here has not been prepared accordance with legal requirements designed to promote the independence of investment research and as such is considered to be a marketing communication. Whilst it is not subject to any prohibition on dealing ahead of the dissemination of investment research, we will not seek to take any advantage before providing it to our clients.
Pepperstone doesn’t represent that the material provided here is accurate, current or complete, and therefore shouldn’t be relied upon as such. The information, whether from a third party or not, isn’t to be considered as a recommendation; or an offer to buy or sell; or the solicitation of an offer to buy or sell any security, financial product or instrument; or to participate in any particular trading strategy. It does not take into account readers’ financial situation or investment objectives. We advise any readers of this content to seek their own advice. Without the approval of Pepperstone, reproduction or redistribution of this information isn’t permitted.

NQ Power Range Report with FIB Ext - 12/23/2025 SessionCME_MINI:NQH2026
- PR High: 25722.50
- PR Low: 25700.50
- NZ Spread: 49.0
Key scheduled economic events:
08:30 | Durable Goods Orders
- GDP
10:00 | CB Consumer Confidence
15:00 | New Home Sales
Session Open Stats (As of 12:15 AM)
- Session Open ATR: 405.86
- Volume: 16K
- Open Int: 267K
- Trend Grade: Long
- From BA ATH: -2.8% (Rounded)
Key Levels (Rounded - Think of these as ranges)
- Long: 26521
- Mid: 25264
- Short: 24008
Keep in mind this is not speculation or a prediction. Only a report of the Power Range with Fib extensions for target hunting. Do your DD! You determine your risk tolerance. You are fully capable of making your own decisions.
BA: Back Adjusted
BuZ/BeZ: Bull Zone / Bear Zone
NZ: Neutral Zone

BTC market regime change
BTC daily market regime changed.
Market environment looks different from last week.
I track market environment using:
- Trend vs Range
- High vs Low Volatility
Trend + High Vol -> Range + High Vol

NIFTY Quick View – Dec 23, 2025NIFTY Quick View – Dec 23, 2025
(Chart: )
Spot:
26177
Supports
30min: 26,000
|| 1D: 25,700
View
Supports dominate – no visible resistance.
Higher likelihood of testing support than reaching new all-time highs.
Trade Approach
Enter long calls on rejection at put strikes (support holds).
• Enter long puts on rejection at call strikes (upside fails).
Dynamic flip: Shift to inverse strikes when the initial direction weakens.
Clear levels only – no SL or targets provided.
You define your own setup.
DYOR – Options trading carries high risk! 📈
More details on my view
www.tradingview.com
www.tradingview.com
My Trading approach
www.tradingview.com

NQ Power Range Report with FIB Ext - 12/22/2025 SessionCME_MINI:NQH2026
- PR High: 25675.00
- PR Low: 25632.25
- NZ Spread: 95.75
Key scheduled economic events:
10:00 | Core PCE Price Index (MoM|YoY)
Weekend gap up 0.23% (open)
Session Open Stats (As of 12:15 AM)
- Session Open ATR: 425.74
- Volume: 25K
- Open Int: 269K
- Trend Grade: Long
- From BA ATH: -2.7% (Rounded)
Key Levels (Rounded - Think of these as ranges)
- Long: 26521
- Mid: 25264
- Short: 24008
Keep in mind this is not speculation or a prediction. Only a report of the Power Range with Fib extensions for target hunting. Do your DD! You determine your risk tolerance. You are fully capable of making your own decisions.
BA: Back Adjusted
BuZ/BeZ: Bull Zone / Bear Zone
NZ: Neutral Zone

PLTR GEX - Bull Flag Breakout SetupPLTR Technical & Options Setup Overview
PLTR is setting up a clean bull flag breakout on the daily chart, following a strong impulsive leg higher.
The consolidation has been holding above the 50-day moving average , which has acted as dynamic support throughout the flag structure. Two sessions ago price briefly dipped below the 50 SMA, but that weakness was immediately bought, signaling strong dip demand and structural acceptance above this level.
From an options perspective, the setup remains supportive. On the Feb 20 (Optimal Monthly) expiration, PLTR shows a Positive GEX Profile .
Volatility and skew conditions further strengthen the bullish case:
Core Call Pricing Skew is elevated (~36%), indicating persistent call demand
Implied volatility remains relatively low, leaving room for price expansion without volatility headwinds
Looking ahead, the next major reference is the 200 level , which represents the primary Core Resistance for the Optimal Monthly cycle. Given the compression within the bull flag and supportive options structure, 200 becomes a natural upside objective if the breakout confirms.
Structure to watch:
50 SMA – key trend support
Bull flag high – breakout trigger
Positive GEX – supportive dealer flow
200 – next major upside target (Core Resistance)
As long as price holds above the 50 DMA and volatility stays contained, risk remains skewed to the upside, with a measured breakout toward 200 favored.

NQ Power Range Report with FIB Ext - 12/19/2025 SessionCME_MINI:NQH2026
- PR High: 25257.50
- PR Low: 25209.75
- NZ Spread: 106.75
Key scheduled economic events:
08:30 | Core PCE Price Index (MoM|YoY)
10:00 | Existing Home Sales
Session Open Stats (As of 12:55 AM)
- Session Open ATR: 430.77
- Volume: 35K
- Open Int: 271K
- Trend Grade: Long
- From BA ATH: -4.1% (Rounded)
Key Levels (Rounded - Think of these as ranges)
- Long: 26521
- Mid: 25264
- Short: 24008
Keep in mind this is not speculation or a prediction. Only a report of the Power Range with Fib extensions for target hunting. Do your DD! You determine your risk tolerance. You are fully capable of making your own decisions.
BA: Back Adjusted
BuZ/BeZ: Bull Zone / Bear Zone
NZ: Neutral Zone

Two or one leg down to 23850 again
From Thursday's closed around 25 000, looks to me, like the downtrend channel may be maintained, with todays breakout failing. The 4 hourly rose up and was rejected at the 150 sma (pink arrow). So thinking it now will retest the 23850 lows.
I think it will do this in a 2 leg more or less equal measured move down. At an estimate first to ~24350, then less of a rally than the last couple we have had, and more of a slow retrace back to ~24500 - more flag like, then down 23850 ish. Though it could potentially do that in one move on friday. Possible, but a bit of a stretch for one day though, unless some rather dire news happens to coincide tomorrow. The visible range volume profile certainly seems to adequately accommodate a move to 24350, with little problem, while less so to ~24000k in my interpretation, yet, i still feel the price will need to go there as a significant low.
Of interest, it is also setting up to look similar to a period of last months chart - see set of three thin black arrows. If it stays similar this pattern, then that would suggest a one leg down move, like we had then. But that is a less probable scenario i think, barring any particularity bad news event. So this similarity is mentioned more as a point of interest, as it doesnt have a technical basis of which i am aware.
This could all be a load of nonsense of course, and it breaks out back up!

Positive GEX Profile Points Toward 700 Gap FillMETA – Holding Above HVL, 50 DMA Reclaim in Progress, Upside Call Resistance at 700
META is currently trading below the 200-day moving average , but recent price action suggests a potential structural improvement rather than continued weakness.
From an options perspective, the broader structure remains Positive GEX , indicating that dealer positioning is still supportive on pullbacks. At the same time, IV remains low , which typically favors range expansion and directional follow-through once key technical levels are reclaimed.
On the daily chart, price is now starting to reclaim the 50-day moving average , a level that previously acted as dynamic resistance. Importantly, META is also holding above the High Volatility Level (HVL) , which keeps the short-term regime constructive rather than defensive.
Volatility conditions remain favorable:
Call Pricing Skew is elevated (~31.6%), showing persistent call demand
IV remains controlled, allowing price to move without immediate volatility compression pressure
Looking forward, the most important upside call resistance is the 700 level, which represents:
Highest core call resistance on the Feb 20 (Optimal Monthly) expiration
A major gap fill from the prior breakdown
A clear technical resistance zone visible on the daily chart
This confluence makes 700 a logical upside target if price can hold above HVL and fully reclaim the 50 DMA.
Key structure to watch:
200 DMA – higher timeframe resistance overhead
50 DMA – short-term trend reclaim in progress
HVL – holding above keeps structure constructive
700 – primary upside target (gap fill + core call resistance)
As long as price holds above HVL with supportive GEX structure, rotational upside toward 700 remains the higher-probability path .

NQ Power Range Report with FIB Ext - 12/18/2025 SessionCME_MINI:NQH2026
- PR High: 24999.00
- PR Low: 24925.00
- NZ Spread: 165.5
Key scheduled economic events:
08:30 | Initial Jobless Claims
- CPI (Core|MoM|YoY)
- Philadelphia Fed Manufacturing Index
Session Open Stats (As of 12:55 AM)
- Session Open ATR: 426.70
- Volume: 36K
- Open Int: 266K
- Trend Grade: Long
- From BA ATH: -5.3% (Rounded)
Key Levels (Rounded - Think of these as ranges)
- Long: 26521
- Mid: 25264
- Short: 24008
Keep in mind this is not speculation or a prediction. Only a report of the Power Range with Fib extensions for target hunting. Do your DD! You determine your risk tolerance. You are fully capable of making your own decisions.
BA: Back Adjusted
BuZ/BeZ: Bull Zone / Bear Zone
NZ: Neutral Zone

Protective Put Support Zone & Gap FillAVGO – Breakdown Below HVL, Gap Fill Toward 320, Protective Put Support Zone
AVGO is trading in a high-volatility, momentum-driven downside phase , following a clean breakdown below the HVL. The move marks a clear regime shift, as price exited a tight transition zone and accelerated lower with conviction.
The downside was well signaled by sustained put-side pressure over multiple sessions, with price repeatedly rejecting from the 50 EMA . Once HVL failed, downside momentum expanded rapidly, consistent with a retail-driven move rather than a controlled dealer-defended range.
From an options structure perspective, protective put positioning now defines the next meaningful downside reference. Current positioning shows the next major protective put support clustered around 320 , which also aligns with a clean gap-fill level on the chart.
This makes 320 a dual-confluence area:
technical gap fill
protective put floor where dealer hedging dynamics may begin to dampen downside momentum
Until that zone is reached, price is effectively moving through thin structure, where volatility expansion and sharp intraday swings should be expected.
Key levels & structure:
Below HVL → bearish regime confirmed
50 EMA → repeated rejection, trend continuation signal
320 → primary downside target & potential stabilization zone (gap fill + protective puts)
Any stabilization or bounce attempts are more likely to occur only after interaction with the 320 area, not before.

NQ Power Range Report with FIB Ext - 12/17/2025 SessionCME_MINI:NQH2026
- PR High: 25363.00
- PR Low: 25294.25
- NZ Spread: 154.0
No key scheduled economic events
Session Open Stats (As of 12:25 AM)
- Session Open ATR: 414.92
- Volume: 32K
- Open Int: 246K
- Trend Grade: Long
- From BA ATH: -4.0% (Rounded)
Key Levels (Rounded - Think of these as ranges)
- Long: 26521
- Mid: 25264
- Short: 24008
Keep in mind this is not speculation or a prediction. Only a report of the Power Range with Fib extensions for target hunting. Do your DD! You determine your risk tolerance. You are fully capable of making your own decisions.
BA: Back Adjusted
BuZ/BeZ: Bull Zone / Bear Zone
NZ: Neutral Zone
