GOLD - Consolidation amid a bullish trend. To ATH?FX:XAUUSD , after retesting its ATH (to the 4375 zone), is falling amid weak US inflation data. The dollar is strengthening, but despite this, gold is in a bullish trend.
US inflation (CPI) for November was lower than expected, but Trump's statements about the future “dovish” Fed chair are limiting the decline in gold. The market continues to expect the Fed to ease policy in 2026.
Today, data on the US consumer confidence index will be released.
Short-term pressure remains, but the fundamental background does not allow us to talk about a trend reversal. The market structure is bullish, but there is a magnet zone below: 4310 - 4300. MM is likely to test it before moving towards ATH and updating highs...
Resistance levels: 4330, 4353, 4375
Support levels: 4308, 4300, 4291
The dollar is forming a temporary correction due to fundamental factors. A weak dollar will support gold...
The 4308-4300 zone is a liquidity pool, and the market may test this area amid the dollar correction. A long squeeze could bring the market back to growth.
Best regards, R. Linda!
Wave Analysis

Spx lowerI'm in the hospital and using the app to trade. Hopefully I'll be out of here today or tomorrow.
I think it's a short from here 10:05 Eastern. If they continue rallying the rest of today, I'm wrong. From here we should test and possible break the lows.
Good luck 🤞

Bitcoin Hits Critical Support — Is Another Dump Coming?As I expected in the previous idea , Bitcoin has broken through its support lines and declined to the support zone($86,300-$85,140), reaching its full target in the process.
Currently, Bitcoin( BINANCE:BTCUSDT ) is moving near the support zone($86,300-$85,140), and we need to watch whether it will break through this support or begin to rebound.
Before diving into the analysis, it’s important to note that Bitcoin has a strong correlation with the S&P 500 index( SP:SPX ). Given that the S&P 500 is currently in a downward trend, it’s likely that Bitcoin will also experience further declines.
From an Elliott Wave perspective, it seems that Bitcoin is currently starting a new five-wave downward sequence following the break of its support lines, which could lead to even lower levels.
Looking at recent developments, one reason for Bitcoin’s decline is the selling pressure from long-term holders, which has created a quiet but significant downward pressure and challenged the support levels. Additionally, the state of the U.S. markets, with the S&P 500 index also trending down, contributes to the downward pressure on Bitcoin.
In conclusion, I expect that Bitcoin, upon entering the resistance zone($89,230-$87,720) and touching the resistance lines, will again face downward movement and aim for the support zone($86,300-$85,140). If it breaks that support zone, we could see it moving towards Cumulative Long Liquidation Leverage($85,300-$83,000).
Cumulative Short Liquidation Leverage: $89,000-$88,500
Cumulative Short Liquidation Leverage: $91,830-$90,000
Cumulative Short Liquidation Leverage: $98,400-$97,000
Note: If Bitcoin breaks below the $83,000 mark with strong momentum, we might expect it to reach even lower levels, potentially down to $80,000.
Do you think Bitcoin can break the support zone($86,300-$85,140)?
First Target: $85,540
Second Target: $84,229
Stop Loss(SL): $90,429(Worst)
Points may shift as the market evolves
💡 Please respect each other's opinions and express agreement or disagreement politely.
📌Bitcoin Analysis (BTCUSDT), 4-hour time frame.
🛑 Always set a Stop Loss(SL) for every position you open.
✅ This is just my idea; I’d love to see your thoughts too!
🔥 If you find it helpful, please BOOST this post and share it with your friends.

GBPUSD - Relief Rally Into Resistance? Sellers Watching Closely📉GBPUSD remains overall bearish on the higher timeframe. Price is still trading within a descending structure, and the broader trend continues to favor sellers rather than buyers.
The recent upside move is best viewed as a corrective bounce, not a trend reversal. Price is now approaching a key confluence zone, where the former structure, horizontal resistance, and the descending trendline align.
This is the type of location where trend-following shorts become interesting. I’m not interested in selling blindly, but rather in waiting for lower-timeframe bearish confirmation once price reacts at this resistance zone.
⚔️As long as price remains below the descending trendline and fails to reclaim the range above, the bearish bias stays intact. A clean break and hold above this resistance would be the only thing that forces a reassessment.
For now, this looks like sellers getting another chance at a better price.
Will this resistance cap the move once again, or do bulls finally break the structure? 🤔
⚠️ Disclaimer: This is not financial advice. Always do your own research and manage risk properly.
📚 Stick to your trading plan regarding entries, risk, and management.
Good luck! 🍀
All Strategies Are Good; If Managed Properly!
~Richard Nasr

BTC is not A BEAR untilI explore some key levels that would suggest what would mark the beginning to a larger bear move and break of a muti year bullish structure. We also look at the Dec seasonality of December over the life of the trend

GOLD - A pullback ahead of the news. Will there be growth?FX:XAUUSD is hitting resistance at 4350-4360 and forming a correction amid expected inflation and initial jobless claims data
Mixed US employment data supports expectations of Fed policy easing. The market is pricing in two rate cuts in 2026 versus one in the Fed's forecasts, which supports the bullish trend for the metal.
Today's US CPI release will be a key trigger for reassessing the Fed's rate trajectory.
Expectations of tighter policy from the Bank of Japan and market reassessment are creating overall caution.
A short-term correction in gold is possible, but the overall uptrend remains intact amid the Fed's dovish monetary policy and global uncertainty.
Resistance levels: 4337, 4353
Support levels: 4311, 4300
Technically and fundamentally, the situation is favorable for continued growth. Corrections allow the market to gather liquidity before movement, however, there is news ahead that will determine further movement. I expect a retest of 4311 - 4300 before growth to 4353 - 4380.
Sincerely, R. Linda!

SOLANA WYCOFF ACCUMULATION Solana, like many cryptocurrencies, has been absolutely slammed to the downside, falling over 50%, which has pushed the market into what many are calling the early stages of a bear market. As a result, many market participants are now panicking and exiting their positions, with the Crypto Fear & Greed Index dropping below levels seen during the recent tariff-related sell-off.
From a fundamental perspective, the market does appear quite weak and seems to be searching for any excuse to continue lower. However, from a mechanical and technical standpoint, it is not statistically probable for price to move straight down in a single, uninterrupted direction. Relief rallies are a natural part of market structure, as they allow new capital to enter short positions on rallies, depending on how far price is able to retrace.
Technically, I believe I have identified a textbook Wyckoff accumulation pattern, with a potential “spring” having just been put in. This presents a relatively low-risk opportunity, as there is a clearly defined invalidation point with a stop-loss placed below the spring low. Ideally, an entry would be taken on the first backtest of the Secondary Test (ST) level, around the $121–$122 area.
It will be interesting to see whether Solana has enough momentum to produce a meaningful relief rally, which could potentially turn explosive if broader market conditions begin to improve.

DodgeCoin About to Hit Major Support Level - Whales Alert!Is this what they are waiting for? Whales expecting to buy Dodge at pennies? :) and pump it up again!
Main Reason is that, people are waiting and observe the market, This behaviour actuate the inactive behaviour of the Dodge and many other cryptos. Once there is none to minor trading activity / trading volume is present, then the market panic selling and crash happens. With selling market activity rises, but with the huge volumes are on short side, the value become more and more under the selling pressure. Then the long wait and no much gains, then the 2nd major selling wave, and loop happens until it hits a major support level.
Here we are waiting, just need to see some green light...
Then the waves of undervalued DodgeCoin, SOL to be more prominent and trending once again.
People are saying Dodge will hit below pennies, I think those are the people pump and dump news, once there is a dump, then the penni whales come-in and leave others in Jaw dropped state.....
Hold up people, buy when you can and be active on the network.
That's valid for any market...

USDJPY Wait For The Beak!The Bank of Japan just hiked interest rates by 25 bps to 0.75%, the highest level in ~30 years. FED lowering while BOJ raising rates is bad juju for the carry trade.
Why carry risk is rising
BOJ hikes = funding cost up. Yen is no longer “free money.”
Fed cuts = yield advantage shrinking. The whole carry equation weakens.
Compression kills carry. You don’t need parity — you just need the gap to narrow.
What actually breaks carry trades
Not the BOJ hike
Not the Fed cut
The moment markets believe the trend is durable
Carry trades die on expectations, not announcements.
Keep an eye out for the breakout.
If carry breaks, bad juju for Crypto & AI trade,

NVDIA ANALYSISFirst of all, my main focus in trading is Crypto but I also examine US stocks once in a time.
As I can understand from the chart in here, there is a high possibility that Nvdia is about to face a crash.
For the ones who comes to my profile for the first time, please here me out for a bit.
Technical outlook:
I'm an Elliott analysist and I always use waves to gauge the price and as I can see by my calculations, Nvdia has already finished its short term 5 wave impulsive upward move.
Low volume and shift in market structure supports this thought as well.
Moreover, if you want a simpler explanation; there is also a head and shoulders pattern formed right in here as well which also signaling a contuniuation thorugh downwards.
What I believe is that there is a high chance for a double Zig-Zag corrective pattern to form for the long run. For now, let's focus on the demand zone. I believe that zone will be the first A point of A-B-C corrective Zig-Zag move.
Fundemental factors:
Today we have witnessed that US has announced its inflation is way lower than expectation (%2.7). Expectation was way too much (%3.1) and it means that FED will not be willing to cut the interest rates for the new quarter of the new year which is going to be very bearish.
Moreover, Tomorrow Bank of Japan (BOJ) will announce its interest rate hike. The problematic thing is that some officials and bank menagers from Japan pointed out that Japan may actually want to increase its intertest rates even more next year by March 2026.
The biggest problem about the news lies just in here.
Yes, FED is pumping more money to people and Trump is going to be doing tax refunds and all but we can't ignore the macro news and other events.
I believe that 2026 will start very bad for the markets like Crypto or Nasdaq but I also see a very green light in the end of the tunnel as well. Second quarter might be way more profitable if you play this carefully.
Thanks for reading.

Gold 1H – CPI Data Uncertainty Fuels Liquidity Traps at Extremes🟡 XAUUSD – Intraday Smart Money Plan | by Ryan_TitanTrader (19/12)
📈 Market Context
Gold is trading in a tightly engineered range as markets digest the latest U.S. CPI print, which has drawn caution from economists over data reliability and seasonal distortions.
Despite headline inflation showing signs of cooling, analysts warn the data lacks clarity, keeping the Fed firmly data-dependent and USD flows unstable.
This uncertainty-driven backdrop favors liquidity manipulation over clean trends, with Smart Money likely probing both premium and discount zones to trigger stops before committing to expansion.
🔎 Technical Framework – Smart Money Structure (1H)
Current Phase: Rising structure losing momentum near premium supply
Key Idea: Expect liquidity interaction at 4363–4365 (premium) or 4300–4298 (discount) before displacement
Structural Notes:
• Higher-timeframe bullish BOS remains valid but is pausing
• Multiple rejections near highs suggest distribution, not confirmed reversal
• Equal highs above 4360 and sell-side liquidity below 4300 are exposed
• Price is rotating inside a controlled liquidity channel
Liquidity Zones & Triggers:
• 🔴 SELL GOLD 4363 – 4365 | SL 4370
• 🟢 BUY GOLD 4300 – 4298 | SL 4290
Institutional Flow Expectation:
liquidity sweep → MSS / CHoCH → BOS → displacement → FVG / OB retest → expansion
🎯 Execution Rules (matching your exact zones)
🔴 SELL GOLD 4363 – 4365 | SL 4370
Rules:
✔ Sweep above recent equal highs into premium
✔ Bearish MSS / CHoCH on M5–M15
✔ Clear downside BOS with impulsive displacement
✔ Entry via bearish FVG refill or refined supply OB
Targets:
1. 4340
2. 4320
3. 4302 – extension if USD firms post-CPI reassessment
🟢 BUY GOLD 4300 – 4298 | SL 4290
Rules:
✔ Liquidity grab below sell-side lows / channel support
✔ Bullish MSS / CHoCH confirms demand control
✔ Upside BOS with strong bullish displacement
✔ Entry via bullish FVG fill or demand OB retest
Targets:
1. 4325
2. 4350
3. 4380 – extension if CPI skepticism weakens USD
⚠️ Risk Notes
• CPI-related uncertainty increases fake breaks — wait for structure
• No entry without MSS + BOS confirmation
• Expect volatility during U.S. session
• Reduce risk near unscheduled Fed or inflation commentary
📍 Summary
Today’s gold setup is driven by CPI-driven uncertainty and Fed caution, creating prime conditions for liquidity engineering:
• A sweep above 4365 may fade toward 4300–4320
or
• A liquidity grab near 4300 could reload bullish flow toward 4350+
Let structure confirm — Smart Money reacts, retail anticipates. ⚡️
📌 Follow @Ryan_TitanTrader for daily Smart Money gold breakdowns.

Tesla - The next bullrun is coming!🚗Tesla ( NASDAQ:TSLA ) is clearly breaking out:
🔎Analysis summary:
In mid 2025, Tesla perfectly retested a major confluence of support. After Tesla then created bullish confirmation, the recent strong rally was totally expected. And with the current triangle breakout, Tesla is just starting its next major parabolic rally much higher.
📝Levels to watch:
$400 and $600
SwingTraderPhil
SwingTrading.Simplified. | Investing.Simplified. | #LONGTERMVISION

Elise | BTCUSD - 30M | Corrective Channel After Liquidity SweepBITSTAMP:BTCUSD
After rejecting from the prior supply zone, BTC swept sell-side liquidity and rebounded strongly. The current price action shows compression inside an ascending channel, suggesting buyers are active but momentum is still corrective. Upside continuation requires acceptance above the channel high and prior intraday resistance.
Key Scenarios
✅ Bullish Case 🚀 → Sustained 30M close above 89,000 – 89,200 opens upside toward 90,200 and 91,200.
❌ Bearish Case 📉 → Breakdown below channel support and a close under 87,400 exposes 86,200 – 85,500 demand.
Current Levels to Watch
Resistance 🔴: 89,200 – 90,200
Support 🟢: 87,400 – 86,200
⚠️ Disclaimer: This analysis is for educational purposes only. It is not financial advice.

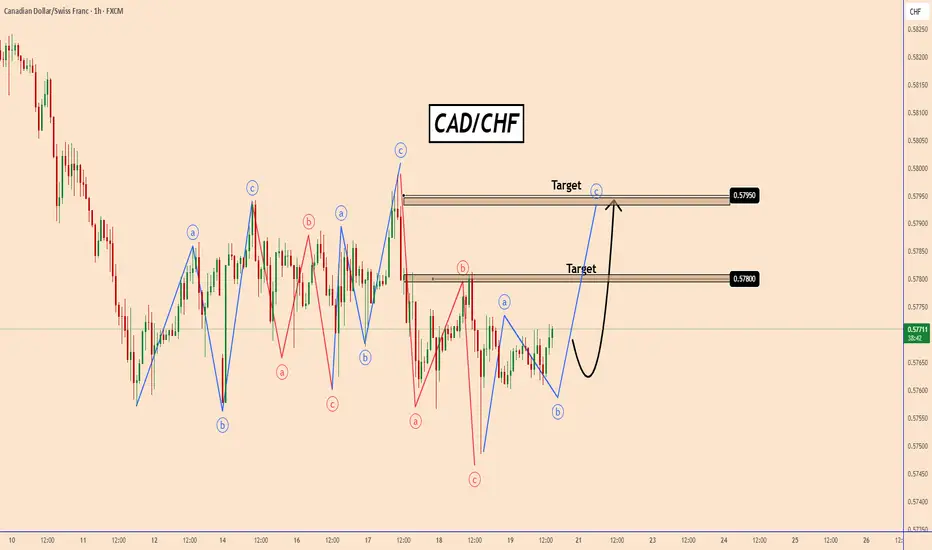
CADCHF – Corrective ABC Near Completion, Wave C in FocusCADCHF – Corrective ABC Near Completion, Wave C in Focus
CADCHF is moving within a large corrective pattern which is taking shape with corrective waves ABC.
At the moment it seems that corrective wave B is about to end and CADCHF may start impulsive wave C which could push CADCHF even above the corrective zone this time.
However, at the moment we are only seeing a short term trading opportunity with targets: 0.5780
0.5795
You may find more details in the chart!
Thank you and Good Luck!
PS: Please support with a like or comment if you find this analysis useful for your trading day
GOLD Is Going Down! Sell!
Here is our detailed technical review for GOLD.
Time Frame: 1D
Current Trend: Bearish
Sentiment: Overbought (based on 7-period RSI)
Forecast: Bearish
The market is trading around a solid horizontal structure 4,340.66.
The above observations make me that the market will inevitably achieve 4,164.19 level.
P.S
We determine oversold/overbought condition with RSI indicator.
When it drops below 30 - the market is considered to be oversold.
When it bounces above 70 - the market is considered to be overbought.
Like and subscribe and comment my ideas if you enjoy them!

Bitcoin ... BTCUSD ... BITCOIN / $ .Bitcoin on Diamond 💎 pattern formation at the bottom.
Target price 94600$ - 94700$ .
All the best 👍

The Big Long — BTCUSDT📈 The Big Long — BTCUSDT
Bias: Long
Timeframe Resonance: D1 & W
🧠 Market View:
BTC is preparing for a major bullish wave driven by daily and weekly frequency resonance. This is a higher-timeframe setup, favoring patience and capital allocation rather than chasing price.
🔹 Entry Zones (scale in):
75,000
83,000
85,000
🔹 Close / Take Profit Zone:
110,000 – 118,000
📌 Execution Plan:
Allocate capital across the listed entry zones
Let higher-timeframe momentum do the work
Avoid overtrading lower timeframes during the move
🧠 Mindset:
When D1 and W resonate, volatility expands in your favor.
Prepare early — the market rewards positioning, not emotion.
This content is for market perspective sharing only and does not constitute financial advice.

Bitcoin .. BTCUSD .. BITCOIN / Dollar $Cup and Handle pattern
1 2 3 inversal pattern
Target price 94312$ ...
Chart updated .. 🎯🎯🎯

EURUSD Bullish Breakout IncominEURUSD shows a clear liquidity grab near demand, forming higher lows and compression—expect a bullish expansion toward 1.1760–1.1800 if price holds above 1.1700.risk managment is important

EURUSD H1 Intraday Outlook – Dec 19, 2025EURUSD is trading around 1.17127 on the H1 chart after a sharp sell-off from the highs and a clear shift into sideways compression. Price is repeatedly testing the lower boundary (pink line) while forming a sequence of tight swings (liquidity building). In this environment, the highest-probability trades usually come from range edges and confirmed breakouts, not the middle.
Market Structure (H1): Distribution → Compression → Expansion Setup
The initial down-leg broke the prior bullish rhythm.
Since then, price is printing repeated tests of the same floor (support), while the top side is capped by a mid-range resistance zone (green band).
This is typical “accumulation-style” behavior: multiple swings inside the box, then an expansion toward the next major liquidity pool.
Key Support and Resistance Levels
Major Resistance
1.1765 – 1.1768: key supply / breakout trigger (green zone)
1.1800 – 1.1810: major high / liquidity target (top pink line)
Major Support
1.1710 – 1.1712: primary demand / range floor (bottom pink line)
1.1685 – 1.1690: next support pocket if 1.1710 fails (lower continuation area)
Fibonacci Levels (Best Confluence Zones)
Apply Fibonacci from the recent swing low near 1.1710 to the swing high near 1.1800:
0.382 ≈ 1.1766 (aligns tightly with the green resistance zone)
0.50 ≈ 1.1755 (midpoint pivot; often the “decision” level on pullbacks)
0.618 ≈ 1.1744 (reclaim zone; if price holds above here, upside attempts improve)
Practical takeaway: 1.1744–1.1766 is the “engine room” for the bullish continuation attempt. The market needs to reclaim and hold this band to open a clean path back to 1.1800.
Trendline Read (Simple Confirmation Tool)
Draw a short-term descending trendline across the lower highs inside the range:
A bullish setup strengthens when price breaks the descending trendline and then prints a higher low above 1.1710.
A bearish continuation strengthens when price breaks below 1.1710 and fails the retest (support flips to resistance).
EMA & RSI Filters (Execution Rules)
Even if your chart template differs, these filters keep the entries clean:
EMA (20/50) Filter
Bullish bias improves when price is above EMA50 and EMA20 starts turning up.
If price is repeatedly rejected under EMA50 near 1.1744–1.1766, treat rallies as corrective.
RSI (14) Filter
A constructive bullish range typically holds RSI above 50 on dips.
If RSI remains below 50 while price can’t reclaim 1.1744–1.1766, the downside breakout risk increases.
High-Probability Trading Plans (Intraday)
Scenario A: Buy the Range Floor (Best R:R if Confirmed)
Entry idea
Buy near 1.1710–1.1712 only after confirmation (H1/M15 bullish engulfing, strong rejection wick, or a clear higher low)
Targets
TP1: 1.1744
TP2: 1.1765–1.1768
TP3: 1.1800–1.1810 (only if breakout holds)
Invalidation
H1 close below 1.1710, or breakdown + failed reclaim
Scenario B: Buy the Breakout (Highest Quality If It Triggers)
Trigger
H1 close above 1.1765–1.1768, then a retest that holds
Targets
TP1: 1.1785
TP2: 1.1800–1.1810
Stop
Back below the retest swing low (or back inside the broken zone)
Scenario C: Sell the Breakdown (Only If Support Fails)
Trigger
H1 close below 1.1710, then retest fails under 1.1710–1.1712
Targets
TP1: 1.1690
TP2: 1.1685–1.1680
Stop
Above the failed retest high (back inside the range)
What to Watch Next
This session is defined by two levels:
1.1710 decides whether the floor holds (range continuation / reversal attempt).
1.1765–1.1768 decides whether bulls regain control (breakout path to 1.1800).
Save these levels and follow the next update if you want the trade plan adjusted once EURUSD either confirms the breakout above 1.1768 or breaks and retests below 1.1710.

HYPE, short term bullish retraceCurrently on the 0.705 macro we are readdy for a good retrace, to restest the NYSE:HR POC, we long the trap with success and let it run

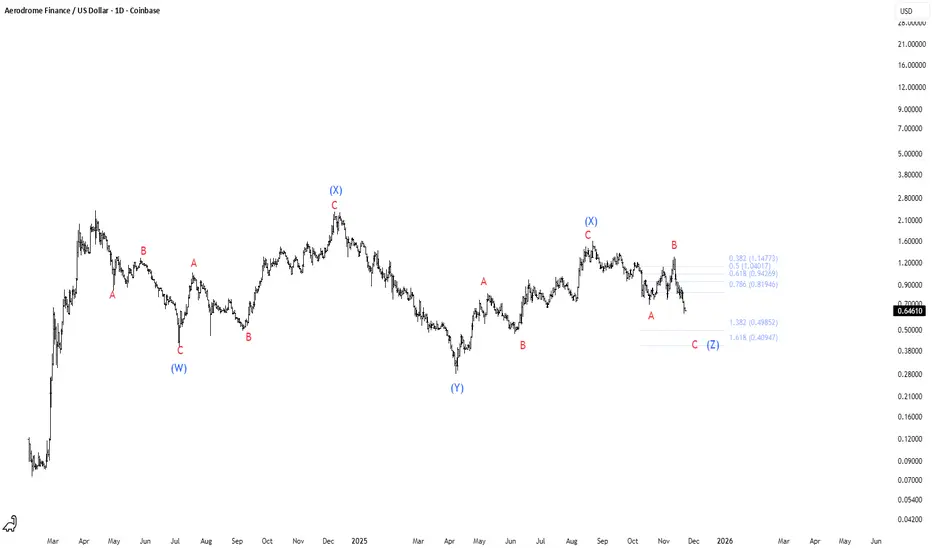
AERO = Game Over!🔻 AERODROME (AERO) – Bearish Elliott Wave Breakdown
AERO is moving exactly in line with a large W–X–Y–X–Z corrective pattern 📉, and price is now rolling over from the latest B-wave rejection. This breakdown strongly suggests the final Z-wave C-leg is unfolding, with bearish momentum strengthening and every bounce getting weaker 🚫📈.
The structure continues to respect corrective symmetry, and the market has failed to reclaim key B-wave Fib zones — classic bearish continuation behavior.
The downside roadmap is clear and Fibonacci levels now become the key magnets 🎯👇:
🔹 1.382 extension → ~$0.4985
🔹 1.618 extension → ~$0.4094
Both align perfectly with typical Z-wave depth and prior corrective proportions. No bullish divergence, no impulsive reversal signs, and no reclaim of lost structure — meaning sellers still have full control 🟥💪. As long as AERO continues printing lower highs + lower lows, the bearish bias stays firmly intact.
This makes the $0.50 → $0.41 zone the main expectation area for a potential macro bottom or reaction bounce 📌. Until then, trend remains down, momentum favors sellers, and the Fib cluster below is the primary target zone.
⚠️ Bias: Bearish
🎯 Targets: $0.50 → $0.41
S&P 500 index at PRZ — Next Bullish Rally!!!In general, I place significant importance on the S&P 500 index( SP:SPX ), especially over the past month, because of its strong correlation with the crypto market, particularly Bitcoin( BINANCE:BTCUSDT ). When sharp movements occur in the S&P 500 index, we often see a mirrored effect in the crypto market and Bitcoin’s chart.
Currently, the S&P 500 index is moving near the support zone($6,776_$6,712) and the Potential Reversal Zone(PRZ) , and it appears to have successfully broken the upper line of the descending channel, which is a positive sign for a continued bullish trend in the coming days.
From an Elliott Wave perspective, it seems that the S&P 500 has completed a zigzag correction(ABC/5-3-5) within the descending channel, and we can expect an upward wave towards the resistance zone($6,853_$6,823).
I expect that the S&P 500 will begin to rise again from the Potential Reversal Zone(PRZ) and could climb at least up to $6,816. If it breaks resistance zone($6,853_$6,823), we can expect even more gains, which can also positively impact the broader markets.
What’s your outlook on the S&P 500 index and the U.S. stock market?
First Target: $6,816
Second Target: $6,834
Stop Loss(SL): $6,739(Worst)
Note: During U.S. trading hours, market volatility and emotions tend to increase. Please make sure to apply strict risk and capital management.
💡 Please respect each other's opinions and express agreement or disagreement politely.
📌S&P 500 Index Analyze (SPX500USD), 1-hour time frame.
🛑 Always set a Stop Loss(SL) for every position you open.
✅ This is just my idea; I’d love to see your thoughts too!
🔥 If you find it helpful, please BOOST this post and share it with your friends.
