Bitcoin - Will hit 135k in the short-term, Elliott and FIBOBitcoin is rising! That's what everyone sees at the moment, but we don't want to get drunk and establish our profit target. Where to take profit? Because we are in the price discovery mode, there is no previous price action above the current price. At this moment we really cannot use any horizontal lines, gaps, volume profiles, imbalances, previous ranges, or previous swing highs to establish our profit target. So we have to use special tools, such as Fibonacci extension or Elliott Wave.
The Fibonacci extension is a great tool - in bitcoin's case we have a 1:1 FIB extension sitting at 135,096. This level is also in confluence with a major trendline that we can see on the chart. This gives us a really good profit target in the short term for this particular trade. This is also an opportunity to short Bitcoin here, if you trade futures. From the Elliott Wave perspective, we are in wave (3), so I made a prediction on where this wave should terminate and also where wave (5) should terminate. I think my analysis definitely makes sense! Please share your analysis in the comment section, only copy your link here.
Trading tip at the end: Avoid the Obvious / Market Traps - Some obvious trading situations are kind of a trap where the chances are that everyone else has also spotted a wonderful trade situation which eventually sets you up for a disaster. Many people get trapped in some obvious good looking trades. Some obvious trades can sometimes be the market traps as they are hyped, professional traders stay away from these traps. Write a comment with your altcoin + hit the like button, and I will make an analysis for you in response. Trading is not hard if you have a good coach! This is not a trade setup, as there is no stop-loss or profit target. I share my trades privately. Thank you, and I wish you successful trades!
Wave Analysis

BITCOIN → Stopping after the rally? What next? 125K or 110K?BINANCE:BTCUSDT rose and updated its historical maximum to a new record of 118K with “kopecks” (different prices on different exchanges). Now the price has supposedly stopped and entered a consolidation phase, but it is too early to draw any conclusions based on this alone...
Fundamentally, Bitcoin rose following the SP500 and NQ100 indices. The reasons are clearly geopolitical. The correlation level is not high, but the flagship is following the stock indices, which are also updating their historical highs.
Technically, Bitcoin has emerged from a two-month consolidation and entered a realization phase. So what's next? Continuation of the phase or correction? Let's take a look.
On the daily chart, I would highlight two zones. The risk and sell zone is below 117,500. If the price closes below this zone today/tomorrow, we will most likely be able to look for signals for a possible correction. As part of the correction, we can expect a decline to 115,500, 114,300, or even to the old ATH of 112K.
The second zone is the buying zone. A closing price above 118,400–118,900 and consolidation with the gradual formation of a breakout of structure may hint at a possible continuation of growth toward psychological targets.
Resistance levels: 118,400, 118900
Support levels: 117100, 116700, 115500
In the chart above, I have highlighted the situations, levels, and zones that interest me more precisely.
Now I am waiting for Bitcoin to retest resistance or support and confirm certain levels, based on which decisions can be made. I think that in the near future, Bitcoin will show us where it is headed. Updates will be published as something interesting emerges...
Best regards, R. Linda!

Hellena | GOLD (4H): LONG to resistance area of 3397 (Wave 3).Dear colleagues, my previous forecast remains valid, but I have decided to update it.
At the moment, I still think that wave “3” of the medium order continues its upward movement.
At the moment, I think that the small correction in wave “2” is ending and we will see a continuation of the trend. I see the resistance area of 3397.94 as the target. The main thing is to overcome the local level of the small wave “1” at 3366.37.
Manage your capital correctly and competently! Only enter trades based on reliable patterns!

GOLD → Consolidation. Long squeeze before growth to 3400FX:XAUUSD has broken through resistance at 3353-3357 since the session opened, and bulls are currently trying to keep the market in the buying zone. Should we expect a long squeeze before growth?
Gold is in local consolidation after breaking through a key level. The price is still in the consolidation phase formed during a week-and-a-half correction. The price reached a three-week high of $3,374 on Monday but fell after the EU's conciliatory statements. Investors are awaiting US inflation data and Chinese GDP figures as they assess the prospects for a Fed rate cut. Heightened geopolitical and trade tensions are keeping demand for safe-haven assets high.
Technically, gold has entered a local buying zone, but there is a fairly complex resistance zone above it, and consolidation is needed to break through it. Such patterns could include a retest of support and a liquidity grab before growth.
Resistance levels: 3373, 3394
Support levels: 3357, 3353, 3345
There is a possibility of a retest of eql 3353 in a long squeeze format and a return to resistance at 3373 for a breakout. I also do not rule out a retest of the key level of 3345. The global trend is bullish, with the price locally in a fairly wide range, with an emphasis on the support zone of 3345-3355. If the bulls can hold this zone overall, the market will have a good chance of rising to 3400-3450
Best regards, R. Linda!

GBPUSD → Correction amid a global bullish trend...FX:GBPUSD is testing the 1.345 - 1.35 area as part of a correction. The price is closing the imbalance zone and testing support, which may trigger a reaction. Further developments will largely depend on the dollar, which is testing resistance.
The daily market structure is quite strong. The correction against the backdrop of a strong trend is within acceptable limits, and bulls should fight to keep the price away from risk zones. GBPUSD, as part of the correction, closes the imbalance zone of 1.34 - 1.35 (0.7 - 0.79f) and forms a false breakdown of the intermediate support level of 1.3476. If buyers hold their ground in the 1.347-1.35 zone, the currency pair will be able to return to the global trend.
Support levels: 1.3476, 1.345, 1.3382
Resistance levels: 1.3511, 1.359, 1.375
Price consolidation above 1.349 - 1.350 will confirm the market's intentions. In this case, we can expect growth to 1.36 - 1.374.
Best regards, R. Linda!

Bitcoin Roadmap=>End of RallyBitcoin ( BINANCE:BTCUSDT ) has gained nearly +10% in the recent weekly candle so far. The question is where this rally could end up. So to get to that zone, let’s go to the weekly timeframe .
Before we start this analysis, let’s take a look at my last analysis on the weekly timeframe , which was well into the Potential Reversal Zone(PRZ) . ( Analysis time: 9 JUN 2025 )
Bitcoin has now entered the Potential Reversal Zone(PRZ) and Time Reversal Zone(TRZ=June 23 to August 4) , and these zones could be the zones where this Bitcoin rally will end. Do you agree with me?
In terms of Elliott Wave theory , Bitcoin appears to be completing a main wave 5 , as the main wave 3 was an extended wave . The main wave 5 could end at the Potential Reversal Zone(PRZ) .
I expect Bitcoin to start a main correction from the Potential Reversal Zone(PRZ) and could continue to support lines and near the $105(at least) .
What do you think about the end of the Bitcoin rally?
Note: Sell orders near $120,000 are very heavy.
Note: Cumulative Long Liquidation Leverage attractive volume for liquidation.
Note: If Bitcoin goes above $130,000, it can continue to rise to the Resistance lines (near $150,000).
Please respect each other's ideas and express them politely if you agree or disagree.
Bitcoin Analyze (BTCUSDT), weekly time frame.
Be sure to follow the updated ideas.
Do not forget to put a Stop loss for your positions (For every position you want to open).
Please follow your strategy and updates; this is just my Idea, and I will gladly see your ideas in this post.
Please do not forget the ✅' like '✅ button 🙏😊 & Share it with your friends; thanks, and Trade safe.

Gold Breakout and Potential RetraceHey Traders, in tomorrow's trading session we are monitoring XAUUSD for a buying opportunity around 3,340 zone, Gold was trading in a downtrend and successfully managed to break it out. Currently is in a correction phase in which it is approaching the retrace area at 3,340 support and resistance area.
Trade safe, Joe.

GBPUSD: Poised for more decline next weekGBPUSD: Poised for more decline next week
GBPUSD completed another bearish pattern on Friday and fell again.
In my personal opinion, it is a bit unclear all this bearish momentum in many GBP pairs, however, GBPUSD remains well positioned for further declines.
Over the coming week, the focus should be on inflation data from the UK and the US. Perhaps this could be enough of a catalyst and support the downward movement in the same way that the pattern indicates.
You may find more details in the chart!
Thank you and Good Luck!
PS: Please support with a like or comment if you find this analysis useful for your trading day
Disclosure: I am part of Trade Nation's Influencer program and receive a monthly fee for using their TradingView charts in my analysis.

NASDAQ Potential DownsidesHey Traders, in today's trading we are monitoring NAS100 for a selling opportunity around 22,800 zone, NASDAQ is trading in a downtrend and currently is in a correction phase in which it is approaching the trend at 22,800 support and resistance area.
Trade safe, Joe.

Gold 30Min Engaged ( 3355 Bearish Entry Detected )Time Frame: 30-Minute Warfare
Entry Protocol: Only after volume-verified breakout
🩸Bearish Reversal 3355 Zone
➗ Hanzo Protocol: Volume-Tiered Entry Authority
➕ Zone Activated: Dynamic market pressure detected.
The level isn’t just price — it’s a memory of where they moved size.
Volume is rising beneath the surface — not noise, but preparation.
🔥 Tactical Note:
We wait for the energy signature — when volume betrays intention.
The trap gets set. The weak follow. We execute.

Gold 30Min Engaged ( Bearish Reversal Entry Detected )Time Frame: 30-Minute Warfare
Entry Protocol: Only after volume-verified breakout
🩸Bearish Reversal 3378 Zone
➗ Hanzo Protocol: Volume-Tiered Entry Authority
➕ Zone Activated: Dynamic market pressure detected.
The level isn’t just price — it’s a memory of where they moved size.
Volume is rising beneath the surface — not noise, but preparation.
🔥 Tactical Note:
We wait for the energy signature — when volume betrays intention.
The trap gets set. The weak follow. We execute.
☄️ Hanzo Protocol: Dual- Entry Intel
Zone Activated: Deep Analysis
➕ 4 wicks connected at 3378
➕ 7 wicks connected at 3385
➕ Body Close at 3370
➕ Body Close at 3385
➕ Liquidity at 3380
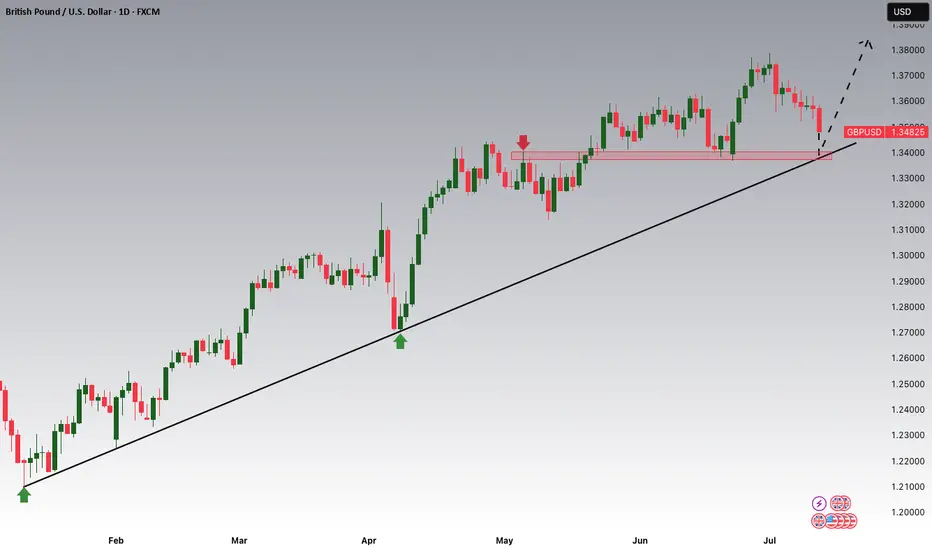
GOLD (XAUUSD): Another Bullish Pattern
Gold perfectly respected a rising trend line on a daily and
bounce from that, as I predicted earlier.
I see a strong bullish pattern on that now.
The price formed a cup & handle pattern and closed
on Friday, testing its neckline.
The next bullish confirmation that you should look for is its breakout.
Daily candle close above 3367 level will provide a breakout validation.
A bullish continuation will be expected then.
❤️Please, support my work with like, thank you!❤️
I am part of Trade Nation's Influencer program and receive a monthly fee for using their TradingView charts in my analysis.

EURGBP In a Clear Bullish TrendEURGBP In a Clear Bullish Trend
EURGBP Is moving in a clear bullsh trend for a long time.
A few days ago, the price broke out of another and clear bullish pattern.
If the volume grows further and the price respects this new pattern EURGBP may rise to 0.8710 and 0.8770 during the coming days or week.
The data we have this week could support this movement.
You may find more details in the chart!
Thank you and Good Luck!
PS: Please support with a like or comment if you find this analysis useful for your trading day
Disclosure: I am part of Trade Nation's Influencer program and receive a monthly fee for using their TradingView charts in my analysis.

Bitcoin Hits New ATH – Is It Time to Short?Bitcoin ( BINANCE:BTCUSDT ) managed to form a new All-Time High(ATH) in the previous one-hour candles .
Do you think Bitcoin can create a new ATH in the coming hours?
Bitcoin is currently trying to break the Heavy Resistance zone($110,720-$105,820) . It has also penetrated the Potential Reversal Zone(PRZ) and Cumulative Short Liquidation Leverage($114,910-$113,850) .
In terms of Elliott wave theory , it seems that the 5 impulsive waves that Bitcoin started in the last 3 days can be completed above the ascending channel and PRZ .
Also, we can see the Regular Divergence(RD-) between Consecutive Peaks.
I expect Bitcoin to drop to at least Cumulative Long Liquidation Leverage($111,563-$110,947) . At least the price zone Bitcoin is in at the time of publishing this analysis is better for short positions , even if the Stop Loss(SL) is touched .
Note: Stop Loss(SL)= $115,023
Please respect each other's ideas and express them politely if you agree or disagree.
Bitcoin Analyze (BTCUSDT), 1-hour time frame.
Be sure to follow the updated ideas.
Do not forget to put a Stop loss for your positions (For every position you want to open).
Please follow your strategy and updates; this is just my Idea, and I will gladly see your ideas in this post.
Please do not forget the ✅' like '✅ button 🙏😊 & Share it with your friends; thanks, and Trade safe.

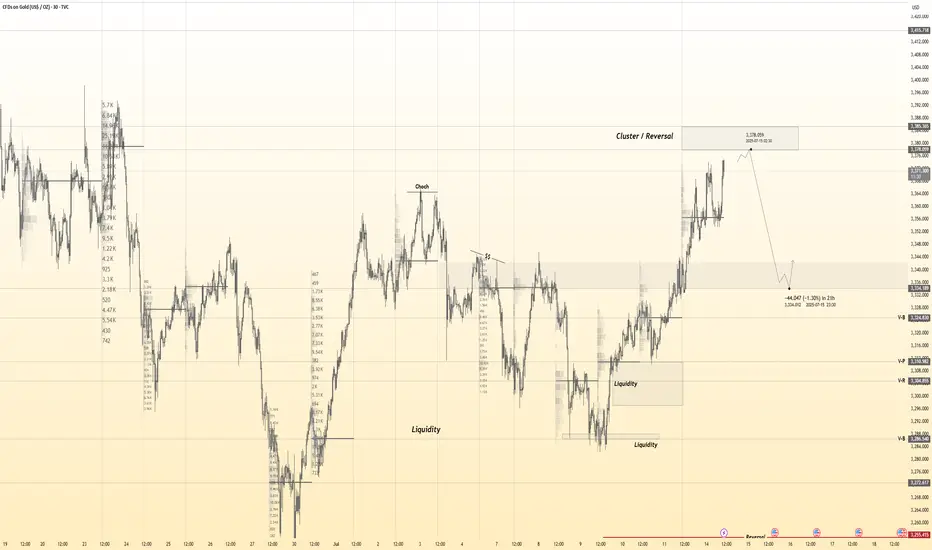
Gold Roadmap=>Short termGold ( OANDA:XAUUSD ) currently appears to have broken through the Resistance zone($3,350-$3,325) .
The Resistance zone($3,350-$3,325) was broken with the help of the Descending Broadening Wedge Pattern , the upper line of this classic pattern having served as an important resistance line for us in previous ideas .
In terms of Elliott wave theory , Gold has completed the Double Three Correction(WXY) within the Descending Broadening Wedge Pattern . It is currently completing the next five impulse waves . Wave 5 of these waves could end in the Potential Reversal Zone(PRZ) .
I expect Gold to rise to the Potential Reversal Zone(PRZ) , and of course, given the momentum of gold approaching PRZ , we can also look for Short positions in PRZ .
Note: Stop Loss (SL) = $3,329
Gold Analyze (XAUUSD), 1-hour time frame.
Be sure to follow the updated ideas.
Do not forget to put a Stop loss for your positions (For every position you want to open).
Please follow your strategy; this is just my idea, and I will gladly see your ideas in this post.
Please do not forget the ✅ ' like ' ✅ button 🙏😊 & Share it with your friends; thanks, and Trade safe.
GBPUSD is Nearing the Daily Trend!!!Hey Traders, in tomorrow's trading session we are monitoring GBPUSD for a buying opportunity around 1.34100 zone, GBPUSD is trading in an uptrend and currently is in a correction phase in which it is approaching the trend at 1.34100 support and resistance area.
Trade safe, Joe.
EUR-USD Will Keep Growing! Buy!
Hello,Traders!
EUR-USD keep trading in
An uptrend along the rising support
So as the pair is approaching
A the support we will be
Expecting a bullish rebound
And a move up on Monday
Buy!
Comment and subscribe to help us grow!
Check out other forecasts below too!
Disclosure: I am part of Trade Nation's Influencer program and receive a monthly fee for using their TradingView charts in my analysis.

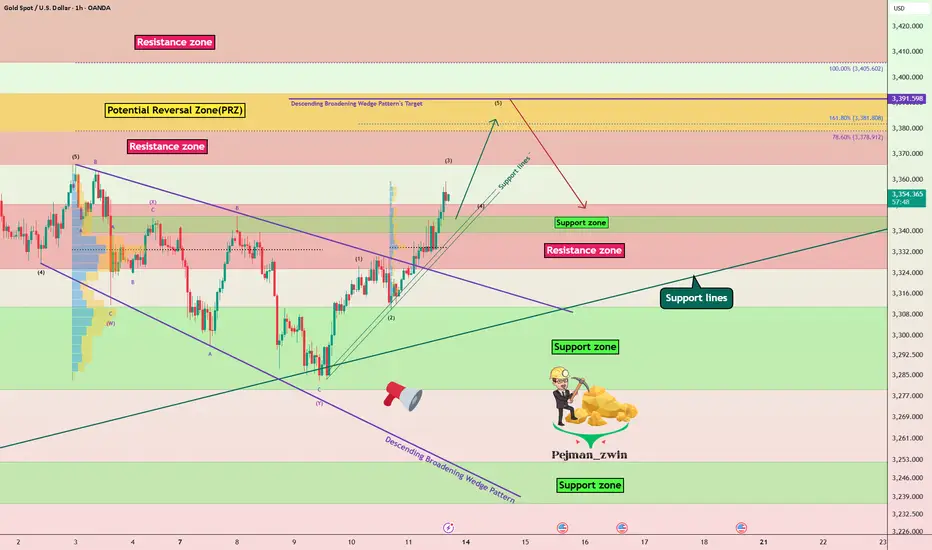
Gold Roadmap: Next Stop $3,325 After Ascending Channel Break?Gold ( OANDA:XAUUSD ) failed to touch the Potential Reversal Zone(PRZ) in the previous idea , and I took the position at $3,351 = Risk-free.
Gold is moving in the Resistance zone($3,366-$3,394) and has managed to break the lower line of the ascending channel .
In terms of Elliott Wave theory , with the break of the lower line of the ascending channel, it seems that gold has completed the Zigzag correction(ABC/5-3-5) .
I expect Gold to trend downward in the coming hours and succeed in breaking the Support zone($3,350-$3,325) and attacking the Support line again , and probably succeeding in breaking this line this time.
Note: Stop Loss (SL) = $3,396
Gold Analyze (XAUUSD), 1-hour time frame.
Be sure to follow the updated ideas.
Do not forget to put a Stop loss for your positions (For every position you want to open).
Please follow your strategy; this is just my idea, and I will gladly see your ideas in this post.
Please do not forget the ✅ ' like ' ✅ button 🙏😊 & Share it with your friends; thanks, and Trade safe.

NAS100 Setup Locked In — Ride the Drop from the Order Block!Hey Guys,
I'm planning a sell trade on the NAS100 index from a designated order block. Once price reaches the sell zone, the position will be activated.
📍 Trade Details:
- 🟢 Entry Level: 22,869
- 🔴 Stop Loss: 22,930
- 🎯 TP1 – First Target: 22,839
- 🎯 TP2 – Second Target: 22,794
- 🎯 TP3 – Final Target: 22,671
📐 Risk-to-Reward Ratio: 3.24
Your likes and support are what keep me motivated to share these analyses consistently.
Huge thanks to everyone who shows love and appreciation! 🙏

Are we on Super Bullish Express Highway ? Elliott Waves RoadmapHello friends,
Welcome to RK_Chaarts
Today we're attempting to analyze Bitcoin's chart, specifically the BTCUSD chart, from an Elliott Wave perspective. Looking at the monthly timeframe chart, which spans the entire lifetime of Bitcoin's data since 2011, we can see the overall structure. According to Elliott Wave theory, it appears that a large Super Cycle degree Wave (I) has completed, followed by a correction in the form of Super Cycle degree Wave (II), marked in blue.
Now, friends, it's possible that we're unfolding Super Cycle degree Wave (III), which should have five sub-divisions - in red I, II, III, IV, & V. We can see that we've completed red I & II, and red III has just started. If the low we marked in red II doesn't get breached on the lower side, it can be considered our invalidation level.
Next, within red III, we should see five primary degree sub-divisions in black - ((1)), ((2)), ((3)), ((4)) & ((5)). We can see that we've completed black ((1)) & ((2)) and black ((3)) has just started. Within black ((3)), we should see five intermediate degree sub-divisions in blue - (1) to (5). Blue (1) has just started, and within blue one, we've already seen red 1 & 2 completed, and red 3 is in progress.
So, we're currently in a super bullish scenario, a third of a third of a third. Yes, the chart looks extremely bullish. We won't commit to any targets here as this is for educational purposes only. The analysis suggests potential targets could be very high, above $150,000 or $200,000, if the invalidation level of $98,240 isn't breached. But again, friends, this video is shared for educational purposes only.
Many people think that the market doesn't move according to Elliott Waves. But friends, here we've tried to analyze from the monthly time frame to the overly time frame. We've definitely aligned the multi-time frame and also aligned it with the principal rules of Elliott Waves, without violating any of its rules.
I agree that the Elliott Wave theory can be a bit difficult, and for those who don't practice it deeply, it can be challenging. But yes, the market moves according to this methodology, following this pattern. This is a significant achievement.
I am not Sebi registered analyst.
My studies are for educational purpose only.
Please Consult your financial advisor before trading or investing.
I am not responsible for any kinds of your profits and your losses.
Most investors treat trading as a hobby because they have a full-time job doing something else.
However, If you treat trading like a business, it will pay you like a business.
If you treat like a hobby, hobbies don't pay, they cost you...!
Hope this post is helpful to community
Thanks
RK💕
Disclaimer and Risk Warning.
The analysis and discussion provided on in.tradingview.com is intended for educational purposes only and should not be relied upon for trading decisions. RK_Chaarts is not an investment adviser and the information provided here should not be taken as professional investment advice. Before buying or selling any investments, securities, or precious metals, it is recommended that you conduct your own due diligence. RK_Chaarts does not share in your profits and will not take responsibility for any losses you may incur. So Please Consult your financial advisor before trading or investing.

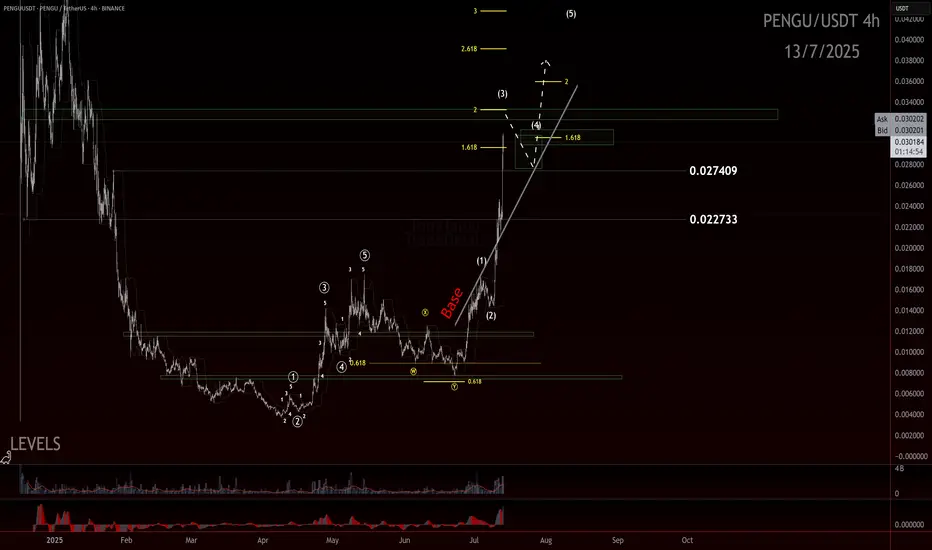
PENGU still has room!?If you find this information inspiring/helpful, please consider a boost and follow! Any questions or comments, please leave a comment!
The move off the low looked like a clean, completed impulse—sharp, decisive, and well-structured. After that, we got a double zigzag retracement. It ran a bit deeper than the textbook version, but still landed right in the normal range you’d expect for a healthy correction. From there, we saw another smaller-degree impulse form off the .007 pivot, suggesting bullish momentum was building again.
Since the last update, PENGU has come a long way—more than doubling in price and now hovering around a most likely target for a wave 3. What’s notable is how it got there: not just by breaking above the 0.017 resistance, but by blowing through multiple base channels on solid momentum and healthy volume.
We didn’t get the ideal depth for a retrace for a wave 2 before that breakout, but that doesn’t disqualify the larger count. In fact, from an Elliott Wave perspective, I still believe we haven’t seen a proper wave 4 to balance out the earlier wave (2). So I’m holding off on calling a top to this wave 3 just yet.
Here’s what we’re watching closely now:
The secondary impulse off .007 continues to build structure
Ideally, the next pullback holds above the 0.027 or .022 region, signaling respect for previous support and AOIs
That pullback needs to unfold correctively, not impulsively, to confirm bullish continuation
The next trade setup I’m eyeing is that wave 4 into wave 5 move. I’ll be stalking this ticker closely as structure unfolds.
Trade safe.
Trade clarity.
EURUSD: Long Signal with Entry/SL/TP
EURUSD
- Classic bullish formation
- Our team expects pullback
SUGGESTED TRADE:
Swing Trade
Long EURUSD
Entry - 1.1689
Sl - 1.1627
Tp - 1.1799
Our Risk - 1%
Start protection of your profits from lower levels
Disclosure: I am part of Trade Nation's Influencer program and receive a monthly fee for using their TradingView charts in my analysis.
❤️ Please, support our work with like & comment! ❤️

Apple - The next major push higher!🍎Apple ( NASDAQ:AAPL ) will head for new highs:
🔎Analysis summary :
Apple has been underperforming markets for a couple of months lately. However technicals still remain very bullish, indicating an inherent and substantial move higher soon. All we need now is bullish confirmation and proper risk management and this setup looks very decent.
📝Levels to watch:
$200, $300
🙏🏻#LONGTERMVISION
Philip - Swing Trader
