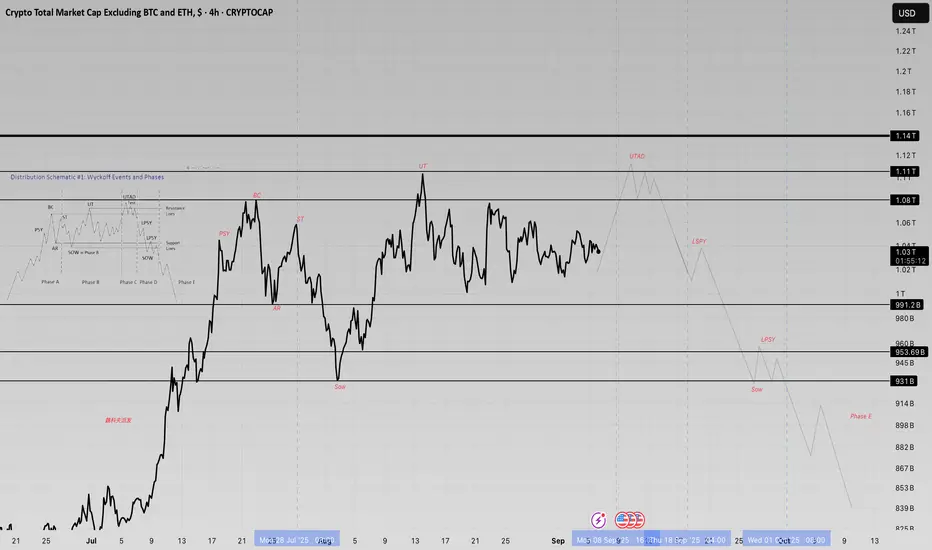
The Anatomy of a Trap: Total 3Chart, Wyckoff DistributionPrice action is beginning to show characteristics often associated with distribution. Multiple retests of resistance with waning momentum could be a sign of absorption rather than genuine strength. If this pattern develops further, the next move may involve a deceptive breakout attempt before revealing the market’s true direction.”
Wyckoffdistribution
Wyckoff Accumilation Live ExampleRichard Wyckoff has a theory regardign the markets phases, and this video exlaborates the accumilation with a live example from the main Swiss index SUI20
Best of Luch
MarketsTitan

▒₿▒ Distribution Top - Anatomy of a Bitcoin Cycle Top ▒₿▒COINBASE:BTCUSD
I've identified key price action indications that we have "topped" with an ATH for this Bull Market Cycle. There is a much deeper analysis that needs to be done here.
While this price action is the first major clue, to confirm a true distribution top, we'll also need to analyze volume profiles for institutional selling, spot bearish divergences in key momentum oscillators, and watch on-chain metrics for any signs of whale or miner selling pressure.
Every Bitcoin cycle has a story, and the final chapter is always the most dramatic. I've been analyzing the price action at every major cycle peak, and there's a recurring pattern that acts like a final warning before the curtain falls. It’s not the explosive top itself, but the messy, indecisive period that follows: the Distribution Top .
This isn't just a pattern; it's the visual footprint of a massive transfer of wealth. It’s the moment when the cycle's early investors (smart money) begin to distribute their holdings to the late, euphoric buyers.
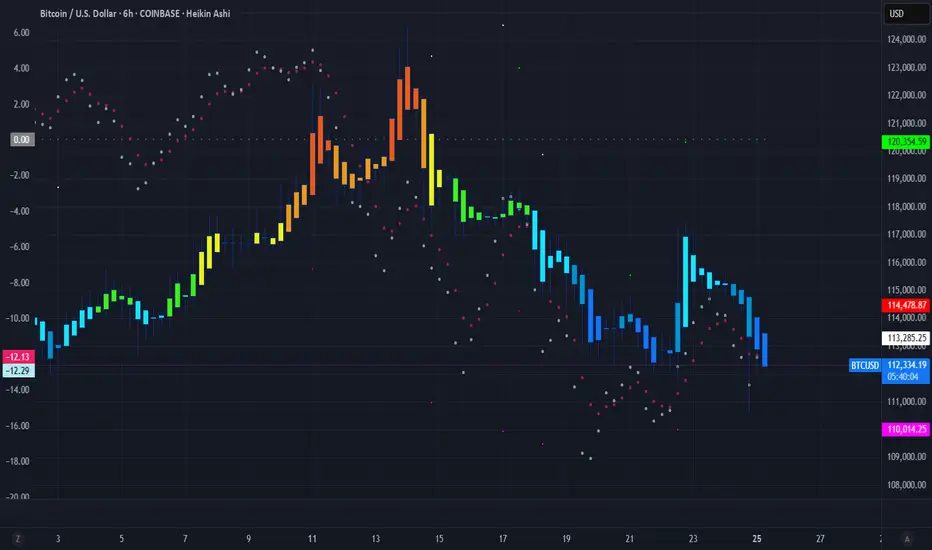
Look at the price action from the November 2021 ATH top. After the euphoric peak, the clean, powerful uptrend dies. It's replaced by a volatile, sideways "wiggle." The Heikin Ashi candles lose their bodies, showing long wicks on both sides. This is the signature of market conflict and exhaustion.
Cycle Tops vs. Local Highs: A Crucial Distinction
It's important to understand that this "wiggle" is unique to major, euphoric ATH cycle tops. Other tops, like the one from August 2021 shown below, have a much different character. Notice how the rejection is sharper, faster, and lacks the prolonged, grinding "wiggle." This is often a rejection from a known resistance level, not the slow, painful end of cycle-wide euphoria.
The "Distribution Top" is a process. It’s designed to churn, create confusion, and trap breakout traders before the real move down begins. It’s the market grinding at the highs, absorbing the last wave of FOMO. We saw this exact anatomy play out in the April 2021 top as well.
The Key Takeaway for Bitcoin Investors:
Recognizing this specific pattern is crucial for capital preservation. When you see this shift from clean momentum to choppy, indecisive grinding near an all-time high , it's a signal that the market character has changed. The risk is no longer to the upside; it's to the downside.
While this price action is the first major clue, to confirm a true distribution top, we'll also need to analyze key trend lines, candlestick patterns, seasonality, volume profiles for institutional selling, and watch on-chain metrics for any signs of whale or miner selling pressure.
Now, take a look at the most recent price action. We are seeing the early stages of this very same pattern developing after a new high.
The question every Bitcoin holder should be asking is: Is this history rhyming once again?
As I mentioned at the start of this post, there are much more metrics to analyze here, so I'll be updating this post with further findings.
DISCLAIMER
I AM NOT A FINACIAL ADVISOR, NOR AM I YOURS. THIS IS NOT FINANCIAL ADVICE. MEARLY DOODLINGS ON A MATHMATICALLY DRIVEN GRAPHICAL INTERFACE, TRACKING AN INVISIBLE 256BIT MILITARY-GRADE ENCRYPTED ASSET. . . FOR ENTERTAINMENT/AMUSEMENT PUROSES ONLY. ENJOY!
Looking to hear your thoughts on this @TradingView @Profit_Through_Patience @David_Perk @ProjectSyndicate @Xanrox_ @HAMED_AZ @melikatrader94
Dead Cat or Last Breath? RHC’s Pivot Trap LoomsRHC is sitting at a pivotal moment. For the bullish case to stay alive, we need to see price swiftly reclaim and close above ~$43 — that’s the line in the sand.
However, I’m leaning toward Scenario 1, which suggests a short-term push up to the yearly pivot and macro 50% retracement level, followed by a rejection and sharp move lower.
Bearish Pathway
Initial Bounce: Push toward ~$43 could trap late longs.
Rejection Zone: Yearly pivot and macro 50% level act as resistance.
Downside Targets:
First stop: $26 — previous structural support.
Then potentially: $18 — deeper liquidity zone and psychological level.

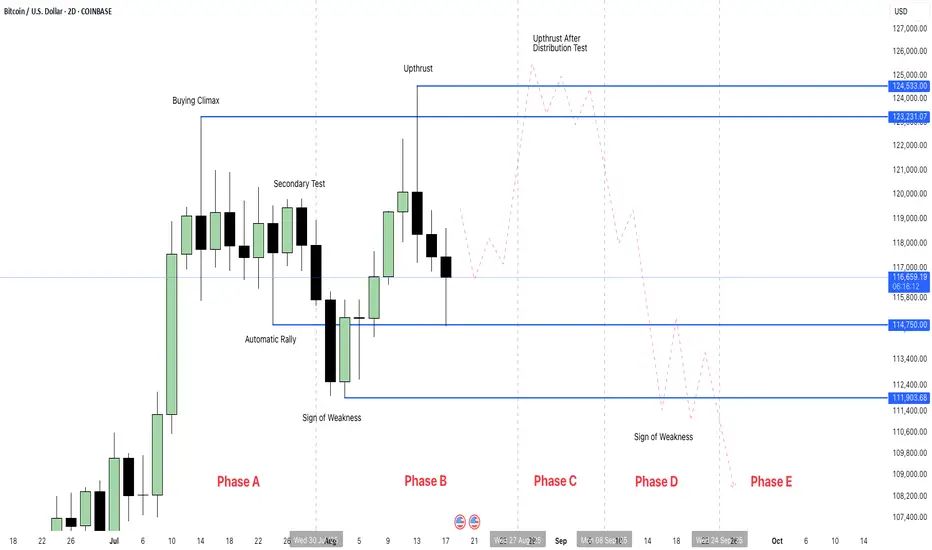
BTC Bitcoin in Distribution Phase BLOW-OFF TOPI believe Bitcoin BTC is in Wyckoff Distribution Phase B heading for Upthrust After Distribution (New ATH) Sweeping $124,500 price.
For me, that would be the BLOW-OFF TOP and the end of this cycles.
For this scenario to play out, after taking liquidity above the current ATH, it needs to start reversing and dropping.
If it closes above the current ATH, then this idea would be invalidated.
There are other factors which would confirm this idea but I am not gonna share it publicly.
Good luck and Happy Trading...
Eth in WYCKOFF Distribution SchematicEth is in a type 1 wyckoff distribution schematic. I am looking for a higher high in the light red supply zone before selling off in a manipulation. I’ll be buying the dip if I see proper accumulation

eurusd outlook Eurusd overall bullish HTF, however I do identify alignments within wyckoff distribution. Keeping an eye on the 4hr sponsored candle, ltf fvg at 1.62 area for my next possible bullish swing into the weekly high. Until then let's see if the market can support short term bearish reversal into the area of interest.

GBPUSD - Technical Outlook (Long + Short Term)In this article, I’ll share my current outlook on GBPUSD, highlighting both higher time frame (HTF) and intraday considerations.
Higher Time Frame Analysis
The overall trend remains bearish. Price is still trading within the previous structural leg, with the key level at 1.42500. Unless we see a decisive break above this level, my bias will remain bearish for this pair.
Recently, we’ve witnessed what looks like institutional manipulation to the upside, followed by a sharp bearish reaction from the weekly supply zone. This price action aligns with a classic Wyckoff distribution cycle, which often signals that the prevailing trend is likely to continue.
Intraday Advice
For short-term traders, it’s best to wait for lower time frame (LTF) pullbacks and signs of manipulation before considering short positions. If price continues to push lower, there should be opportunities to ride the trend down over the coming weeks, with multiple entry points along the way.
Trading Considerations
If this analysis plays out, there’s potential to maximize gains through both swing and intraday trades. However, patience and risk management are key. Losses are inevitable - what matters is managing risk and staying disciplined.
Key Points to Remember:
Wait for clear pullbacks before entering trades.
Stick to your risk management plan.
Stay patient and let the market come to you.
This is an exciting time to trade FX:GBPUSD , but always assess if the risk is worth the reward before entering any position.
Happy hunting predators...
Apex out!

USDT.D Update: Range Reversal in Play?Initially in my last update, I was expecting USDT.D to push into daily supply levels after taking the swing low from the prior daily higher low — pulling back into supply before continuing lower after the market structure break.
Instead, it pushed even deeper, taking out the range low swing at 4.56%, which allowed BTC to break higher and tag its ATH by taking major upside liquidity.
Since then, we’ve seen a cool-off from those levels. Supply has come in across majors (notably TOTAL), and I’ve been tracking the local range forming in USDT.D — forecasting a reversal back into supply. That reversal is now starting to show itself, with USDT.D rising as BTC and alts pull back.
I'm currently watching for a push into the 5.0% – 5.6% supply zone, which I believe could mark the next major pivot point for the market.
From there, I’ll be looking for weakness or signs of rejection in USDT.D — which would align with BTC and the broader market setting up for another leg higher.
Once this supply is hit and the move starts rolling over, I expect USDT.D to begin its final phase down toward 3.73% — a key HTF demand and bullish reversal level. That would mark a major shift, coinciding with what I believe will be the macro market top forming across risk assets.
This level will be one I’m watching closely for DCA entries and scaling back into exposure — the reversal in USDT dominance from that zone should align with the last stage of the current cycle before distribution takes over.
1D:
3D:
1W:
3M:

BTC.D - Could it be Wyckoff Distribution DevelopingJust toying with ideas of what may be developing here so dont take the chart as what i think will happen perfectly as shown.
With the strength seen from BTC.D atm, it looks more and more likely it may go for the highs again and into the higher levels above 65%.
I still see this as a very large range from the february high and lows that got put in and the prior high was a deviation of the larger range resulting in the reaction we seen.
We could expect to see a further deviation of the range highs and this wouldn't be uncommon in the development of a wyckoff distribution range.
Im still looking for a HTF reversal bearish from these supply levels and my bias doesnt change right now as we continue to develop this range until proven otherwise.
That being said, we could see some further weakness in altcoins until this tops out and gives us the right confirmations of a trend shift bearish.
1D:

BTC 113k-115k level ends of bull marketWyckoff distribution happening exactly as it happened at 64k top previous bull run. I'm following this map, I'm actually holding a short to $105.800 then if we follow the map, we should go to a new a final ATH, where I'm probably shorting really heavy

VRNA Likely Wyckoff Distribution with Topping pattern - SHORT!VRNA has had a Parabolic Run higher with Price > 2 Standard Dev from Mean for 11 WEEKS before showing weakness and Selling to $48 range. Price is forming a pretty picture perfect WYCKOFF Distribution. I believe we have just had the UTAD (Up Thrust After Distribution) Likely, we have lower prices in store.
Target Price $41.36.
Trade what you see.

Wyckoff distribution on FET/USDI noticed this Wyckoff distribution pattern that has formed on the 1h time frame for FET/USD and it convinced me this might be a good time to step out and wait.
The crypto market has been going sideways since last week now and we didn't really get a strong rebound after the selloff a few days ago. Even with the positive Macro news it's starting to feel like there's just not enough buyers around right now to push BTC and everything else to higher highs. My advice is to be cautions now and wait for a correction, then enter at more favorable prices.

USDT.D Bearish Reversal Incoming Into a New Bullish Phase in BTCUSDT.D Update:
Its been a while since my last USDT.D update on here since i accurately forecasted and called the top in September last year from its last distribution range. Since then, Ive been expecting USDT.D and USDC.D to continue higher into deeper premiums and into monthly and 3M supply areas, taking further BSL in the process and coming into the HTF downtrend channel high, whilst the rest of the market continued bearish after the first moves from last year.
Both have done just that, pushing higher to extreme supply and heavy premium pricing. USDT.D has topped out with high volume as it come into refined extreme daily supply from the UT event in the prior distribution range, whilst taking the LQ at the 5.93% level i discussed in the market update videos. This is effectively following last points of supply from one distribution range to the next, following HTF bearish orderflow and HTF bearish structure in stablecoin dominance pairs. From the recent UTAD event we have seen bearish breakdowns on the daily timeframe on both USDT.D and and USDC.D, marking a turn in the market where things should start to get more interesting! Im looking for this again but on the weekly timeframe and monitoring for a HTF weekly close below the weekly HL, therefore putting in a LL on the weekly to give further HTF confirmations of the reversal from this area.
Whats interesting at this point is the last couple days of data on both USDT.D and USDC.D and the range conditions we are now creating.
For me, it looks pretty similar to the last top, where we created a distribution range in HTF supply after taking extreme key levels and LQ, putting the market in extreme fear, before slowly flipping bearish in the range before a full blown reversal and breakdown to the 3.73% level.
Im expecting a bounce of some degree over the next week or so in USDT.D back into the 5.57% region where the range high sits alongside some daily and refined 12H supply zones from the UTAD event. Im looking for a push into supply forming a LPSY last point of supply in phase D, before continuing HTF bearish to target SSL on the lows of this upward trend channel with my main targets between 3.73% and 3.12%. This aligns with what im seeing in BTC as posted today on TradingView and the market, expecting a pullback to demand respectively before continued upside.
I don't for see this taking the highs again above 6.24%. There is a lot of resistance and supply in this range now we have broke down and its likely we are seeing the formation of the reversal taking shape in due course.
As ive stated i the most recent BTC analysis, this is a risk on situation in my opinion and i will be allocating capital to spot bags as USDT.D hits its supply levels in the range highs and as BTC comes into the daily demand levels im monitoring between $84,000 - $76,500, buying the dip whilst expecting further upside and a HL to form in BTC and new LHs in stablecoin dominance pairs.
To finish, look at this chart on the daily, 2D, 3D, 4D, 5D, 1W, 2W, 3W charts and really look at the HTF closes on these candles at these highs. Theres been no HTF bullish closes above HTF supply or significant highs. Price has failed to put in new higher highs and is merely sweeping highs now with high volume rejections, volume dropping off, all whilst looking like a top imo with HTF weekly rejections all the way up to the monthly candle.
1D:
3D:https://www.tradingview.com/x/XtxjrvGR/
1W:
1M:

LTF DistributionContinuation of previous post :
1H Range starts off this schematic by stopping the momentum at the point of the first secondary test, it fails to break the previous high and this markets goes from moving up to sideways into this TR. Each rally to previous highs reflects upside effort increasing, but upside result is decreasing indicating buyers weakness near this level. uE>, uR< = bearish indicator.
Favorable bearish confirmation would be a lower high, paired with high buy volume confirming the shift to bearish market.

$NVIDIA ─ Wyckoff Distribution #4 aka Rising Wedge PatternVANTAGE:NVIDIA ─ Wyckoff Distribution #4 aka Rising Wedge Pattern
Although Rising wedge turning into more like Rising Channel distribution idea is still valid.
#2 Long Trade TP1 Hit so far 🔥
------------
------------
Note: This is the most positive outcome possible.
As always, my play is:
✅ 50% out at TP1
✅ Move SL to entry
✅ Pre-set the rest of the position across remaining TPs
It's important to take profits along the way and not turn a winning trade into a losing trade.

BITCOIN SHORT (EXPERIMENTAL)In a bear market scenario, Bitcoin might see extended periods of stagnation or decline, which could challenge its perception as a store of value or its role in a diversified investment portfolio. However, bear markets can also present buying opportunities for long-term investors, as they may view the price declines as temporary setbacks in Bitcoin's overall growth trajectory.

Gold Futures - Potential Springtime ReversalGold futures have been on a rally, but recent price action suggests a potential shift. Could we be witnessing a Wyckoff distribution forming?
Understanding Wyckoff Distribution
The Wyckoff distribution pattern occurs when large institutions begin selling off their positions to retail traders before a downtrend begins. This phase is often characterized by sideways price movement, false breakouts, and key "Signs of Weakness" (SOW) that hint at an impending sell-off.
A Recent Sign of Weakness in Gold Futures
A possible sign of weakness in gold futures was observed recently when prices gave a false break out at what retail traders would label "key levels".
Historical Seasonal Trends: Spring Reversals
Looking at historical data, Moore Research Center, Inc. (MRCI.com) has tracked seasonal gold price patterns for over 40 years. Their findings indicate that gold often experiences price reversals during the spring months. This aligns with the idea that we could be heading into a seasonally weak period, increasing the likelihood of a distribution phase playing out.
What Traders Should Watch For
As Gold rallies back towards a new all time high we should be aware that it may be just a false break to form the final phases of a distribution schematic. This would form an upthrust, and upthrust after distribution, followed by a sharp retracement back into the range and ultimately leading to a sell off and market reversal.
Final Thoughts
While nothing is certain, the combination of the financial institutions footprint and historical seasonal data suggests gold traders should proceed with caution. Whether you’re trading futures or investing in physical gold, staying aware of these patterns can help you make informed decisions.
Do you think a Wyckoff distribution is playing out in gold? Share your thoughts in the comments!

GBP/USD: Distribution Signals a Drop to 1.25GBP/USD appears to be in a distribution phase, struggling to break through resistance around 1.2620. The price has formed multiple rejection points at this level, indicating weakening bullish momentum.
The recent lower high, combined with a potential break of the ascending trendline, suggests sellers are regaining control. If price breaches the key support zone, a move towards the 1.2500 region becomes increasingly likely.
With a bearish harmonic pattern and liquidity grab indications, GBP/USD could see further downside as selling pressure intensifies.

AUD/USD Bearish Breakout PotentialThe chart shows AUD/USD on a 1-hour timeframe, highlighting a consolidation phase with multiple rejections at resistance (labelled 1-4). The price has recently rejected the upper boundary and is breaking down from the range, suggesting bearish momentum. A significant liquidity grab appears to have occurred near the highs, followed by a strong rejection. The projected move suggests a further decline toward the next support level around 0.6300. Traders might look for confirmation via increased selling pressure and volume before entering short positions.

BTC 2021 Bull Run repeat? Start of Alt Coin Season!Hello Folks,
Just wanted to do a quick update on a possible plan for BTC over the next few weeks. This is based on a Wyckoff Distribution Schematic we had all the way back in 2020. Ironically when China entered big new into the crypto market in which they are currently doing as of now.
The chart is kind of messy but, I wanted to publish the gist of it. I used the bars pattern tool which we have been following for the past 6-8 weeks. Grabbing price action from the first top we made in 2021 and placing it over the current price action in which it seems to be following nicely. We will likely either follow the Green arrow Path or the White Arrow Path for the long and then you can follow the Short Position tool for the short. This is not yet fully confirmed but, the volume and the manipulation during these times show me that the Schematic is likely going to play out.
It is important to mention that the green line you see is a parabola trend support line that BTC has been holding this whole run. So it is possible that we hold it on this drop if it in fact comes. The second important thing to note is that we have a gap on CME:BTC1! between $77,975 and $80,775 as you can see on the chart below.
In conclusion yes, it is very possible that we have a decent discount coming up. IMO this is truly that, a discount. I do believe some alt coins may run up a ways while BTC has this short term long and if it comes to fruition and BTC then trades sideways for a week or two and we see the CRYPTOCAP:BTC.D start loosing traction from the possible ascending channel it has been jumping in and out of the past few weeks.... also indicating some manipulation. This can be seen on the chart linked below. Lastly, the most important thing to notice is the down sloping resistance trend line on the Bitcoin Dominance chart that looks to be what I would say after my 8 years in crypto and trading daily, the beginning of alt coin season!!! Keep in mind, history doesn't always repeat itself but, it often rhymes!
I hope you enjoyed this update and look forward to all of you who follow our trades to be looking out for all of the Alt coins that have bottomed out and look to be ready to run over the next few weeks that we will be posting! DONT FORGET TO FOLLOW and leave a comment with your opinion or any questions about our trades.
Stay Humble & Profitable my friends,
Savvy!
Here is a link to a publication that will help you understand more about the Wyckoff Distribution Schematic I am referring to in 2021. This trader did a great job on charting it as well as explaining it in his publication. Don't forget to show him some love!

USDJPY - Demand Ready for Lift-Off (Technical Analysis)As it stands we're currently holding short positions on USDJPY since last week.
The current short term still suggests that this pair is bearish -
We have seen lower lows and institutional manipulation to the upside as well, so we will continue holding our shorts until we see a reversal on the lower time frames.
Previous Analysis:
We traded down to the Daily demand levels (which price has now reached).
The current price cycle indicates it's still distributing but now is the time to watch for potential bullish reversals - more-so when we combine this with our DXY analysis as well as current Geopolitical moves, we could definitely see a bullish surge in the next few days.
Trading Considerations:
All signs point to a pending bullish reversal, don't engage without considering the LTF trend, we would ideally like to see it reverse first.
Trade what you see, not what you think you might.
Disclaimer: This analysis is for informational purposes only and does not constitute financial advice. Trading involves substantial risk and may not be suitable for all investors. Conduct your own research and consult with a financial advisor before making any investment decisions.
OANDA:USDJPY TVC:DXY

Bitcoin LTF Signals Wyckoff Phase D Potential Near Term WeaknessSeems volatility is the name of the game as power changes hands in Washington, D.C., and Memecoins are set to swallow up market liquidity (for better or worse). Personally, I’ve never really cared for Memecoins, and tend to focus on POW governance tokens for long term value.
Seems the “interesting times” of that Chinese Proverb are upon us.
On the LTF (1D) Point and Figure, the formation is currently printing a distribution pattern, completing Phase C of a Wyckoff Distribution pattern. Phase C in a distributive phase generally reveals itself through a (or some) strong Upward Thrust (UT) and/or a (or some) Upward Thrust After Distribution (UTAD).
The formation has already printed a Shakeout Distribution Spring to the $89,200 handle in Phase B, and subsequently printed the first Upward Thrust After Distribution (UTAD) to the $105,800 handle signaling the beginning of Phase C distribution had started. The formation printed a subsequent UTAD to the $109,200 handle - all typical activity we would expect to see in Phase C of a distribution cycle. The following Test of that UTAD at the $106,400 handle, printed a lower high and signaled both (i) the Last Point of Supply (LPSY) for Phase C of this distribution cycle, and (ii) the end of Phase C of this distribution cycle.
Phase D Wyckoff Distribution is generally signaled when the formation prints a Major Sign Of Weakness (MSOW) which “Breaks the Ice” of the lower level of support within the Trade Range.
This sets up an excellent Risk/Reward opportunity for a potential short swing trade position.
The current formation suggests that a move to the $90,600 handle is in play in the near term as Phase C of this distribution cycle completes and moves into Phase D. There is a potential longer near-term play for $85,600 as the formation moves into the final phase (Phase E) of this distribution cycle. Provided the LPSY formed on the Return to Ice move tops out at the $92,800 handle the Horizontal Price Count should be accurate.
Always remember this is not trading advice.
Outside of that, Happy Trading.
