XRP Army - prepare for a 72% crash to 0.6 USD! (lifetime chance)The current price of XRP is 2.19 USD, and I predict a big crash in 2025/2026 to 0.6 USD. Yes, I know you may think that that's completely impossible, especially if you are high on your XRP holdings, but I can assure you that this is going to happen! What can you do?
If you are a hodler, then you need to prepare for your portfolio to drop by 72%. Can you really handle this situation? If not, you need to take some action.
If you are a trader and you still speculate on the price increase, you can consider exiting your position. If you bought before the huge pump, take your profit now.
If you are a trader and you bought after the pump, that means at the TOP, you basically FOMOed-IN. It's time to take a small loss or exit your position at break-even. If you found yourself in one of the situations above, you have some work to do. And you need to do the work as soon as possible, before XRP starts crashing, which can be any day now. Otherwise, I strongly recommend entering a short position on futures on a strong resistance if you want to make money on XRP.
Now, importantly, why do I think XRP will crash? Technically, XRP is in a big range and has been in a range since 2017. Nothing changed at all after the pump; the price is still inside this ascending triangle. After the huge pump, the price created a big FVG (Fair Value GAP), and historically this has been a big issue for XRP because we went down each time and wiped out the GAPs. Don't forget that XRP is something like a bitch coin, it's doing weird moves, and it's always ranging and taking liquidity from traders, like a casino. Smart traders can take advantage of it and trade it, but you need to have a strategy. Right now it's obvious that XRP is going to go down in the next months!
Write a comment with your altcoin + hit the like button, and I will make an analysis for you in response. Trading is not hard if you have a good coach! This is not a trade setup, as there is no stop-loss or profit target. I share my trades privately. Thank you, and I wish you successful trades!
Crypto market

BTC - Consolidation, Manipulation & DistributionMarket Context
The current price action unfolds within the broader structure of a bullish leg that began after a sharp reversal near 97,000. This impulsive rally created a clear Fair Value Gap on the 4-hour chart—left behind as price surged upward with minimal resistance. Following this move, the market entered a consolidation phase, forming a range that has now broken to the upside. This kind of breakout often attracts breakout traders, but in this case, the context signals something more calculated.
Buy Side Liquidity Sweep Following Consolidation
The breakout above the consolidation range led directly into a Buy Side Liquidity Sweep, as price ran the highs just above the marked range. These highs acted as a magnet for liquidity—stop losses from short sellers and buy stops from breakout traders were likely pooled in that area. The quick rejection following this sweep suggests the move was not backed by genuine demand, but rather served the purpose of liquidity collection by larger players.
Manipulation and Distribution
This is a textbook example of manipulation into liquidity. Price was engineered to move upward into a zone of interest, taking out the Buy Side Liquidity before sharply reversing. The strong rejection signals distribution—institutions likely offloaded positions into the influx of late buyers. This kind of pattern often precedes a larger markdown, particularly when followed by lower timeframe bearish structure breaks.
Unfilled Fair Value Gap as a Draw
Beneath the price lies an unfilled Fair Value Gap, a zone of imbalance left behind by the earlier impulsive move. These areas often act as magnets for price, especially once liquidity objectives to the upside have been completed. Now that the sweep has occurred and distribution is underway, there is a strong probability that price will begin to seek rebalancing within this Gap. The area between 104,000 and 103,500 stands out as a high-probability target for the next leg down.
Execution Insight
If you're looking to enter short, it may be wise to wait for confirmation on a lower timeframe—such as a bearish break of structure or an internal Gap forming during the retracement. A 5-minute timeframe can often give early signs of rejection or supply stepping in. Being patient and allowing the market to reveal intent is crucial, especially after liquidity-driven moves like this.
Final Thoughts
Price doesn’t move randomly—it seeks liquidity and fills inefficiencies. This chart beautifully illustrates that logic, from engineered consolidation to a manipulative sweep, and now potentially toward rebalancing.
If you found this breakdown helpful, I’d really appreciate a like—it helps support the work and keeps this kind of content going. Let me know in the comments what you think, or if you’re seeing it differently. I'm always up for a good discussion.

Bitcoin - Rejection From Major Resistance, Eyes on 103.8K SupporBitcoin is once again reacting to a major resistance zone around 108.8K, a level that has consistently rejected price in the past. The market attempted a breakout but failed to sustain momentum, forming multiple wicks and signs of weakness near the highs. This repeated rejection suggests that sellers are still in control up here and that this zone remains a strong ceiling for price.
Immediate Downside Scenario
With bearish pressure building at resistance, price is now pulling back and eyeing the first key support level around 103.8K. This zone previously acted as a significant base, with an imbalance overlap and structural demand from past price action. If price taps into this zone and buyers defend it, we could see a recovery bounce and potentially another retest of the upper resistance.
Breakdown Risk and Bearish Expansion
However, if 103.8K fails to hold, this opens the door for a deeper correction. The next logical downside target would be in the 98K region, where a higher timeframe imbalance sits and where price last found strong demand during the last major push up. This would also align with a full sweep of recent liquidity build-ups below.
Bullish Recovery Path
In the bullish case, holding 103.8K could initiate a rebound back toward the 108.8K resistance. This would likely depend on a solid reaction and displacement from the support zone, potentially forming a new higher low structure. For bulls to regain full control, we would need to see a clean breakout above the resistance zone with continuation.
Key Zones to Watch
The red resistance zone near 108.8K remains the clear invalidation for further upside, while the grey support block around 103.8K is the first major level that could decide the short-term trend. If that breaks, the purple demand zone near 98K is a high-probability area for price to find support again.
Conclusion
Bitcoin is still stuck between a strong resistance ceiling and a critical mid-range support zone. The rejection from the top signals that we may see downside in the near term, but whether this turns into a full reversal or just a retracement depends entirely on how price reacts around 103.8K. Hold it and we bounce, break it and we likely drop toward 98K. Keep watching how price behaves at these levels to gauge momentum and direction.
___________________________________
Thanks for your support!
If you found this idea helpful or learned something new, drop a like 👍 and leave a comment, I’d love to hear your thoughts! 🚀

Bitcoin - Price struggles below resistance, correction to $104k?This 4-hour chart for BTC/USD illustrates a detailed technical analysis scenario highlighting key resistance and support zones, as well as a critical fair value gap (FVG). The chart shows that Bitcoin is currently facing strong resistance in the $108,000 to $109,000 range. This area has been tested multiple times without a successful breakout, indicating significant selling pressure. The price is currently trading just below this resistance zone, struggling to gain momentum above it.
Support zone in the consolidation
A clear support level has been marked in the recent consolidation area around $106,000. This zone has served as a short-term base during the recent upward movement, and a retest here could provide a temporary bounce or pause in bearish momentum. However, if this support fails to hold, the next major area of interest lies within the 4-hour bullish FVG between approximately $103,000 and $104,000.
4H FVG
There is a clear 4-hour bullish FVG between approximately $103.000 and $104.000. This level can act as a strong support for buyers after filling up the inbalance zone. it is highly important to hold this level as support and not to break below it.
Upside potential
On the upside, if BTC can defend the support in the consolidation zone and reclaim momentum, a push back to the $108,000 to $109,000 resistance area is probable. A successful breakout above this zone would invalidate the bearish scenario and may trigger a bullish continuation, with the potential to reach higher targets such as $111,000 or beyond.
Downside risk
The downside risk becomes more pronounced if BTC breaks below the 4H FVG. A sustained move beneath this level would likely signal weakness in buyer interest and potentially open the path to deeper downside targets. In such a scenario, the price could accelerate lower toward the psychological support level at $100,000. This round number also carries technical and emotional significance for traders, which could create both a strong support area and potential buying interest.
Conclusion
In conclusion, Bitcoin remains at a critical juncture. The key levels to watch are the support within the current consolidation and the 4H FVG imbalance zone. A breakdown below the FVG could lead to a decline toward $100,000, while holding above these levels keeps the door open for another test of resistance at $108,000 to $109,000. A breakout from there would indicate bullish strength and a shift in market sentiment. Traders should remain cautious and reactive to how price behaves around these critical areas.
Disclosure: I am part of Trade Nation's Influencer program and receive a monthly fee for using their TradingView charts in my analysis.
Thanks for your support.
- Make sure to follow me so you don't miss out on the next analysis!
- Drop a like and leave a comment!

XRP/USD – Bearish Rejection from Resistance Zone Targets 2.0686XRP/USD Bearish Reversal Setup – H1 Chart 🕐
Analysis:
Entry Point: Price entered a short zone near 2.21828, which aligns with a previous resistance zone.
Bearish Rejection: The price formed a rejection wick and bearish candle at the resistance, signaling a potential reversal.
EMA Confluence: The price is testing below the red 50 EMA, and the 200 EMA (blue) is acting as dynamic support.
Support Zone Retest: The recent price pullback suggests a possible retest of the small support zone around 2.19106.
Target: The projected downside target is 2.06869, aligned with the prior demand zone.
Stop Loss: Positioned above resistance at 2.21828, just outside the upper rejection area.
📌 Summary:
Trend Bias: Bearish
Entry: Around 2.21828
Target: 2.06869 (≈ -6.67%)
Stop Loss: Above 2.21828

ARTY Launch: Play-and-Earn goes live June 30KUCOIN:ARTYUSDT Artyfact (ARTY) is approaching a major milestone, with its Play-and-Earn platform scheduled to launch on June 30. In anticipation, the token is already showing signs of strength, trading around $0.188 and gaining upward momentum. This move comes off a clear technical structure: a double-bottom reversal followed by a breakout above the descending trendline.
Price action is beginning to confirm the shift in sentiment as the official Play-and-Earn tournament kickoff draws near. With just days left until June 30, anticipation is building as the launch will mark a real turning point. Until then, the current pre-launch sentiment continues to lean optimistic, driven by growing community engagement, strong social media traction, and increasing excitement around what Artyfact is building.
The anticipation surrounding the June 30 launch could be creating strong momentum, as traders and early supporters position themselves ahead of what could be a key moment for the project.
From a broader market perspective, Bitcoin continues to lead the risk-on rotation. BTCUSD recently had an aggressive bullish rally and is poised to maintain upward momentum if macro conditions remain favorable.
Historically, Bitcoin strength has preceded major capital inflows into small-cap altcoins. As BTC resumes its bullish trajectory toward the $110,000 zone, it provides ideal conditions for undervalued projects to reprice aggressively. The rotation effect tends to flow from BTC → ETH → high-utility altcoins and ARTY is positioned to benefit from this dynamic.
Fundamentally, ARTY is deeply undervalued relative to its potential.
Low market cap: A micro-cap with asymmetric upside.
80%+ of total supply is in circulation, reducing inflation risk and encouraging organic demand.
Holder base is expanding, reflecting early-stage adoption and network growth.
Major catalysts ahead:
🎮 Launches on PlayStation, Xbox
📱 Releases on AppStore and Google Play
🧩 NFT integration and metaverse gameplay expansion
These milestones could drive exponential user growth, attracting both gamers and crypto enthusiasts to the ecosystem. When combined with the convergence of technical bottoming, bullish macro conditions, and strong fundamental catalysts, the setup supports the potential for a sustained move toward the $1.00 zone as momentum builds post-launch.
Traders should monitor for confirmation:
-Higher low formations
-Expansion in bullish volume
-Strong closes above interim resistances
With BTC strengthening and capital rotating down the risk curve, early entries in fundamentally sound projects like ARTY offer high risk-reward profiles.

HelenP. I Bitcoin may continue grow and break resistance levelHi folks today I'm prepared for you Bitcoin analytics. After looking at this chart, we can see how the price broke the resistance level, which coincided with the resistance zone, and continued to move down next. When the price almost reached the support level, it turned around and tried to grow, but failed and dropped to the support zone. After this movement, BTC turned around and made an impulse up to the resistance zone, breaking the resistance level one more time. Then it reached the trend line and started to decline in a broadening wedge, where it broke the resistance level again. Later, the price even declined below the support level, breaking this level too and falling to the support line of the wedge pattern. Next, price turned around and made a strong impulse up to the resistance level, thereby breaking the support level with the trend line, exiting from the broadening wedge too. Bitcoin made a retest of the trend line and then continued to grow. In my opinion, BTCUSD will correct to almost to trend line and then rise to the resistance level. Then it can break this level and continue to move up; therefore, I set my goal at 111000 points. If you like my analytics you may support me with your like/comment ❤️
Disclaimer: As part of ThinkMarkets’ Influencer Program, I am sponsored to share and publish their charts in my analysis.

Bitcoin & Ethereum New Quarter | What To Look For🎯 New Quarter For COINBASE:BTCUSD & COINBASE:ETHUSD — What To Look For
As we enter a new quarter, smart money is already positioning.
Institutional investors, hedge funds, and asset managers don’t just trade price — they rotate capital based on quarterly performance, risk appetite, and macro expectations. That’s why each quarterly open is a key inflection point across all markets — including crypto.
In this video, I break down:
• 🧠 How institutional capital rotation impacts Bitcoin and Ethereum
• 📈 Key levels to watch as Q3 unfolds
• 🔁 What are the likely outcomes
• 📊 How to prepare for volatility and new trend formation
This isn’t just another candle — it’s the start of a new chapter in the cycle.
If you’re serious about understanding where the money flows next , this video is for you.
This is the likely outcome
Price not ready to moon yet
Strong candle implying new highs incoming
Watch for bearish stop hunt on new quarter
This is a bullish outside bar
MartyBoots here , I have been trading for 17 years and sharing my thoughts
👍 Enjoyed the insights?
Let me know your thoughts in the comments below — and don’t forget to like this post to support the channel!

Bitcoin can turn around from seller zone and start to declineHello traders, I want share with you my opinion about Bitcoin. The price previously broke above the support line and made a strong bullish move from the buyer zone (99300–100500 points). After the breakout, the price started rising steadily and is now approaching the Seller Zone (108500–109500), which also coincides with the resistance line of the downward channel. This area has shown strong bearish pressure in the past. Every time the price entered this zone, it quickly reversed. It’s a key area where many traders seek short-term opportunities. Currently, price is just entering this zone again and showing early signs of weakening momentum. Given the channel's structure, past price behavior near this resistance level, and the presence of the seller zone, I expect BTCUSD to turn around soon. Once the price rejects this level, I anticipate a reversal and a move back into the channel, continuing the downward trajectory. My first target is set at 103000 points, near the center of the range and above the support level (100500). This area has been tested multiple times before and may act as a strong buffer again. Please share this idea with your friends and click Boost 🚀
Disclaimer: As part of ThinkMarkets’ Influencer Program, I am sponsored to share and publish their charts in my analysis.

do not SHORT Bitcoin with 20XA consolidation range happens when the market trades sideways, in a neutral capacity. This sideways trading is neither bearish nor bullish, thus neutral. The bearish or bullish tendencies can only be defined based on the broader market structure.
If the consolidation range develops coming from a major drop, you can say that the market is bearish and the consolidation a bearish consolidation even if the breakout happens to the upside. Once it happens to the upside we can say that a reversal developed but the tendencies were bearish nonetheless.
If the consolidation range develops coming from a major rise, you can easy say while being correct that the market is bullish and the consolidation phase a bullish one, because of the bigger structure, previous price action and the chart.
Bitcoin is consolidating with bullish tendencies but there is a boundary which we call resistance and another boundary which we call support, this is the trading range. When the market is ranging, this is when margin traders lose the most because the trend remains hidden and money tends to be made when the market is in a clear trend.
Whenever the upper boundary gets challenged we get a retrace and a test of support. Whenever the lower boundary gets tested prices recover and move back up. This process gets repeated for as long as it is needed to remove all the weak hands, most of the signals are pure noise.
This is the situation in which we find Bitcoin today. Ultra-bullish but sideways and anything can happen short-term. Do not SHORT Bitcoin with 20X. You might end up with some fast and easy profits.
Thank you for reading.
Namaste.

#BTCUSDT: First $120,000 Then $140,000 Swing Move.Bitcoin has accumulated successfully and is currently on the verge of entering the next price zone, which is 120k, followed by 150k. There’s only one entry zone to consider. We’re confident that the price will move as planned, but it’s not guaranteed. Before taking entry, please conduct your own analysis.
If you like our work, please like, comment, and share.
Team Setupsfx_
❤️🚀

Bitcoin Breakdown? Support Zone & CME Gap in FocusBitcoin ( BINANCE:BTCUSDT ), as anticipated in my previous analysis , attacked the Resistance lines and then resumed its decline. In previous analysis, both Long and Short positions could have been profitable .
Bitcoin is approaching a Support zone($106,800-$105,820) and the CME gap($106,645-$106,295) .
From an Elliott Wave theory perspective , it appears that Bitcoin has finally completed a five-wave impulsive move with the help of an Expanding Ending Diagonal .
I expect Bitcoin to attack the Support zone($106,800-$105,820) after breaking the lower line of the Expanding Ending Diagonal .
Note: To break through the Support zone($106,800-$105,820), Bitcoin may potentially use either a Head and Shoulders pattern or a Bearish Quasimodo formation.
Note: If Bitcoin breaks the Resistance lines, we can expect more pumps.
Cumulative Long Liquidation Leverage: $106,249-$105,094
Cumulative Short Liquidation Leverage: $109,483-$108,790
Please respect each other's ideas and express them politely if you agree or disagree.
Bitcoin Analyze (BTCUSDT), 1-hour time frame.
Be sure to follow the updated ideas.
Do not forget to put a Stop loss for your positions (For every position you want to open).
Please follow your strategy and updates; this is just my Idea, and I will gladly see your ideas in this post.
Please do not forget the ✅' like '✅ button 🙏😊 & Share it with your friends; thanks, and Trade safe.

Internal and external liquidity Here's another mechanical lesson for you.
In my last post I covered a mechanical technique to identify swing ranges. Rule-based, simple and repeatable.
In this post, I want to share another little technique, again part of the mechanical series. But this time I want to talk about liquidity.
Most traders talk about liquidity, they might even have a grasp of what it is. But most do not know how liquidity forms the sentiment and how that creates a type of algo for the market.
You might have heard of Elliott wave theory. There is a saying along the lines of "you ask 10 Elliott traders for their count and you get 11 answers".
But the point is here, when you simplify the concept, it's clear to see that sentiment caused by liquidity swings is what causes a repeatable pattern in the market.
Let's take the idea of the ranges from my last post.
Now after a fair amount of accumulation, this level becomes "defended" - the price will gradually move up until old short stop losses are tagged and new long entries are entered into.
This allows the institutional players to open up their orders without setting off the alarm bells.
Price then comes back from external liquidity to find internal liquidity (more on this in a later post).
But then it looks for the next fresh highs.
As the highs are put in, we can use the range technique to move our range to the new area as seen in the image above.
Next we will be looking for an internal move, not just internal to the range, but a fractal move on the smaller timeframe that drives the pullback down. See this in blue.
The logic here is simple; on the smaller timeframes we have witnessed an accumulation at the 2 region and as we spike up for 3; we will witness a distribution on the smaller timeframes.
Wyckoff called this the accumulation, followed by a mark-up and then the distribution and a mark-down.
It is this pattern, over and over again that leads to this type of structure.
This will then be re-branded by various analysts who will call it things like a head and shoulders, smart money will see a change of character and a retest before breaking the structure.
This is all the same thing - just a different naming convention.
Again, I hope this helps some of you out there!
Disclaimer
This idea does not constitute as financial advice. It is for educational purposes only, our principal trader has over 25 years' experience in stocks, ETF's, and Forex. Hence each trade setup might have different hold times, entry or exit conditions, and will vary from the post/idea shared here. You can use the information from this post to make your own trading plan for the instrument discussed. Trading carries a risk; a high percentage of retail traders lose money. Please keep this in mind when entering any trade. Stay safe.

Bitcoin: Bearish Signal Watch 107,400 To Confirm.Bitcoin bearish pin bar developing, which is a bearish sign at least for the short term. IF this candle closes and low is compromised, (107,400?) A sell signal will be in effect (see arrow). This will also confirm a failed break out (see trend line) of a multi month consolidation. The signal in question is an ideal setup for swing traders or day traders looking for aggressive shorts, while the broader trend is completely intact. A reasonable price objective for such a move is the 103K area which is basically the mid point of the consolidation and near the 102 to 100K support. While the market can potentially break lower than that, there is NO way to forecast such an event. Market confirms first, then expectations can be adjusted effectively.
The wave count has been adjusted on this chart. The current consolidation is likely the sub wave 4 of the broader 5 which means implies the trend is still bullish since the sub wave 5 of 5 is not in play yet. Maybe after this next retrace? The next bullish setup (around 103K?) may present a high probability swing trade opportunity on the long side possible over the next week or two.
Keep in mind, it is not a good idea to get married to any opinions. I don't care how bullish the fundamentals are, all it takes is an unexpected catalyst and this market retraces hard. A week ago we were flirting with 98K, today 108K. Levels and price action are a much more accurate gauge of where the market is likely to go on the short term, and more importantly offer greater insight into the potential reward and RISK.
I adjust my outlook constantly because I know that the MARKET is ALWAYS right. It offers guidance if you know how to listen and be flexible. "Outlook" can be categorized by time which helps to keep expectations inline with market intent. For example, reward and risk expectations for a swing trade (4H time frame) will be smaller compared to a position entered for investment (weekly time frame). Keeping these expectations separate will help you control risk in a much more optimal way compared to having a swing trade turn into an investment.
Thank you for considering my analysis and perspective.

Will BONK hit 36% gain and reach 0.000020 soon?Hello and greetings to all the crypto enthusiasts, ✌
let’s dive into a full analysis of the upcoming price potential for BONK 🔍📈.
BONK shows strong potential as it approaches a key breakout point. The price is testing the upper boundary of a descending channel, and a successful breakout could push it toward the daily resistance level. 🚀 From here, the trade offers a possible upside of around 36%, with the main target at 0.000020.⚡
🧨 Our team's main opinion is: 🧨
BONK is set to break out of its downtrend with a potential gain of 36%, targeting 0.000020—get ready for a strong move upward 🚀
✨ Need a little love!
We put so much love and time into bringing you useful content & your support truly keeps us going. don’t be shy—drop a comment below. We’d love to hear from you! 💛
Big thanks , Mad Whale 🐋

Bitcoin BTC price analysis BTC.D and events calendar for JulyToday is the last day of the month and the last day of the second quarter, so there may be some volatility in the markets between 🐂 VS 🐻
💰 The CRYPTOCAP:BTC chart shows an interesting picture — the price has reached the upper limit of the consolidation channel, and now:
1️⃣ The scenario with an upward breakout is quite clear: a breakout from the channel upward and consolidation above $108-110k= a move to $125k during July.
2️⃣ A correction to $99k will mean that buyers have taken control of the OKX:BTCUSDT price, preventing it from updating its lows. This will be a clear signal to buy, because further growth is inevitable.
3️⃣ A deep correction to $91,660 (filling the GAP that formed on the CME BTC chart) or slightly lower. This is the last “unclosed” GAP, which, according to TA rules, should be filled for a full-fledged growth trend to begin.
So which scenario is closer to your heart, which one do you believe in?
Or write your version of events in the comments.
Interesting observations to think about:
◆ Over the past two weeks, the inflow of funds to #BTCETF has exceeded $5 billion, but the price of #BTCUSD on CEX exchanges has not been able to “break out” upward. Is this just ETF "property of numbers", or are spot #Bitcoin sales that strong?
◆ The BTC.D indicator has reached a critical level of 66%, and it will be interesting to see whether it will give altcoins some breathing room next month.
(If there are a lot of likes and comments under the idea, we will additionally describe our thoughts on BTC.D and USDT.D.)
◆ SP 500, by the way, has updated its highs, and the last few months on the stock market are very similar to the beginning and middle of the COVID-19 pandemic in 2020.
◆ And in principle, July promises to be very eventful:
👉 By July 9, Trump is expected to make a statement regarding the tariff wars with the rest of the world, which he has put on hold.
👉 July 18 marks the beginning of Mercury retrograde, which “influences” people's behavior and ‘superstitions’ and forces them to be “more cautious” when making trading decisions (and trading bots don't care about emotions and beliefs)
👉 And on July 30, there will be a FOMC meeting, where Mr. Powell may announce a rate cut, as the US is in a recession, which is time to acknowledge.
If we have forgotten anything, please add it in the comments!

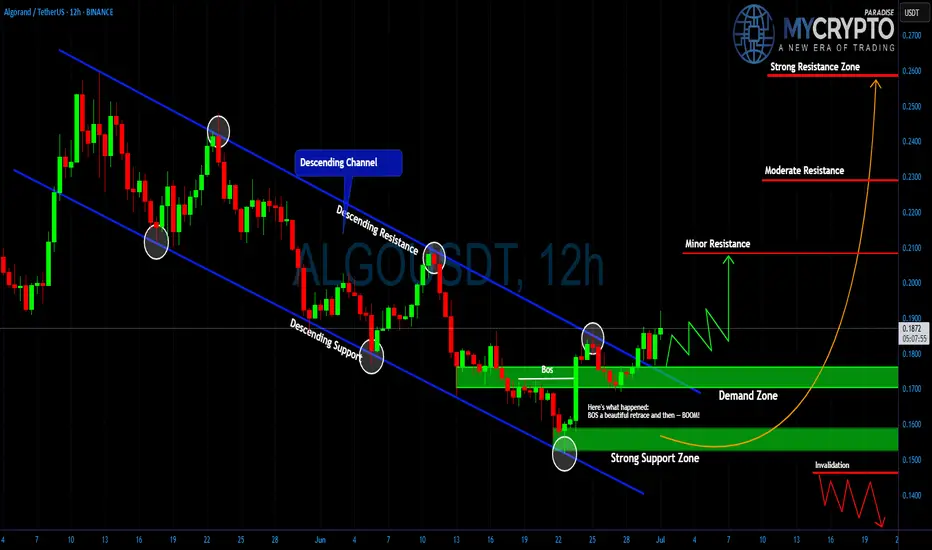
ALGO: Surprise Rally Ahead?Yello Paradisers, did you spot that breakout from the descending channel in time or are you still waiting for confirmation that already happened?
💎#ALGO/USDT has officially broken out of its multi-week descending channel after a textbook Break of Structure (BoS). Price action gave us a beautiful retrace into the demand zone, and from there boom momentum began shifting. This move is now showing early signs of bullish continuation, but as always, the majority will only realize it once the big move is already done.
💎#ALGO had been trading within a clearly defined descending channel, with price reacting precisely between the descending resistance and descending support lines. The breakout occurred after a strong candle pierced the descending resistance, and more importantly, we got a BoS followed by a clean retest of the demand zone around $0.165–$0.175. That reaction was sharp and decisive, indicating strong interest from buyers stepping in.
💎As of now, it is trading near $0.186 and forming higher lows, which supports the idea of an ongoing trend reversal. The structure has changed, and bulls are slowly regaining control. If price sustains above $0.190, the doors open for further upside. The first key level that could slow momentum is minor resistance near $0.210. If that level breaks with volume, moderate resistance around $0.230 becomes the next critical zone. Above that, the major target sits at $0.260, a strong resistance area where a lot of liquidity could be triggered.
💎On the flip side, the strong support zone between $0.145 and $0.155 remains our invalidation area. If price drops below this range, the bullish setup collapses, and we reassess the entire structure. But unless that happens, the bias remains cautiously bullish.
Trade Smart. Stay Patient. Be Consistent.
MyCryptoParadise
iFeel the success🌴
Short BTC, it is about to retrace and test 100000 again!As BTC gradually fell back, the rebound did not stand above 110,000 in the short term, proving that there is strong selling pressure above, and the trend line formed by the technical high point 111,000 and the second high point 110,000 formed an important resistance area, which limited the rebound space of BTC and strengthened the demand for BTC's short-term retracement.
According to the current trend, the short-term oscillation bottom area of 106,000 may be broken at any time. Once it falls below the oscillation area, it may arouse a certain degree of profit-taking chips and stimulate BTC to accelerate its decline. I think BTC will at least test the 105,000-104,000 area again during the retracement, and may even test the 100,000 integer mark again.
Therefore, shorting BTC is still the preferred option for current short-term trading.
Consider shorting BTC in the 108,000-109,000 area, and the target area in the short term is 104,500-103,500. After breaking this area, the target can be extended to 101,000-100,000.
BINANCE:BTCUSDT BINANCE:BTCUSDT BITSTAMP:BTCUSD

I believe this chart has bottomed, Alt szn is around the corner Recent PA had retested some great liquidity. I believe in a mini alt szn happening this week. So i believe the RR is worth it. Been a sleeping giant for a bit

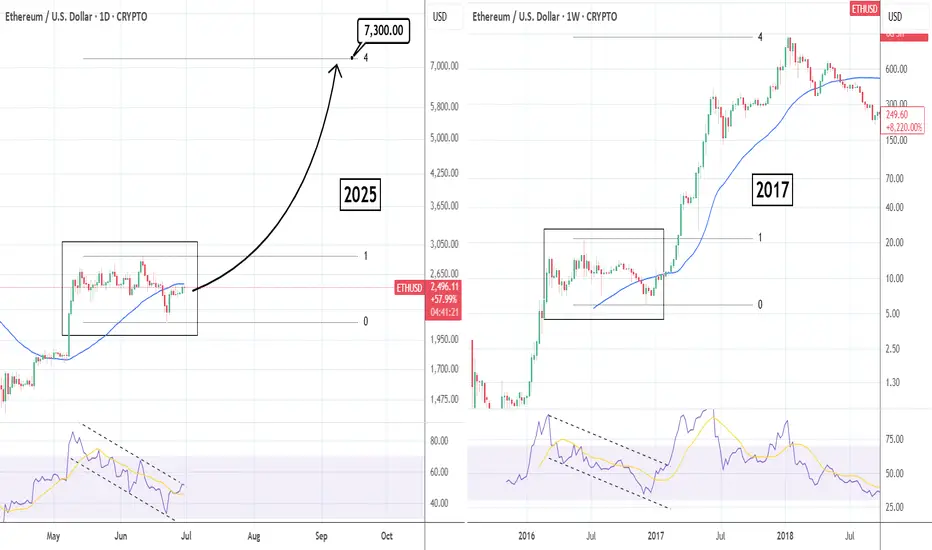
ETHUSD: Parabolic rally similar to 2017 targets $7,300Ethereum is neutral on its 1D technical outlook (RSI = 50.960, MACD = -24.810, ADX = 18.527), attempting to break over the 1D MA50, while still being inside a 6 week consolidation. This is no different than the 2016 consolidation on the 1W chart, that turned out to be just an accumulation pattern before a massive 2017 bullish breakout to the 4.0 Fibonacci extension. Time to go heavily long on ETH with TP = 7,300.
## If you like our free content follow our profile to get more daily ideas. ##
## Comments and likes are greatly appreciated. ##
Bitcoin Price Analysis! What's Next?Bitcoin Price Analysis! What's Next?
From our last analysis, Bitcoin increased from 107K to 108.5K
The price reached the limits of the pattern so far making everything more difficult because it increased, but with very low volume.
This time, BTC added some more data.
You may watch the analysis for further details
Thank you!

Lingrid | BTCUSDT possible Channel Break - Upside Surge The price perfectly fulfilled my last idea . BINANCE:BTCUSDT is pulling back slightly after rejecting the descending red trendline near the 108,000 level, while remaining above the breakout zone around 105,000. The structure suggests a potential bullish continuation if the price holds this level and forms a higher low. A successful breakout above 108,000 could ignite a move toward the 111,000 resistance band.
📈 Key Levels
Buy zone: 105,000–105,300
Sell trigger: breakdown below 105,000
Target: 111,000
Buy trigger: breakout and retest above 108,000 with strong momentum
💡 Risks
Failure to hold 105,000 reopens path to 98,700
Bearish rejection at 108,000 could maintain lower high structure
Weak volume breakout may lead to a bull trap under 111,000
If this idea resonates with you or you have your own opinion, traders, hit the comments. I’m excited to read your thoughts!

Chainlink, The Fed, Vanguard, Crypto & Apple"Buy the rumor, sell the fact." The market tends to price-in an event before it happens. I am talking about the reduction in interest rates. The participants are aware that there will be a reduction in interest rates by the Fed and this is bullish and so buying starts to happen much sooner compared to the announcement of the actual event. By the time the event becomes a reality, it is already priced-in. Meaning...
Chainlink is bullish now and the chart is the same as HIVEUSDT, which I shared just now, and many other altcoins. This is good because we know what happens next. If there are other pairs with the same chart but moving up, moving ahead, then we know that these two and all those other staying behind will also follow, makes sense? Sure it does. We are all one. What one does, the rest follows.
Chainlink (LINKUSDT) is set to grow. Easy to see, higher highs and higher lows.
Will the market go up because of the Fed? We can say so before or after the event, right now the only important action is to buy-and-hold. It is important to be fully invested in Crypto, because Crypto is outperforming every other risk-asset in the entire world. You want be in in the market that is about to pay. You don't want to be holding bonds or index funds, that's a huge mistake. You buy these stuff to make money, you can make with Crypto in 6 months what an index fund (Vanguard SPX) will pay in a decade... Do the math, are you a young adult, are you smart? If you are, take action now before it is too late.
Your choice of course. Imagine the people in the 80s investing in Gold rather than Google, Microsoft and Apple... Big mistake.
Namaste.
