%%%%% XAIUSDT UPDATE %%%%%#XAIUSDT
(UPDATE)
Hey dear members hope you all are enjoying our ideas and analysis. Now we are here to discuss about XAI.
XAI is on the way as predicted. Already 20%+ gain so far. Still getting a good volume. We can see gain upto 50%+ soon ✍
Crypto market

XAI - LongJust Use Lev. 2 or 3!
Entry 1: 0.7695
Entry 2: 0.6961
TPs: 0.8545 - 0.93 - 1.0215
SL: 0.6317
JUST TRADE WITH WAVES...

#PEPE / most likely scenario with stop-lossHello everyone
Pepe is above two key supports
First, the lower side of the BULLISH channel
And second, static support 1290
As long as it is above these two supports, the chance of growth towards the specified targets is high

bullish senario for near/usdtnear make the opportunity for everyone to have 35% profit at list
make sure to not miss that
as u can see near standing on double thing the trend and support !!!!!!
don't miss it guys <3

Highstreet (HIGH)On the above 4-day chart price action has corrected over 75% since the long idea published earlier this year topped out. Now sellers using emotions have provided you with a 2nd opportunity to go long. Why?
1) You know why.. The same conditions as before.
2) Price action resistance breakout.
3) Support and resistance. Price action returns to past resistance. Look left, green squares.
Is it possible price action could fall further? Sure.
Is it probable? No.
Ww
Type: trade
Risk: <=6% of portfolio
Timeframe: Now
Return: Will say elsewhere

$OSMO - 500% Gains Buy ZoneOsmosis is a blockchain on Cosmos. Its essentially the # 1 dex / blockchain on Cosmos. Imagine Osmosis being the uniswap of Ethereum but if Uniswap was its own blockchain not just a token like CRYPTOCAP:UNI
Currently Osmosis is stuck in a flag and looking to flip into a buy after failing to break the daily resistance 3 times on the daily supertrend indicator.
Buy Zone Begins $0.70 and can wick down as low as $0.52
Grab yourself a good entry and watch Osmosis fly to $3+

GRTUSDT Long Way UPthis is my idea about GRTUSDT pairs
will go up for long time for 1 week to 4 weeks
if you think about this trend you can enter with me .
GOOD LUCK GUYS

$BTC breaking out of the pennant(close)BTC in one day making megaphone and pennant. so target according to nearly 85k. always dyor

BTC to 75K then 80KBULL FLAG launch of Bitcoin should see a fast leg up to 75K then I see it coming back and testing ATH then going higher to 80K. I expect this move to be coming very soon. Using Channels, Fibs, And Elliot waves I show how I expect Bitcoin to launch here shortly.

Lines, Levels, PossibilitiesIt's too early to predict, but you can see the important levels and the possible channels.

XRP Range TradingXRP follows the price of BTC closely whilst trading in this range.
If you are anticipating a Bitcoin bull market soon, XRP may look good for short term swing trades up to the top of the range.

Bitcoin makes good profit. Now is just the beginning!!! UPDATE2Bitcoin is an invention designed to grow forever as long as we live.
If you see the same vision, don't forget to support the analysis.
I'm releasing UPDATE2 earlier than planned because today the channel reached *666* followers. The analysis is set for long-term updating.
It doesn't matter if the price is 70k or 50k as long as you see the big picture.
The world economy is still uncertain, we are hiding in cryptocurrency.
I prepared the analysis in a logical circle with altcoins!!
My analyzes are 100% my own and not manipulated by other people's opinions, I don't follow anyone here.
i could be wrong but this could be absolutely true.
I believe my truth, MoralDisciple


BTC (Bitcoin)BTC Primed for Upsurge Towards $100,000 Target Amidst Consistent Bullish Signals
Bitcoin (BTC) is poised for a significant uptrend, targeting the monumental price level of $100,000. The cryptocurrency market leader has been exhibiting strong bullish momentum, supported by a confluence of fundamental and technical factors.
Currently, BTC is consolidating within its recent price range, laying the foundation for its next leg up. Technical indicators, including moving averages and Fibonacci retracement levels, suggest that the asset is well-positioned for a sustained upward trajectory.
The recent correction in BTC price, while inducing short-term volatility, has provided a healthy reset for the market, paving the way for renewed buying interest. The support levels established during this consolidation phase, coupled with robust demand, underscore the resilience of BTC's bullish trend.
Furthermore, BTC's price action is bolstered by favorable macroeconomic conditions, including increased institutional adoption, growing mainstream acceptance, and inflationary concerns, which have led investors to seek alternative stores of value.
Key technical levels, such as the 21-day, 34-day, and 90-day exponential moving averages, continue to serve as strong support zones, reinforcing the bullish bias. Additionally, the Fibonacci extension levels project a clear path towards the $100,000 target, with interim resistance levels likely to be overcome as BTC gains momentum.
While the path to $100,000 is not without challenges, including potential regulatory hurdles and market volatility, the overall outlook for BTC remains overwhelmingly positive. Long-term investors are advised to capitalize on strategic entry points within the current consolidation phase, aligning their positions with the upward trajectory towards the target price.
In conclusion, Bitcoin's imminent surge towards $100,000 is supported by robust technical indicators and favorable market fundamentals. Strategic positioning and risk management will be key in navigating the volatile cryptocurrency landscape, but the potential rewards for investors who seize this opportunity are substantial.


TRX signal#TRON :small_red_triangle_down: moves in an ascending channel in the daily time frame and is in correction mode in the 4-hour time frame.
The price is close to the $0.11120-$0.10520 support area, which is a strong demand area.
Its long-term trend is upward, and the short-term trend is downward. To stabilize the upward trend in the 4-hour time frame, the price must break the dynamic resistance.

Short On Solana!I delay to enter the main Trigger
But Sell short finally...
Lets see my Target around 163!


UNI ( uniswap ) tm:1hHello traders.
I hope you doing well.
These areas are based on my personal strategy and I will share it with you.
Open a sell position on the supply area or open a buy position on the demand area.
Your entry point, stop loss, and target point are based on money management and the amount of money in your trading account.
But I promise you that by trading in the areas of my trading strategy, you will definitely make a profit, because these areas, although they seem simple, are my experience of 8 years of learning and trading.
I hope you will achieve maximum continuous profit with me by using supply and demand areas.
Good luck traders.
Mohammad Goodarzi

4000% move for Cartesi (CTSI) in 2024?At this time the market is offering a few ‘fantastic’ opportunities for outstanding returns. Yet, if you’re tuning into social media you might believe the whole market is about to explode. As wonderful as that may be, this is not 2017. You have to be selective, disciplined and patient. If you think that’s you, read this:
On the above 2 week chart after 1100 days of downtrend we have:
1) Price action and RSI resistance breakouts. The price action breakout is also the first higher high since August 2020!
2) Support on past resistance. Blue arrows.
3) The Bull flag pattern confirmation forecasts a 4000% move in price action from 20 cents to $8 (see below).
4) Markets do not go up in a straight line. You'll have to tolerate the odd 30-40% correction until target. Those swings trade opportunities will be mentioned elsewhere.
Is it possible price action might correct further? Sure.
Is it probable? No.
Ww
Type: trade
Risk: <=6%
Timeframe for long: days
Return: 3000-4000%
Bull flag

My view on BTCMy view on BTC in the following 4-12 weeks. We might see the new ATH at the end of July.

WIF/USDT (Requested TA): Next Big Move? The WIF coin has been asked many times to be analysed, so here it is.
Many compare it to BONK and PEPE memes, which have had a nice shoot since launch.
We see a similar outcome for WIF as a next generation meme coin, which might be pushed pretty high thanks to it's enthusiastic traders and holders.
Although we look for bullish outcome here, we will not be looking for very long stay in upper zones, so stay sharp and safe 😉
Swallow Team

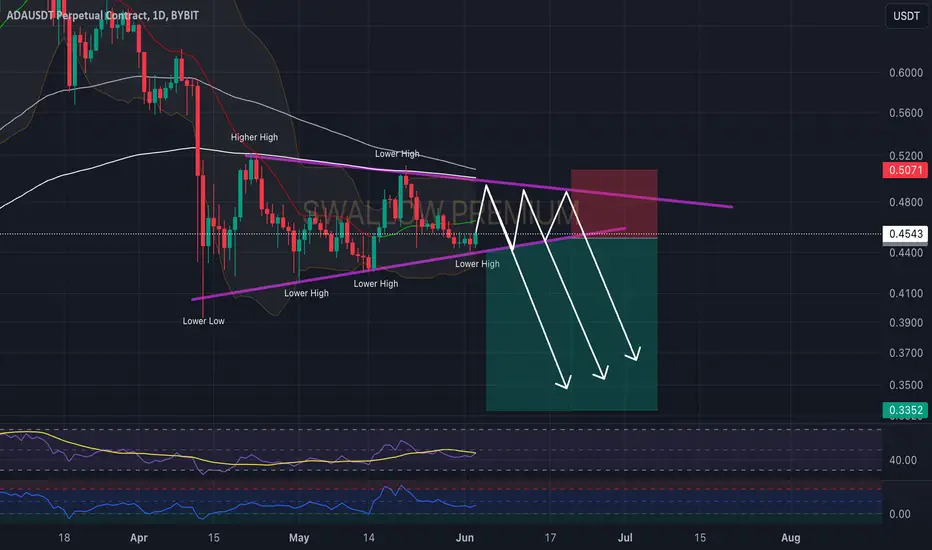
Cardano (ADA): Waiting For Breakdown Of Triangle Formation!Cardano is looking nice, forming a triangle, pressing both the lower and upper sides, and tightening the end gap of the triangle.
We are keeping an eye on the formation and also the EMAs here, which are indicating a potential further drop to happen here.
The reason is simple: We had a nice liquidation on April 12th, and we had some small re-tests (but they were weak), which indicate a potential further drop to happen.
So as long as we hold EMAs and move inside the triangle, we should be good for a possible downward movement here!
Swallow Team