MBOXUSDT UPDATE #MBOXUSDT(Update)
Hey dear traders. Hope you are enjoying analysis with our team. we are here to analyze MBOXUSDT today.
Symmetrical Triangle breakout done in 1D time frame .
Expecting Massive Bullish wave📈🚀
Crypto market

DARUSDT UPDATE #DARUSDT
UPDATE
Hey dear traders hope you are enjoying trading and analysis with our team. we are here to discuss about DARUSDT
Running towards our target 30% profit done ✅
Expecting more profit

Trade Signal for BTCUSDT: Sell**Direction:** Sell
**Enter Price:** 67540.01
**Take Profit:** 66458.64
**Stop Loss:** 68832.74
**Justification for the Forecast:**
This trade signal is generated based on a comprehensive analysis using the EASY Quantum Ai strategy. Several key factors have contributed to this prediction that BTCUSDT will move in a downward direction:
1. **Technical Analysis:** Recent price movements indicate that BTCUSDT is facing strong resistance near the entry price. Historical data from the EASY Quantum Ai strategy shows a significant number of rejections at this level, suggesting a high probability of a downward move.
2. **Volume Analysis:** An analysis of trading volumes indicates that selling pressure has been increasing, with sell orders significantly outweighing buy orders. This imbalance often precedes a price decline.
3. **Market Sentiment:** Sentiment analysis derived from social media trends and news headlines related to Bitcoin has shown an increase in negative sentiment. This is often a precursor to selling pressure as traders react to bearish news.
4. **Macro-economic Factors:** Recent reports indicate potential regulatory changes and economic factors that are less favorable for Bitcoin. These macro-economic elements contribute to a bearish outlook for BTCUSDT.
5. **Indicator Analysis:** The EASY Quantum Ai strategy utilizes a suite of technical indicators like moving averages, RSI, and MACD. Current readings show bearish crossovers and overbought conditions, further supporting a sell signal.
**Risk Management:**
- The **Stop Loss** is set at 68832.74 to limit potential losses, taking into account recent volatility and technical levels.
- The **Take Profit** target is placed at 66458.64, considering support zones and previous lows identified by the EASY Quantum Ai strategy.
This signal aims to capitalize on a short-term bearish trend while employing prudent risk management practices.
**Disclaimer:** Trading cryptocurrencies involves substantial risk, and it is essential to perform your own analysis before making any trading decisions. Always consider your risk tolerance and consult with a financial advisor if necessary.

Xemusdt Strong Buy opportunityXemusdt is demonstrating a rounding bottom formation, indicating a potential reversal pattern with the price targeting the immediate resistance level.
We've identified a robust demand zone, which could also serve as a buyback area if the price presents the opportunity.
Additionally, our immediate setup target aligns with the pattern neckline. A breakout above this neckline could trigger a significant move towards the projected setup target, as illustrated on the chart.
It's advisable to trade cautiously and implement appropriate stop-loss measures.
Your comments and likes on this post are appreciated.
Thank you.

$ROAR ing-Kittys ERC-20 is going parabolic RNthis is just a pure momentum play. i was in earlier today but as its finding some support and if momentum can stay strong buyers are willing to buy. well this could be an interesting morning to start the week that we have coming up. volume, sentiment, and order data is mainly what im looking at on this. maybe should be buying some gamestop GME calls in the morning if this thing has a good night

&&&& PEOLEUSDT TARGETS HITTED %%%%PEOPLE hitted out all targets as predicted. Now here this is getting a small retesting . After this small retesting it will again follow bullish wave. Alway trade with confidence

===== DYMUSDT LEAVING THE BOTTOM &&&&#DYMUSDT
(UPDATE)
Hey dear members hope you all are enjoying our ideas and analysis. Now we are here to discuss about DYM.
DYM is getting ready for big move. We can see here gain upto 150%+ easily. Always trade with confidence ✍

RUNEThe chart of RUNE looks very good on the daily.
I missed this trade but we will get another entry in the future.
KRAKEN is the only way to own in USA i think.
Daily Structure break and RSI are in step.
Higher Highs since June of 2023
RUNE = RUNS lol
TRADE SAFE

BTC Price Prediction and Elliott Wave AnalysisHello friends,
we are at a different crossroads running, irregular a flat pattern. or starting a huge bullish to end blue (X).
Thank you for joining me in my analysis. Remember to like, subscribe, and stay tuned for more updates. See you soon!
Thanks, Bros


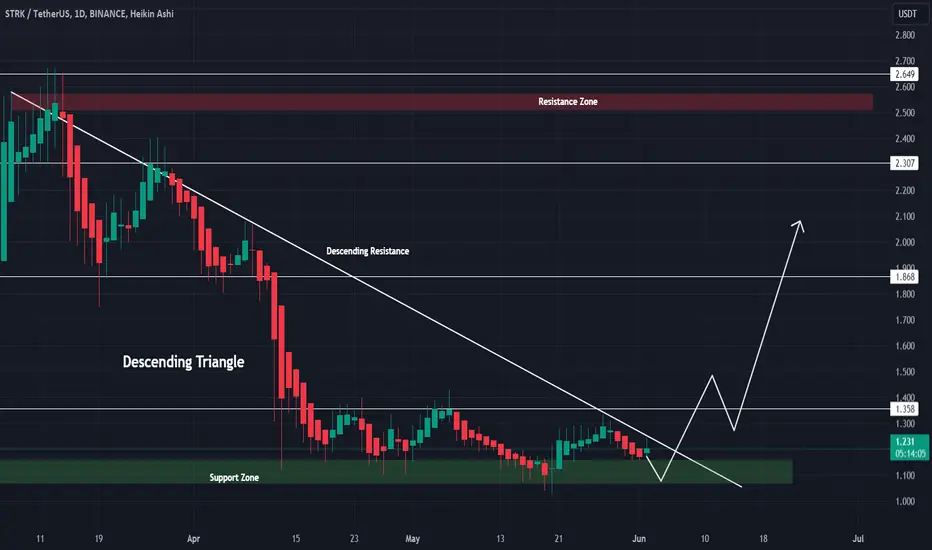
$STRK is trading within the descending Triangle chart patternSTRK/USDT
IDX:STRK is trading within the descending Triangle chart pattern. 🔺️ 🔎
The successful breakout is considered a Bullish signal. ⚡ 📈
The short-term price target for IDX:STRK is set at a minimum of 15% upside. 🚀 🎯
Don't miss it! DOGE analysis UPDATEEverything will pump soon and everything is still cheap today
BTC has reached BS or 70k and many other important factors are only good.
Only up
MoralDisciple

Patience is PERTINENT right now. When Bitcoin (BTC) finally enters price discovery with conviction, it will trigger a BTC dominance capitulation and dramatic alt coin outperformance.
Please study the visual and see for yourself.

XAI - LongJust Use Lev. 2 or 3!
Entry 1: 0.7695
Entry 2: 0.6961
TPs: 0.8545 - 0.93 - 1.0215
SL: 0.6317
JUST TRADE WITH WAVES...

#PYTH/USDT Token is testing a falling wedge resistance on the d#PYTH/USDT
Token is testing a falling wedge resistance on the daily timeframe🔍
After the breakout, SEED_DONKEYDAN_MARKET_CAP:PYTH needs to overcome a resistance level at $0.48 with the next target around $0.70 and then price could rise up to the $1.14 resistance zone👨💻

MATICUSDT LongMatic H1 chart, we see new strong bullish OrderBlock . Target price is 0.7160 level. Bulls can reach this level easily, so we can find some good entry here.

2024-06-02 bitcoin overview(Accumulation volume perspective)During the weekend, we observed sideways movement within a range, accompanied by significant accumulation.
Given the continuous uptrend in this range, it is a strong support area. While it could break significantly if breached, the accumulation suggests it's a strong bottom from a long-term perspective.
So far, we've seen some selling pressure due to short-term dips, but the selling pressure from the weekend accumulation hasn't been captured yet. The direction seems contingent upon the selling pressure when reaching two resistance levels.
With the monthly candle closing and the weekly candle changing tomorrow, we might see some directionality. Ultimately, since we're moving within a large triangle convergence, considering a significant direction change (a strong direction) might be more appropriate after breaking out of convergence.

$FTM continuation to the upside Simple idea, simple execution imo.
With the recent $10 million investment from renowned backers, my confidence in UPCOM:FTM has only grown stronger.
This significant injection of capital underscores the immense potential of UPCOM:FTM and the trust that influential investors have in its future.

The Anatomy of AltseasonHello community,
The cryptocurrency market operates through discernible phases , each presenting unique dynamics as illustrated in charts.
Initially, during the Bear market phase , Bitcoin's dominance surges while prices of cryptocurrencies across the board decline. This phase is marked by pessimism and a general lack of confidence in the market. As the bearish sentiment persists, the distribution phase ensues, characterized by a continued downtrend in prices. However, amidst this decline, periods of stability emerge during accumulation, where investors gradually start acquiring assets at discounted prices , anticipating a reversal in the market sentiment.
Moving forward, the BTC UP phase signifies a shift in market dynamics as liquidity is injected, resulting in stabilized dominance levels for Bitcoin. Despite this stability, altcoins typically do not witness substantial price increases , as the focus remains on bolstering Bitcoin's value to sustain the overall market sentiment. This phase often highlights the interplay between Bitcoin's dominance and the performance of alternative cryptocurrencies.
As Bitcoin achieves its predetermined objectives, its dominance begins to wane, paving the way for the ascent of altcoins. During the Altseason phase 1, the total market capitalization of altcoins experiences growth, accompanied by a relative stabilization or modest uptick in Bitcoin prices. This period represents a transition where the market shifts its attention from Bitcoin to alternative cryptocurrencies, reflecting evolving investor preferences and market dynamics.
The Altseason phase 2 ushers in a wave of heightened market activity, characterized by aggressive trading and speculative behavior. Traders, colloquially referred to as sharks, enter the market with the aim of capitalizing on short-term price movements for profit. This period often witnesses rapid and exaggerated fluctuations in prices, commonly known as pump and dumps, as market participants vie for quick gains.
However, such fervent activity is typically short-lived, as unsustainable price movements give way to a renewed sense of caution and the anticipation of a new bear market phase , marking the cyclical nature of the cryptocurrency market.
Happy trading !

#ARB/USDT ANALYSIS#ARB/USDT ANALYSIS
ARB has broken out of the ascending triangle and is currently retesting the area above it.
A successful retest would confirm a bullish trend, while a failed retest and a sustained breakdown of the triangle would confirm a bearish trend.
Psychology, discipline, and capital management are the three essential factors for achieving victory.
If you find our analytics valuable, please show your support by liking and commenting. Your engagement is greatly appreciated!❤️
Trade Wave.

PORTALUSDT(PORTAL) Daily tf Range Updated till 03-06-24PORTALUSDT(PORTAL) Daily timeframe range. another fairly new price action here. cause of that its gold mine of trading setups. if you can use range levels right its free profits. not much of holdup till 1.4189 all it needs retail interest. local support at 0.7491.

Just an 'IDEA' I think it will move like this , but mean while it can change , for now I think we need to close above EMA 200 first , then try to fill the FVG and get to fibo 50-61.8 .
