OM is bullishNASDAQ:OM - a very juicy bullish chart.
Perfect falling wedge breakout. This is how they set the stage for gigantic show.
Literally #MANTRA only takes a few green candles to make you all get bullish again.
Crypto market

Bitcoin ( 630,000.00$)September 2013
Bitcoin's performance in 2013 was marked by significant volatility and substantial growth. Here’s a detailed look at its performance throughout the year:
1. **Early 2013:**
- At the start of the year, Bitcoin was priced around $13.
2. **April 2013:**
- Bitcoin saw a rapid increase, reaching a peak of $266 in April.
- This surge was followed by a sharp correction, with the price dropping to around $50.
3. **Mid-2013:**
- After the correction in April, Bitcoin gradually recovered and stabilized over the following months.
4. **Late 2013:**
- In November, Bitcoin experienced another significant surge, driven by increasing interest and media coverage.
- It reached an all-time high of around $1,151 by December 2013.
5. **End of 2013:**
- By the end of the year, Bitcoin's price had slightly declined but remained above $700.
Overall, Bitcoin's price increased dramatically in 2013, starting from around $13 and peaking at over $1,150, reflecting a surge of more than 8,700% over the year. This period was characterized by heightened volatility, significant media attention, and growing interest from both individual investors and the broader public.

$OM will breakoutNASDAQ:OM running hard after my shared breakout. This bull flag will send it to around 3-4x.
As I have been saying, you are about to witness a monster run on #MANTRA.
Honestly, NASDAQ:OM is the most beautiful oversold chart. Soon huge green candles!!

$OM will go way higher. The best is yet to come for #MANTRA.
Do not be bearish now. The same exact investors that are too bearish right now, will be too bullish at the top…
Top Institutions are testing tokenization and NASDAQ:OM will go way higher.

trading much higher As long as we are able to hold NASDAQ:OM above the green zone, this is looking great.
Bears are now trapped. I hope you made use of these insane buying opportunities the past few days.
I'm looking forward to the coming weeks & months when #MANTRA will be trading much higher. We are perfectly prepared for the next leg of this Bull Run.


Ethereum (ETH) Market Analysis🔍Ethereum (ETH) is the coin of the day, a project that stands out from other altcoins due to its significant market dominance and substantial capital investment in both its network and coin. Unlike many other altcoins, Ethereum is less dependent on Bitcoin, making it an interesting asset to analyze independently.
🔄Previous Analysis Recap
In the previous analysis, it was suggested to enter a long position upon breaking 3798 with a target of 4063. After entering the position and reaching a risk-to-reward ratio of 2, I took partial profits and moved my stop loss to the entry point. The price did not move higher and eventually hit the stop loss at the entry point, resulting in a small profit due to the partial profit-taking.
⌛️4-Hour Timeframe
Current Situation: After forming a low at 3652, the volume has significantly decreased. Given the weekend lull, market momentum has completely dissipated. The 99-period SMA is approaching, potentially acting as the last hope for bullish momentum to re-enter the market.
🔑Key Levels:
Resistance: 3960 (first resistance), 4063 (key resistance)
Support: 3652 (current low)
⚡️Indicators:
RSI: Watch for a break above 54.46 for bullish momentum confirmation.
99-period SMA: Approaching price, may provide support or resistance.
📈Bullish Scenario
Entry: Break above 3960.
Target: Initial target at 4063.
If 4063 is broken and price stabilizes above this level, a significant upward move could be expected, especially benefiting Ethereum ecosystem coins.
Confirmation: RSI breaking above 54.46.
Long Position
Primary Trigger: Enter on a break above 3960.
Secondary Trigger: Enter on a break and stabilization above 4063 for a stronger bullish confirmation.
RSI Confirmation: Watch for a break above 54.46 to confirm bullish momentum.
Note: Monitor the price action around 4063 carefully, as it is a crucial resistance level.
📉Bearish Scenario
Entry: First trigger at 3719 (risky), main entry on a break below 3652.
Target: Following a break below 3652, look for confirmation of bearish momentum with a break below 41.03 on the RSI.
Short Position
Primary Trigger: Break below 3652.
Secondary Trigger: For a riskier entry, consider 3719, but the main focus should be on 3652.
RSI Confirmation: A break below 41.03 would confirm bearish momentum.
📝Ethereum is currently in a consolidation phase with key support at 3652 and resistances at 3960 and 4063. The low volume suggests that a significant move could be imminent. Traders should watch for breaks of these critical levels to enter positions, with volume and RSI serving as additional confirmation indicators. Always keep an eye on market conditions and adjust positions accordingly.
🧠💼It's important to acknowledge the inherent risks in futures trading, with the potential for margin calls if risk management is neglected. Always adhere to strict capital management principles and utilize stop-loss orders, ensuring that the initial target offers a risk-to-reward ratio of 2.
🫶If you enjoyed this analysis and want to support me, please boost this analysis. Feel free to leave a comment or suggest a coin you'd like me to analyze next.

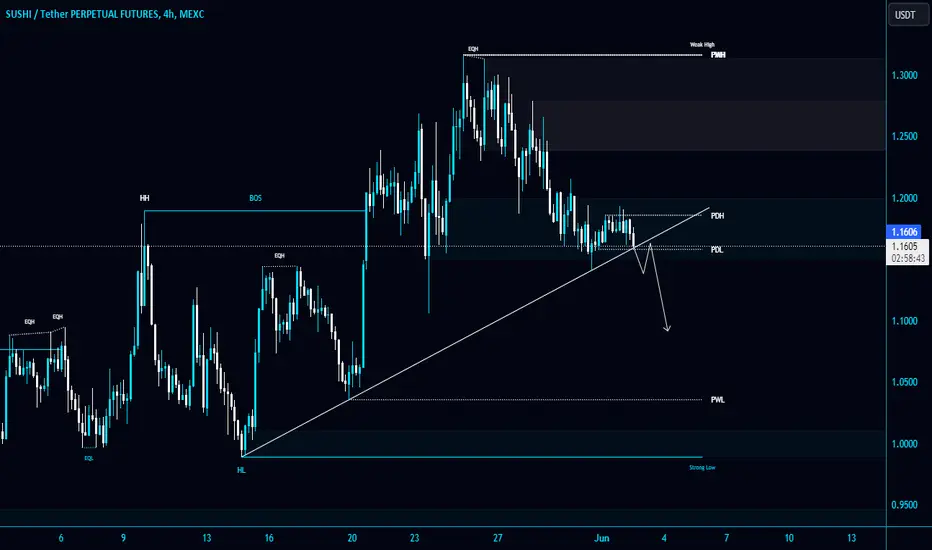
Keep an eye on the #SUSHI/USDT Diagonal Trendline in 4-Hour TF!Keep an eye on the #SUSHI/USDT Diagonal Trendline in 4-Hour TF!
Wait for BO/retest to open a Short position. The local support level is PWL $1.037.
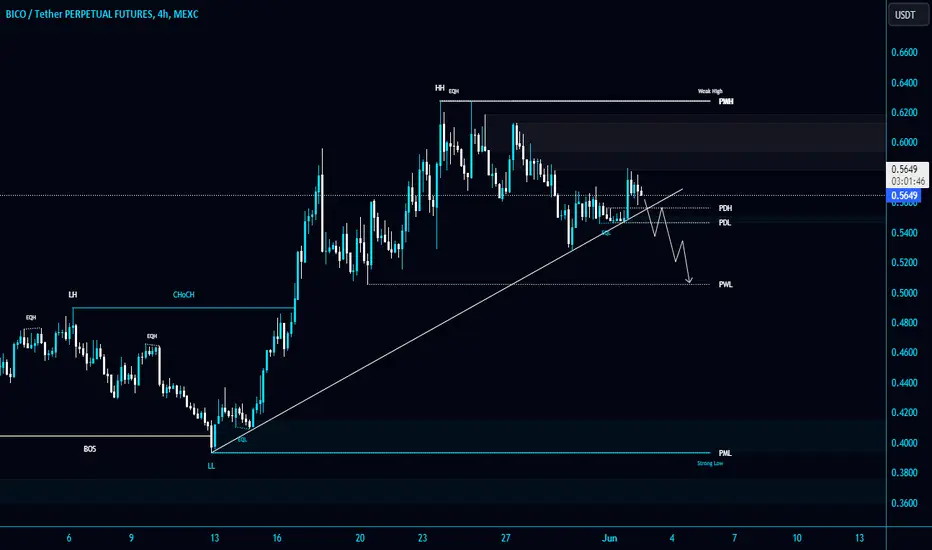
#BICO/USDT is trying to hold the Diagonal Trendline in 4-Hour TF#BICO/USDT is trying to hold the Diagonal Trendline in 4-Hour TF!
OMXSTO:BICO needs to hold this level to remain bullish. If it breaks down and retests, we can short it. The local support level is PWL $0.506.
BNB retracing back to 50%??this could be possible
the on monthly and weekly we can see the price action is sell on high and buy on low, and price recently hit the high and forming triangle on the daily time frame
we can see rsi falling and with price it could be bearish divergence
450-425 is the 50% from the swing low
let see how the structure forms .......

ETH wait for 3000 for buy/longCMP the price at eth is going side ways incase the price starts making lower low and lower high on daily time frame, then follow the structure and wait for change of trend at the zone of 3000 where we have a order block and we can if we see impulsive move towards it will be target for 4250

UNI/USDT formation of a 5 or a B; got another leg upAs the title suggests, feel free to comment tickers you want to get charted

suitable price for BUY and SALE? $TONToncoin (TON) is the native cryptocurrency of the decentralized layer-1 blockchain, The Open Network (TON). The TON blockchain is open-sourced and supported by many network contributors, including the Switzerland-based non-profit organization, the TON Foundation.

PYR is retesting the 100day SMA (Break or not)Technical Analysis only:
PYR have been testing the 100day SMA with a 3 time retest to the 4.1$ Support level which also has been acting as a strong support.
Moreover, we’re standing still waiting for a 100-day SMA break (Yellow line) to enter a long position with a TP 5.4$.
This is not a financial advice but rather my own idea and analysis.

Bitcoin - The Marco MazeHistory doesn't necessarily have to repeat! I see a lot of history based derivation for the timelines and price as to when and how high or low bitcoin can sore. As exciting and adrenaline pumping as these ideas seem, the outcome will just be as good as any coin toss! The truth however is the "macro maze" above. I've taken sensible assumptions to derive on the timelines and humanly possibe price floors and ceilings! In this environment sensible assumptions can easily turn out to be the most major blunder, so as I always say, please do your own analysis!
How to read the chart? It's quite simple, red is resistance or sell, green is support or buy. The intersections are where Bitcoin's price would likely be attracted to. There is no saying with precision when and where it would be. Kinda of like the Schrödinger's cat, you will only know when it happens. Anyone who says otherwise has a 50/50 chance of being right. Now, are you a trader or a gambler? Stay safe, peace out!
Disclaimer: These are not trading signals. Trade at your own risk!

DYDX - Highlight Wanted to highlight DYDX as the month as it has some very important patterns forming.
The chart on the right is the monthly and the chart on the left is the daily. Let's begin with the monthly chart.
The key level the bottom was created at is the psychological $1 level (white line). This is the most key level of support for DYDX on the macro. We just formed a doji candle on the monthly which could signal a reversal for DYDX back to the upside. We can also assume this is the case as the monthly RSI is trying to climb from oversold conditions back into the RSI channel which could really increase the momentum. TSX:GMX (a similar related coin) just climbed over 70% over the last couple weeks. With DYDX being an ETH narrative related token, and the ETH ETFS being recently approved, this could also provide fundamental/sentiment reasons for DYDX'S increase in price.
The daily chart gives us our current pattern which looks to be a falling wedge. Falling wedges are usually bullish patterns that lead to upwards price action. Upon breakout of our upper line of resistance we could see a substantial rise, but if the lower level of support is broken we could see an additional 40-50% collapse. Right now the bullish case scenario is much more likely as DYDX is also trying to establish the $2 level as a strong support level .

C&H inside C&H to a 1000% soon on solid project $BTAFThe Bitcoin Trend and Forecast token, $BTAF is performing a stunning pattern:
It is a Cup & Handle inside another Cup & Handle!
What you see is a bigger picture, some 15 months; it has performed a very large C&H that has already broke out from handle (downward yellow channel), with target at stunning 1000%
The handle of this bigger C&H formation is another C&H! This smaller handle is a perfect wedge that is sitting over the black VWAP line
Targets from yellow flag is 280% from today price and it coincides with the Beam Band (thin purple line) and target from the small C&H is 100%
But look at larger picture! While you go to 1000% you can make small profit takes on the way up

Wait for a sign!The 4-hour chart highlights key support zones around $0.0046 and $0.0041. The RSI shows a bullish divergence, indicating potential upward momentum. A breakout from the descending triangle could lead to a rally towards $0.0070, with further targets at $0.0120 and $0.0220. However, a failure to hold support may see prices testing lower levels around $0.0036

Short ABT (Arcblock) SELLHey! I think Arcblock will drop here.
It is very overextended in the larger time frame and looks ready for a correction.
Lots of other coins are also looking bearish.
- Dalin Anderson

OMUSDT IDEAHello Traders Hope You Are Enjoying Our Analysis. Today We Will Discuss About OM
(Analysis)
Running In +20% Profit So Far☑️
Moving Exactly As We Expected⚡️
I Expected More Profit In Coming Days✍️

BITCOIN MARKET ANALYSISThis publication not a financial advice. We just give our own opinion about the BITCOIN MARKET

Next 100% Pump for $Pambi Incoming Hello guys, this meme coin looks very promising general due to its big community, high volume a good chain, SOL, as well as the fact that the creator is a influencer with more than 11 million followers.
I am scooping up here as I interpret the micro structure as a first 1-2 Setup with successfully built out 5 waves to the up and 3 waves to the downside.
Looking for the pump in wave 3 next ;D
Definitely a meme coin play to add to my list!!
BITMART:PAMBIUSDT
Also tradable on Raydium.
No financial advise as always.
