EGLDUSDT Trading opportunitySpotted potential 5 waves correction down towards the 61.8% fib level from ATH zone. Price bounced off from important fibonanci zone of 61.8%, and the resultant from this zone confirmed major bottom to be in.
Focus on Buy Back zone to accumulate.
Crypto market

Tsukausd Buy opportunityTsukaUSD has formed a robust Morning Star pattern on the 3-day timeframe, a bullish reversal indicator. Consequently, the price has regained its position above the previous All-Time Low (ATL). The strategy is to accumulate the coin within the current demand zone and adhere to the stop loss indicated on the chart for effective risk management.

Lingrid | BITCOIN Ready for NEW ALL-TIME HIGHS ?The price perfectly fulfilled my previous idea. It reached the target level. As we can see, the BINANCE:BTCUSDT has broken and closed above the flag pattern, a classic trend continuation pattern. The bullish candle that accompanied this break signals a strong display of buying power, indicating a dominant trend. At this point, I anticipate two possible scenarios: the market continues to push upwards or consolidates below the resistance level, accumulating momentum for a potential all-time high (ATH). It's also worth noting that there is a likelihood that the market may pull back to retest the flag pattern before resuming its upward trajectory. In my view, the price will likely fall below the key support level of 70,000 before making its next move upwards. My long term goal is resistance around 73500.
Traders, if you like this idea or have your own opinion on this matter, write in the comments. I will be glad 👩💻

BIG SHORT ON BTC!!!!!!!!!!A hidden bearish divergence is printing on the daily btc chart which means a trend (bear) is likely to continue

Strong uptrend, FTM I don't think It will give you a chance to buy in a big retracement.
It doesn't look like touch the low again and check the support(Yellow line)
so you can set buy on here and set a stop-loss appropriately.
Trend is so bullish that it will touch weekly resistance zone.
There is a difference from other altcoins.

BITCOIN VISION 20/05 Hello everyone, here's my take on Bitcoin at the start of the week.
Since the beginning of the month, BTC seems to be on the rise again (+20% since May 1).
This Sunday, we recovered a large pocket of liquidity at $67250.
I'm a buyer of Bitcoin.
A very interesting buying zone is located at $62840!
✅ OTE
✅ Order Block in H4
So I'm going to focus on buying Bitcoin this week, with this entry point in mind.
Feel free to subscribe and put a boost on this post if you enjoyed my analysis, and tell me what you think!
Happy trading and a great week :)
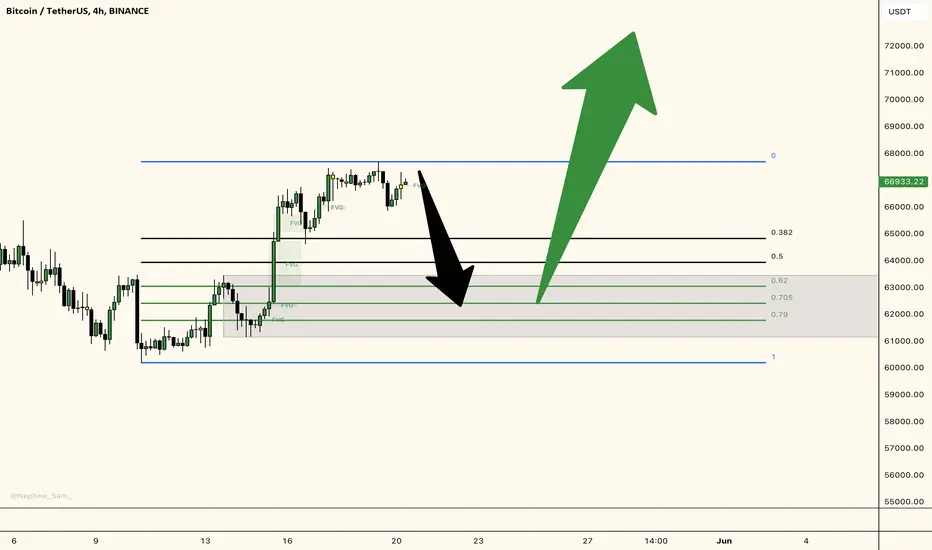
SAME IDEA FOR 4HSAME IDEA FOR 4H
NOTE FOR 1D (I think it will move like this, but meanwhile it can change. For now, I think we need to close above the EMA 200 first, then try to get back and fill the FVG. After that, we can get back above the EMA to reach the Fibonacci levels of 50-61.8.)

Opened ADA UP position at 0.482 price with 5x leverage Hi everyone,
In last 3 days ADA price increased on over 10% and I think that it's just a beginning.
I just opened ADA UP position at 0.482 price with 5x leverage on Fybit trading platform.
First target is 0.52, Second target is 0.62, Stop loss at 0.42
This is a high risk trade but potential reward is worth it.
Please, do not forget to boost this idea & share it with your friends; thanks.

Monthly Chart path for BTC 👩🚀HalvingIt's been a long while since I posted one of these so here goes!
This is an updated monthly overview on the idea path for the Halving event, many people have their opinion and they have some great points to where it may or maynot be headed. So here is my entry to where it may likely start the full process for the halving to work it's way to the 120k or 200k range.
Please be respectful in the comments and happy trading.
It took sometime to create the paths for it but here is my thoughts on the event, expect to drop as low as 50k to 45k up until june 1st. that's when the possible buildup for the event will take place. the market has to count all the orders but likely they'll be some great resistance to prevent further bleed-out but likely will fall to the 50k BTC - .00001200 for shib, before suddenly skyrocketing to the 70 - 80k or 90 to 120k as told by the events amount to be expected is 120k.
Note: it will either sit there for a short time before falling back to the 80k - 60k - range while resistance will be present the price correction will be a straight flat line to the lows of possible 20k to 10k BTC levels. this is due to Whales making a "sell all play" on BTC and shib cashing in on the millions obtained, and much of the market will likely do the same, as they see a new type of crypto winter. take over the market until early september 2025.
This is only speculation but this is also from experience with both cryptos the whales will make that sell-off happen and it will be painful to everyone holding come sept 9th this year.
So buy which crypto you want around June or now if you like, hold for the time being and wait for the event to build from the fresh entry it takes about a month or even two months to see results.
The only thing that could delay or derail this - would be if the Federal Reserve Bank decided to do price hikes within the months of June and October 2024, hopefully that won't be the case.
BTC WEEKLY CHART Halving event.
I hope this helps answer any of your questions.

Bullish Analysis of the MONGUSDT ChartBullish Analysis of the MONGUSDT Chart
The chart of MONGUSDT on the 1-day timeframe is displaying highly bullish signs, suggesting a strong potential for upward momentum. Here are the key points:
1. Market Structure Change:
- The chart marks a significant "Market Structure Change" where the trend transitioned from lower highs and lower lows to higher highs and higher lows. This is a clear indication of a shift from a bearish to a bullish trend.
2. Higher Highs and Higher Lows:
- The formation of higher highs and higher lows is a textbook indication of a bullish trend. This pattern demonstrates consistent buying pressure and suggests that the market participants are increasingly willing to buy at higher prices.
- The latest higher low is well-supported by an ascending trendline, adding to the bullish sentiment.
3. Strong Support Levels:
- The green ascending trendline shows that the price is respecting a strong upward support level. This trendline acts as a foundation for the bullish trend, preventing the price from falling below it.
4. Exponential Moving Averages (EMAs):
- The shorter-term EMA (likely the 50-day EMA) has crossed above the longer-term EMA (likely the 200-day EMA), forming a "Golden Cross." This crossover is a powerful bullish signal indicating the potential for sustained upward momentum.
5. Volume and Momentum Indicators:
- The increase in volume during the higher high formations suggests that the upward moves are supported by strong buying interest.
- Momentum indicators, such as the Relative Strength Index (RSI) at the bottom of the chart, are likely trending upwards, further confirming the bullish momentum.
6. Potential for Explosive Move:
- The purple arrow pointing upwards on the chart symbolizes a potential explosive move to the upside. This suggests that the market could experience a significant rally, propelled by the bullish market structure and strong support levels.
### Summary
The MONGUSDT chart presents a highly bullish scenario with clear higher highs and higher lows, a market structure change, strong support levels, and bullish technical indicators such as the Golden Cross. The combination of these factors indicates a robust potential for an upward breakout, making it an exciting opportunity for investors and traders. Keep an eye on the price action around the ascending trendline and the formation of new higher highs for confirmation of continued bullish momentum.

Bitcoin CUP and HANDLE pattern ☕️ Buy the dip-Take the sip🤩🤩60000 $ to 61000 $Price Range is quite holding well.
➣ Bitcoin price is forming rounding bottom in the 60k-61k price zone.
➣ While 65000 $ is the major resistance. We may some good action this point. But the Weekly and Daily uptrend is intact which confirming the BUYING sentiment.
➣Accumulate at current market price we may see further upside in coming sessions.

BTCUSD updateWhen they hate you work,when they gossip you work,it doesn't matter how others sees it but what is matter is what you see n trust what you do not what community n majority do,you do your own things your way.n trust your work nothing can stop you.

RIFUSDT Bullish Wave ComingDear Traders,
We are convening a discussion focused on #RIFUSDT
THE Falling Wedge Pattern Breakout Has Already Done ✅
So,I Expect a Bullish Move of 80% In Coming Days 🚀😉
Regards: AnnaTradeCharts
#Bitcoin #Crypto #Ethereum #Cryptocurrency #CryptoTrading #BTCUSDT #ETHUSDT #ALTCONS #USDT CRYPTOCAP:BTC CRYPTOCAP:ETH CRYPTOCAP:USDT CRYPTOCAP:PEPE CRYPTOCAP:DOGE NASDAQ:ALT

Now is a reasonable longWelp just like my last post stated, we had plenty of room on the daily to drop down to support. While I was hoping for a breakout upwards, we did drop out and have find some EMA support on the daily.
Hourly on the left is tight right now and primed for a move.

KMNO Long Bottom - Mirrors Sol Weekly ChartKamino is a token on Solana that you can stake and also use for liquidity to earn bonus rewards on their defi borrow lend program
Solana Weekly Chart is identical to Kamino
Long @ 0.054 - 0.056 range
TP @ 0.075 area
or hodl for $0.09+ and possibly new ATH
KUCOIN:KMNOUSDT

BCH Moving Higher - Last Time We Ever See This Price?Possible double bottom forming.
+ Summer/Fall Season after halving is when prices start going up.
+ BCH has been at this price before and many times.
+ RSI Under
+ MACD Under
+ Similar Chart to BTC around these prices.
One day it's going to be the last time you'll see BCH under $500. Could it be now?

PONKE from 2.50 to 0.180 discount. No brainer, SEED!Another meme coin to watchout.
This went parabolic on its listing day going from 2.50 to being trimmed down heavily to 0.1800 levels.
Now from the current data metrics, this is gradually shifting again with longs slowly piling up again.
Buyers are taking advantage of the discounted bargain levels and the 'light' MCAP numbers. This may give some multiple x price growth prospect. Returning to 2.50 will be the first interim target. If you know how PEPE has behaved in the past you already know the possibilities of this one.
The current range is an ideal seeding opportunity. The ticket is cheaper now.
Spotted at 0.180.
Again this is a meme coin, so be mindful. Volatility will always be a factor and sometimes the ETA of an expected move don't come sooner. But if you can wait, while you let your seed take it's time to sprout and grow - it will be worth it in the end.
Not a lot of people know this one yet -- but once this coin picks up, It will be too late, just like BONKS/PEPE's before the 20x era.
Buying a cheap ticket won't you hurt that much. :)
TAYOR.

Bitcoin makes good profit. Now is just the beginning!!! UPDATE2Bitcoin is an invention designed to grow forever as long as we live.
If you see the same vision, don't forget to support the analysis.
I'm releasing UPDATE2 earlier than planned because today the channel reached *666* followers. The analysis is set for long-term updating.
It doesn't matter if the price is 70k or 50k as long as you see the big picture.
The world economy is still uncertain, we are hiding in cryptocurrency.
I prepared the analysis in a logical circle with altcoins!!
My analyzes are 100% my own and not manipulated by other people's opinions, I don't follow anyone here.
i could be wrong but this could be absolutely true.
I believe my truth, MoralDisciple

Bitcoin : Targeting $245k For The First Phase of the Bull Run.Megaphone breakout. Currently Bitcoin is on a process of a breakout from the bullish megaphone pattern formation. If the retest can handle the pressure from sellers...this is going to be insane. Higher timeframe looking so super bullish.
No more caption needed.
Will be updating the idea once we confirm the breakout+retest of the current candle stick weekly close.

SOLUSDT / SOLANA USD SPOT Money Heist PlanMy Dear Robbers / Traders,
This is our master plan to Heist SOLUSDT based on Thief Trading style Technical Analysis.. kindly please follow the plan I have mentioned in the chart. Our target is Red Zone that is High risk Dangerous level market is overbought / Consolidation / Trend Reversal at the level Bearish Robbers / Traders gain the strength. Be safe and be careful and Be rich.
Note: If you've got a lot of money you can get out right away otherwise you can join with a swing trade robbers and continue the heist plan,
Loot and escape on the target 🎯 Swing Traders Plz Book the partial sum of money and wait for next breakout of dynamic level, Once it is cleared we can continue our heist plan to next new target.
support our robbery plan we can easily make money & take money 💰💵 Join your hands with US. Loot Everything in this market everyday.

COTIUSDT 1DSymmetrical triangle on the #COTI daily chart. Buy it on the breakout. Targets are:
$0.16658
$0.19308
$0.22587
$0.27880

AVAX, forming a good candleIt might seem like just going sideways, as this 4-hour candle is formed well, It'is good chance to buy setup.
Except if there's a bearish engulfing candle, you can expect to upside.

