USD/JPY Bearish Flag (30.06.2025)The USD/JPY Pair on the M30 timeframe presents a Potential Selling Opportunity due to a recent Formation of a Bearish Flag Breakout Pattern. This suggests a shift in momentum towards the downside in the coming hours.
Possible Short Trade:
Entry: Consider Entering A Short Position around Trendline Of The Pattern.
Target Levels:
1st Support – 143.40
2nd Support – 142.86
🎁 Please hit the like button and
🎁 Leave a comment to support for My Post !
Your likes and comments are incredibly motivating and will encourage me to share more analysis with you.
Best Regards, KABHI_TA_TRADING
Thank you.
Disclosure: I am part of Trade Nation's Influencer program and receive a monthly fee for using their TradingView charts in my analysis.
Forex market

AUDCHF AUDCHF is preparing to break through support and fallWeak market structure. Gradually declining lows and no reaction to support at 0.5211. Buyers are trying to keep the price above 0.5211, but under market pressure their strength is weakening.
Relative to 0.5211, we see the formation of consolidation, which is of a “pre-breakdown” nature.
Accordingly, a break below the 0.5211 support level could trigger the activation of buyers' SL orders, leading to liquidation and a downward price distribution.
Potential targets include 0.518 and 0.5164.

EURO - Price can start to decline from resistance line of wedgeHi guys, this is my overview for EURUSD, feel free to check it and write your feedback in comments👊
Some days ago price grew to $1.1500 level and even broke it, after which started to decline in wedge.
Price declined to support line, breaking two levels, after which it turned around and started to move up.
Soon, EUR broke $1.1215 level and then rose more, after which made a correction to support line.
Then price in a short time rose to $1.1500 level, broke it one more time, and tried to grow more, but failed.
But recently it turned around and quickly rose to resistance line of wedge and now trades near.
In my mind, Euro can bounce from resistance line and fall to $1.1520 support line of wedge pattern.
If this post is useful to you, you can support me with like/boost and advice in comments❤️
Disclaimer: As part of ThinkMarkets’ Influencer Program, I am sponsored to share and publish their charts in my analysis.

NZDUSD → Pre-breakout consolidation. One step away from a rallyFX:NZDUSD is consolidating, but the chart shows signs of readiness to shift to a distribution phase, which could lead to a rally.
Against the backdrop of a falling dollar, which is continuing its main trend, the NZD may break out of consolidation in a distribution pattern. Since the accumulation is quite large (taking into account the long squeeze), the trend may be strong.
A pre-breakout consolidation is forming relative to 0.6080, followed by the price breaking through the resistance of the global trading range. Consolidation above 0.6080 will confirm the breakdown of the structure, which could trigger distribution
Resistance levels: 0.6080, 0.612
Support levels: 0.6062, 0.604
The price may be supported by a bullish trend and a decline in the dollar. A breakout from the 4-month consolidation may be accompanied by a continuation of the uptrend until the intermediate high of 0.6355 is reached in the medium term.
Best regards, R. Linda!

USDCHF Analysis Today: Technical and Order Flow Analysis !In this video I will be sharing my USDCHF analysis today, by providing my complete technical and order flow analysis, so you can watch it to possibly improve your forex trading skillset. The video is structured in 3 parts, first I will be performing my complete technical analysis, then I will be moving to the COT data analysis, so how the big payers in market are moving their orders, and to do this I will be using my customized proprietary software and then I will be putting together these two different types of analysis.

#CADJPY:Targeting 130.00 Almost 30,000 Pips Swing TradeThe long-term outlook for CADJPY remains extremely bullish in the coming week. My initial target is 115, followed by 120, and ultimately 130. This would result in a total of 30,000 pips of movement in the swing. Please use this analysis for educational purposes only.
Good luck and trade safely!
Like, comment, and share this idea!
Team Setupsfx_
❤️🚀

eurusd outlook Eurusd overall bullish HTF, however I do identify alignments within wyckoff distribution. Keeping an eye on the 4hr sponsored candle, ltf fvg at 1.62 area for my next possible bullish swing into the weekly high. Until then let's see if the market can support short term bearish reversal into the area of interest.

USDJPY: Intraday Bearish ConfirmationLast week, I shared an update on a confirmed structure breakout for 📉USDJPY on a 4-hour chart.
On retesting the broken structure, the price showed a strong bearish signal.
I observed a rising wedge pattern with a broken support line
This breakout suggests a high likelihood that the price will decline to the 143.81 / 143.31 levels.

NZDJPY Potential UpsidesHey Traders, in today's trading session we are monitoring NZDJPY for a buying opportunity around 87.250 zone, NZDJPY is trading in an uptrend and currently is in a correction phase in which it is approaching the trend at 87.250 support and resistance area.
Trade safe, Joe.

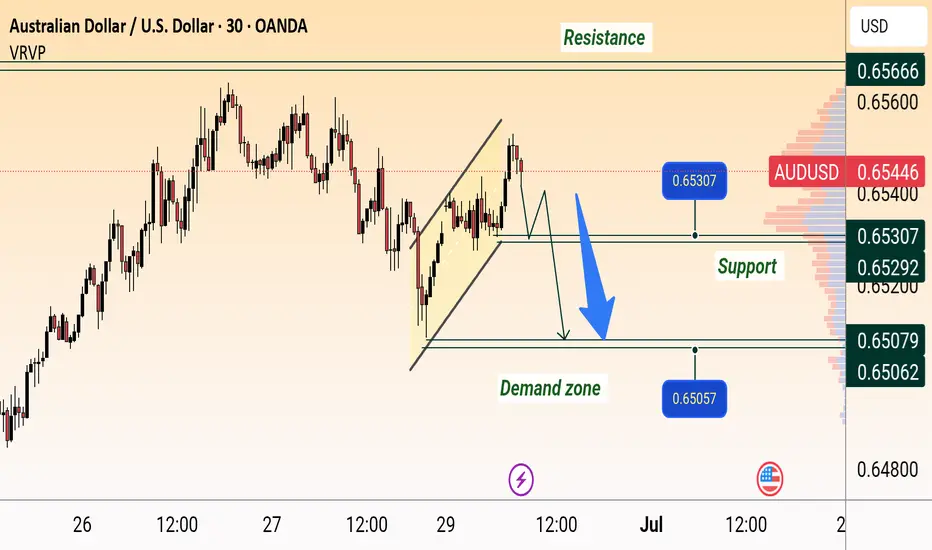
AUD/USD Bearish Reversal SetupAUD/USD Bearish Setup:
Price is showing rejection near resistance around 0.65600 and has broken below the rising channel. A retest of the broken trendline may lead to a drop towards the support zone at 0.65307, and potentially further to the demand zone around 0.65057–0.65000.
GBP/USD Bearish Reversal Pattern Detected GBP/USD Bearish Reversal Pattern Detected 🔻🦈
The chart illustrates a potential bearish Gartley pattern formation near the 1.3736 resistance zone, which has historically triggered price rejections (red arrows).
🔍 Key Observations:
📌 Price action completed a bearish harmonic pattern, suggesting a reversal setup.
💡 Multiple rejections at the upper resistance zone (1.3730–1.3780) highlight strong selling pressure.
📉 Break of trendline support confirms shift in structure.
🟠 Historical support zones (orange circles) now align with the projected target level: 1.3512.
🔽 A clean breakdown below 1.3650 could accelerate bearish momentum toward the target.
🎯 Target: 1.35124
🛑 Resistance: 1.3730–1.3780
✅ Support: 1.3510–1.3550 zone

Lingrid | EURUSD Pullback - Continuation Trading OpportunityFX:EURUSD is consolidating above the upward trendline after forming a higher high and pulling back toward dynamic support. Price structure remains bullish within the rising channel, and a rebound from the 1.1640–1.1700 zone could trigger the next leg higher. If bulls regain momentum, the pair may aim for the 1.1850 resistance ceiling within the target area.
📈 Key Levels
Buy zone: 1.1640–1.1700
Sell trigger: breakdown below 1.1640
Target: 1.1850
Buy trigger: breakout and retest above 1.1750 with strong momentum
💡 Risks
Breakdown below the upward channel may signal a broader reversal
Weak bullish reaction from trendline could stall upside progress
Failure to reclaim 1.1750 resistance keeps price vulnerable to deeper pullbacks
If this idea resonates with you or you have your own opinion, traders, hit the comments. I’m excited to read your thoughts!

EURUSD 30M Engaged ( Bullish Entry's Detected )————-
➕ Objective: Precision Volume Execution
Time Frame: 30-Minute Warfare
Entry Protocol: Only after volume-verified breakout
🩸 Bullish Wave Coming From : 1.17250
➗ Hanzo Protocol: Volume-Tiered Entry Authority
➕ Zone Activated: Dynamic market pressure detected.
The level isn’t just price — it’s a memory of where they moved size.
Volume is rising beneath the surface — not noise, but preparation.
🔥 Tactical Note:
We wait for the energy signature — when volume betrays intention.
The trap gets set. The weak follow. We execute.
EURUSD 30M Engaged ( Bullish Entry's Detected )

EUR/USD - Liquidity grabbed! Move towards the 4H FVG next?This chart illustrates a short-term bearish outlook on the EUR/USD currency pair, using smart money concepts like liquidity grabs, fair value gaps (FVGs), and structural levels such as support and protected lows. It is based on the 1-hour timeframe and references a higher timeframe (4H) for added confluence.
Liquidity Sweep
At the top of the recent price movement, a "Liquidity sweep" is marked, suggesting that the market pushed above recent highs to trigger stop-losses of short positions or entice breakout traders before reversing. This kind of move is common in smart money concepts and typically precedes a directional shift, which in this case, is anticipated to be downward. This sweep likely removed buy-side liquidity and indicates that institutional traders may now seek to target sell-side liquidity below recent lows.
Support Zone
The green shaded area labeled "Support" represents a previous consolidation or demand zone that temporarily held price after the liquidity sweep. This zone is seen as a short-term reaction point where price may consolidate or bounce slightly before continuing lower. However, the dashed black line projection suggests that this support is not expected to hold long-term, as price is forecasted to break below it.
Protected Low
A previous low is labeled "Protected low," implying that it hasn’t been violated during recent downward moves. This term often refers to a structural level that, if broken, confirms a shift in market structure. In this context, the projection anticipates that price will break below this protected low, indicating a bearish intent and unlocking further downside movement.
4H Fair Value Gap (FVG)
The large blue zone labeled "4H FVG" marks an imbalance or inefficiency on the 4-hour chart. This zone is referred to as a "Strong bullish 4h FVG," suggesting that once the sell-side liquidity is taken and the lower targets are met, this area is expected to act as a high-probability demand zone. Institutional traders often look for price to fill these FVGs before reversing, as they represent unmitigated institutional orders. The projected path implies that this is the ultimate downside target where price may react bullishly.
Conclusion
Overall, this analysis outlines a bearish short-term scenario for EUR/USD. After sweeping liquidity above recent highs, price is expected to respect the bearish order flow, break through the current support level, and move below the protected low. The ultimate downside target lies within the strong 4H FVG, where a significant bullish reaction might occur. This suggests a classic smart money play, manipulate (sweep liquidity), shift (break structure), and mitigate (return to FVG)—offering a well-structured trade idea for both intraday and swing traders.
Disclosure: I am part of Trade Nation's Influencer program and receive a monthly fee for using their TradingView charts in my analysis.
Thanks for your support.
- Make sure to follow me so you don't miss out on the next analysis!
- Drop a like and leave a comment!

GBPJPY: Bullish Impulse May Take Price To 205! 700+ Pips MoveGBPJPY is in steady bullish move in other words it is in impulse move; price has not yet exhausted and there is still extended bullish move to completed before bears takes control over. Please use accurate risk management while trading and do your own analysis.
LIKE
COMMENT
SHARE
Good luck.
Team Setupsfx_

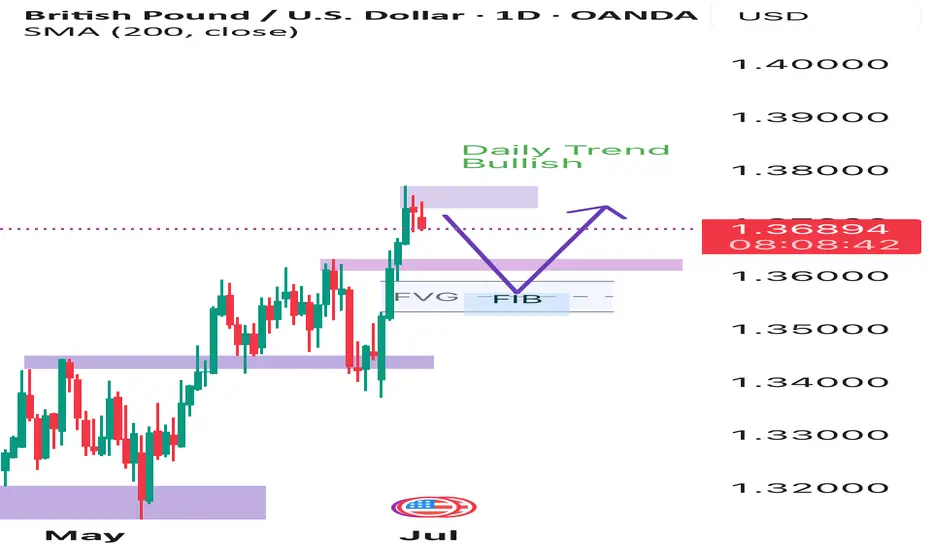
EURUSD OUTLOOK 1 - 4 JulyStill Bullish on EU. No Fundamental or technical reasons to be short.
We could have a short term pullback within the daily range to then continue long..
If we get that 4H pullback I will only long after getting a 4H technical confirmation.

Euro will make correction to support line of channelHello traders, I want share with you my opinion about Euro. In this chart, we can see how the price entered to triangle, where it at once bounced from the support line and rose to the 1.1100 support level, which coincided with the buyer zone. Soon, price broke this level, after a small correction, and continued to move up to the 1.1575 current support level, which coincided with the support area. This area also coincided with the resistance line of the triangle, and the Euro rebounded from this line and started to decline. In a short time, it declined to the buyer zone, where it turned around and started to move up. Soon, Euro exited from triangle and continued to rise inside an upward channel, where it made a correction first and then continued to grow. Later, EUR rose to 1.1575 current support level, one more time and even almost broke it, but failed and corrected. But soon, it finally broke this level and rose to the resistance line of the channel, where at the moment it continues to trade near. In my mind, Euro will rebound from this line and go to the correction until to support line of the channel, breaking the support level. For this case, my TP is located near this line - at the 1.1490 points. Please share this idea with your friends and click Boost 🚀
Disclaimer: As part of ThinkMarkets’ Influencer Program, I am sponsored to share and publish their charts in my analysis.

GBPCHF: Strong Bearish SignalGBPCHF has been in a prolonged consolidation since mid-June, remaining within a significant horizontal range on the 4-hour chart.
Following the weekend market opening, the pair appears to be strongly bearish.
The violation of a support level within this range suggests the end of a bearish accumulation phase, creating potential for further upward movement, with the next resistance level to watch at 1.0889.

GBPUSD: Targeting 1.4200 Swing Move Target! Swing Trading GBPUSD: We’ve identified a key reversal zone where our long-term take-profit target is set at 1.4200. This is a long-term approach, but in the short term, we could target 1.3900, which is a reasonable take-profit area. Before taking any buying entry, please do your own analysis.
Good luck and trade safely!
Like
Comment
Share
Team Setupsfx_

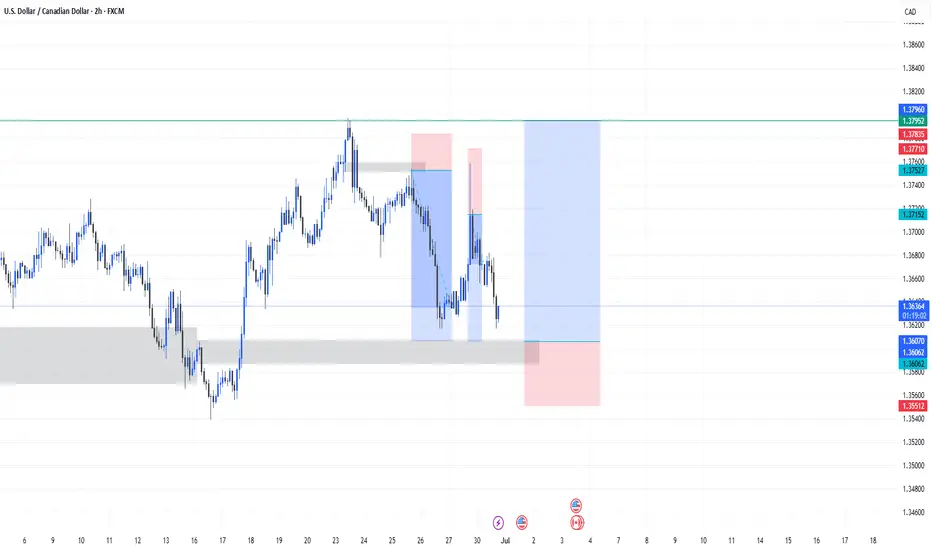
USDCAD long trade setup for this week📈 USDCAD Long Setup Idea – Weekly Play 💯
Here’s a clean bullish setup on USDCAD (2H timeframe) I’m eyeing for this week:
🔹 Key Zones:
- Demand Zone: Strong reaction from the 1.35500–1.36000 area, with price respecting this grey support block multiple times.
- Supply Flip: Previous structure zone turned potential demand.
🔹 Entry:
- Long position placed after liquidity grab and bullish rejection within the demand zone.
- Market structure is beginning to shift bullish after consecutive lower highs and lows broke.
🔹 Risk Management:
- SL below the demand zone at ~1.35512
- TP set near previous high around 1.37960 (resistance zone)
🔹 RRR (Risk to Reward Ratio):
- Solid risk/reward potential on this play – targeting a 3R move if momentum holds.
🔹 Trade Bias:
- Looking for a deeper retracement continuation up, aligning with possible DXY pullback.
- Watching for confirmations like bullish engulfing or structure break for entry trigger.
📊 Stay patient, follow price action, and manage risk properly.
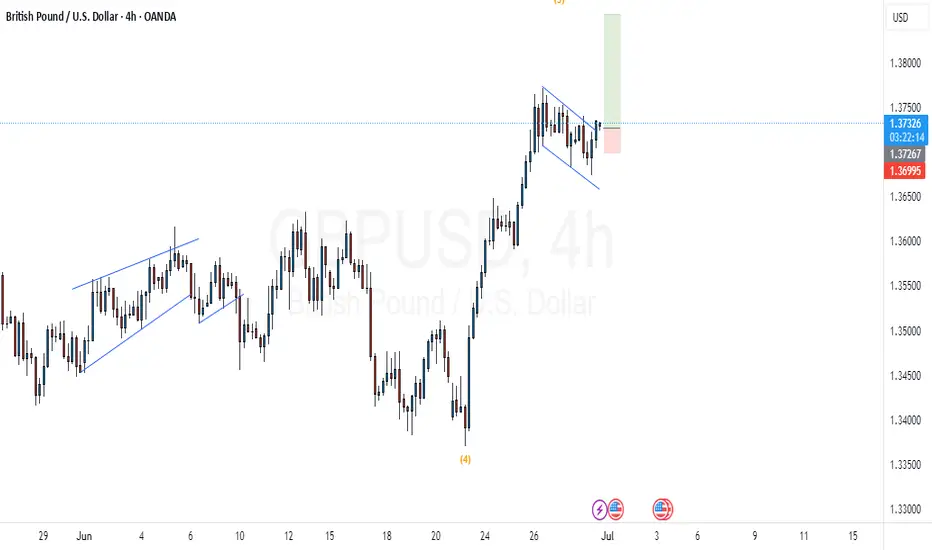
GBP/USD What do people’s think about my chart 😅 waiting for hourly to match daily trend before placing a trade
Bullish IdeaMarket forming what seems to be a bullish flag pattern, which results into an upward move. So we expect a good bullish pattern. Break out the structure and we
ready for the show now
Smart Scalping on GBP/USD: 15-Minute Chart StrategyUnlock the power of precision trading with my exclusive GBP/USD 15-minute scalping strategy. This isn’t just another chart setup—it’s a battle-tested system built on real-time confluence: EMA crossovers, RSI confirmation, Supertrend alignment, and Fibonacci retracement zones. Every trade idea I share is backed by deep analysis, strict risk management, and a clear entry/exit plan.
Whether you're a beginner looking to learn or a trader seeking consistency, my strategy delivers clarity in the chaos of the markets. Join me to gain access to high-probability setups, live breakdowns, and mentorship that turns theory into profit.
💼 Ready to level up your trading? 💸 Invest in insights that pay for themselves. 📈 Let’s grow together—one smart trade at a time.
