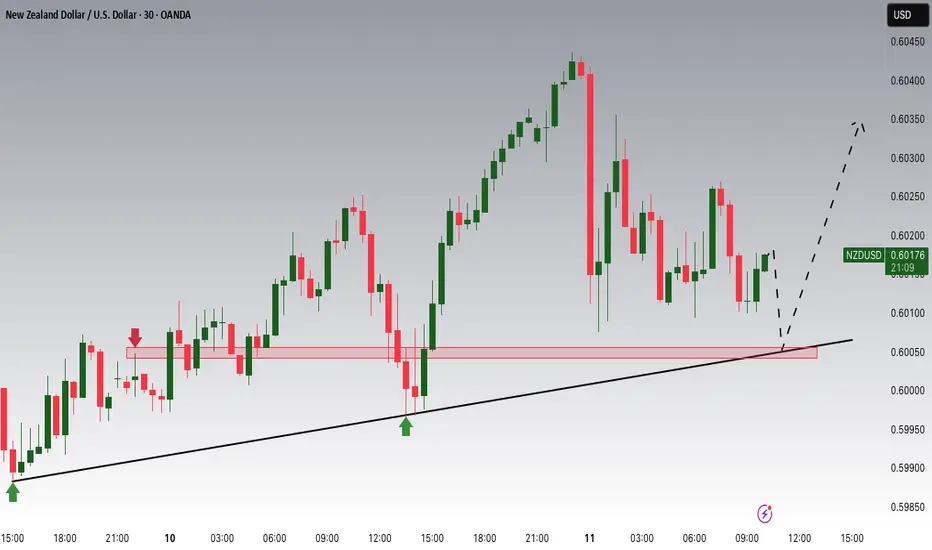
NZDUSD Potential UpsidesHey Traders, in today's trading session we are monitoring NZDUSD for a buying opportunity around 0.60000 zone, NZDUSD is trading in an uptrend and currently is in a correction phase in which it is approaching the trend at 0.60000 support and resistance area.
Trade safe, Joe.
Forex market
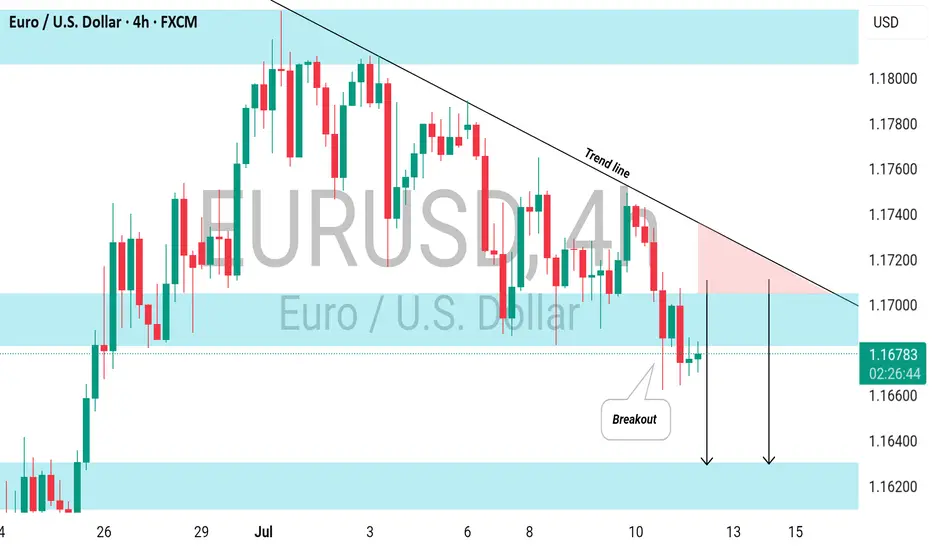
EURUSD: Bearish Continuation Ahead EURUSD is expected to maintain a bearish trend following a confirmed breakout below a significant horizontal support level.
The broken structure, along with a descending trend line, creates a contracting supply zone, indicating a strong likelihood of further downward movement.
The next target is 1.1620 support
EURAUD: Rebound to 1.798 is high probabilityI am watching for a reversal here EURAUD as marked on my chart, expecting a rejection with a upside target at around 1.798.
This are is where it can become a decision point, either price finds support and bounces, or it breaks below, and that’s when we might see the move start to extend lower.
If we get a decisive move upside, my next area of interest is marked as T2. From there we can expect either potential accumulation or another reaction, depending on broader market sentiment at the time.
Just sharing my thoughts for the charts, this isn’t financial advice. Always confirm your setups and manage your risk properly.
Disclosure: I am part of Trade Nation's Influencer program and receive a monthly fee for using their TradingView charts in my analysis.

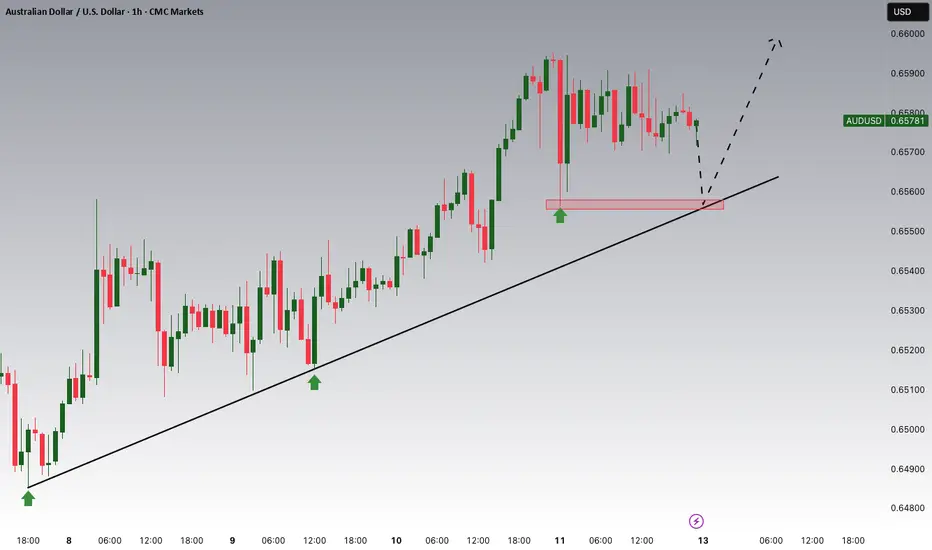
AUDUSD Potential UpsidesHey Traders, in today's trading session we are monitoring AUDUSD for a buying opportunity around 0.65550 zone, AUDUSD is trading in an uptrend and currently is in a correction phase in which it is approaching the trend at 0.65550 support and resistance area.
Trade safe, Joe.
USD/CHF (1-hour timeframe)USD/CHF (1-hour timeframe), the analysis appears to include:
Ascending triangle pattern (with higher lows and a horizontal resistance).
Ichimoku Cloud for trend analysis.
Two marked target levels with projected breakout potential.
Identified Targets:
1. First Target:
🔹 Around 0.80000
This is just above the current resistance zone and seems to be the initial breakout target if price breaks the horizontal resistance.
2. Second Target (Final Target):
🔹 Around 0.80300 – 0.80350
This is the next higher resistance or profit-taking zone based on projected move from the triangle breakout.
---
Summary:
If the price breaks and closes above the horizontal resistance (approx. 0.79850), your potential targets are:
🎯 Target 1: 0.80000
🎯 Target 2: 0.80300–0.80350
Keep an eye on price action and volume confirmation before entry. Let me know if you want stop-loss suggestions or a risk/reward breakdown.

USDCAD I Weekly CLS I Model 1 I KL - OB I Target CLS LowYo Market Warriors ⚔️
BIG SHORT — if you’ve been riding with me, you already know:
🎯My system is 100% mechanical. No emotions. No trend lines. No subjective guessing. Just precision, structure, and sniper entries.
🧠 What’s CLS?
It’s the real smart money. The invisible hand behind $7T/day — banks, algos, central players.
📍Model 1:
HTF bias based on the daily and weekly candles closes,
Wait for CLS candle to be created and manipulated. Switch to correct LTF and spot CIOD. Enter and target 50% of the CLS candle.
For high probability include Dealing Ranges, Weekly Profiles and CLS Timing.
Trading is like a sport. If you consistently practice you can learn it.
“Adapt what is useful. Reject whats useless and add whats is specifically yours.”
David Perk aka Dave FX Hunter
💬 Don't hesitate to ask any questions or share your opinions

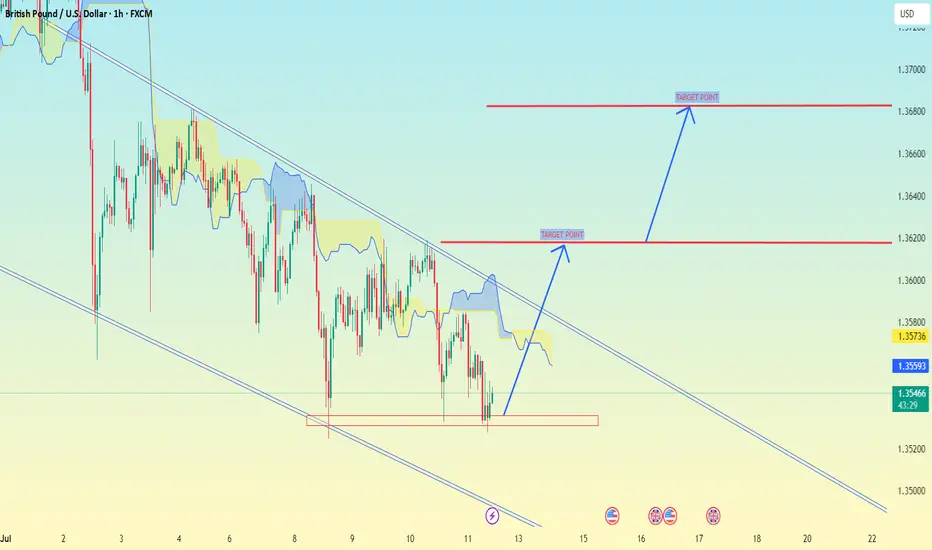
GBP/USD chart (1H timeframe)GBP/USD chart (1H timeframe), potential breakout from a descending channel, supported by the Ichimoku Cloud and marked target levels.
📈 Current Analysis Highlights:
Price is near the lower end of the descending channel.
A bullish reversal setup is forming.
I'm drawn two Target Points indicating a breakout and continuation.
---
🎯 Target Levels (as per your chart):
1. First Target Point:
🔹 1.36200 — This is the initial resistance level or TP1 if price breaks above the Ichimoku cloud and mid-channel resistance.
2. Final Target Point:
🔹 1.36800 — This is the upper resistance zone and aligns with the top of the descending channel, a likely TP2 area if bullish momentum continues.
---
✅ Summary:
Entry idea: After confirmation of a breakout above the cloud (~1.35600).
TP1: 1.36200
TP2: 1.36800
11.07.25 USDJPY Trade Recap + Re-Entry for +2.5%A long position taken on USDJPY for a breakeven, followed by a premature re-entry that I took a loss on. I also explain the true re-entry I should have taken for a 2.5% win.
Full explanation as to why I executed on these positions and also more details around the third position that I did not take.
Any questions you have just drop them below 👇

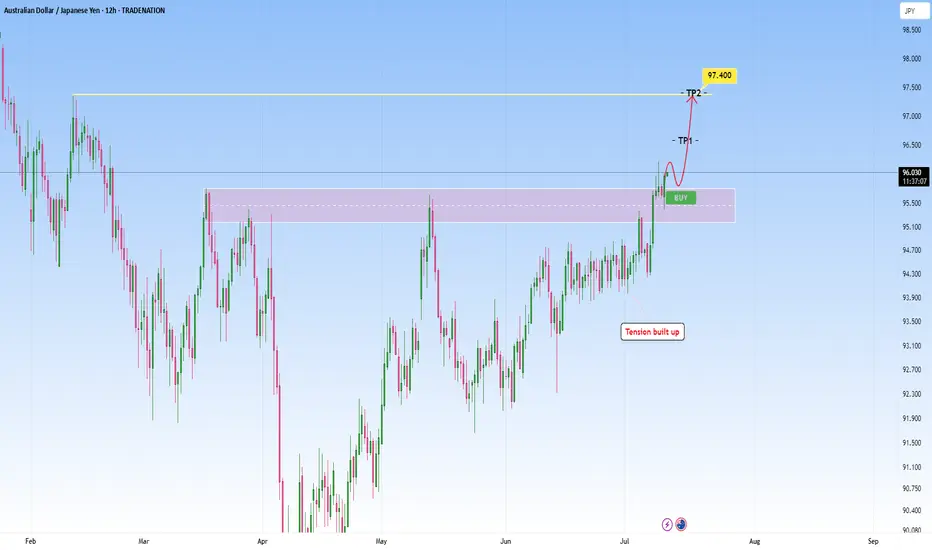
AUDJPY Technical Breakout - Targeting 97.400 Next?TRADENATION:AUDJPY has recently broken decisively above a key resistance zone that had previously capped price for several months. This breakout was preceded by a period of compression and range-bound price action, where bullish momentum steadily built up, indicated by higher lows pressing against the resistance level. This type of structure typically leads to an explosive breakout, which we are now seeing unfold.
After the breakout, price came back for a clean retest of the broken resistance zone, which has now flipped into support. The retest held firmly, suggesting strong buyer interest at this level and confirming the validity of the breakout.
With this structure in place, the bullish momentum is likely to extend further toward the next target zone around 97.400, provided price remains above the current support.
As long as the price holds above the retested zone, the bullish outlook remains intact. A breakdown back below this area, however, would be a warning sign and could open the door to a deeper pullback.
Remember, always wait for confirmation before entering trades, and maintain disciplined risk management.
EURO - Price will continue to grow inside rising channelHi guys, this is my overview for EURUSD, feel free to check it and write your feedback in comments👊
Recently, price entered to rising channel, where it soon reached the support level, which coincided with the support area.
After this movement, the price broke this level, but soon turned around and corrected the support line of the channel.
Next, EUR went back to $1.1365 level and broke it again, after which it made a retest and continued to move up.
In a short time, EUR rose to the resistance line of the channel, made a correction, and then grew to $1.1700 support level.
Price broke this level too and reached the resistance line of the channel, but not long ago corrected.
At the moment, I expect that the Euro can correct to the support line of the channel and then rise to $1.1900
If this post is useful to you, you can support me with like/boost and advice in comments❤️
Disclaimer: As part of ThinkMarkets’ Influencer Program, I am sponsored to share and publish their charts in my analysis.

Not All Pin Bars Are Created EqualA Two-Step Filter to Find the Ones That Actually Matter
We’ve all seen them. Long wicks, tight bodies, price rejecting a level. The classic pin bar. Textbook stuff, right?
But here’s the problem. Pin bars show up all over the chart. Some lead to clean reversals. Most do absolutely nothing. The trick isn’t spotting them. It’s knowing which ones to trust.
This is where a simple two-step filter can help. By asking two key questions, you immediately improve the quality of your trades and cut down on the false positives.
Step One: Where Did It Happen?
Before you look at shape or size, ask yourself one thing.
Did this pin bar form at a meaningful level?
Context is everything. A pin bar that forms into thin air, mid-range or in the middle of chop might look good, but it’s rarely reliable. What you’re looking for is reaction from structure. That could mean:
• A clean horizontal support or resistance level
• A prior swing high or low
• A daily VWAP or anchored VWAP from a key event
• The edge of a range or value area
• A trendline tested multiple times
In short, the level gives the pin bar a reason to exist. It becomes a reaction, not a random candle.
Mark the level before the candle forms. This stops you from retrofitting significance where there isn’t any.
Example:
Here we can see how the volume weighted average price (VWAP) can add meaningful context to a pin-bar setup. In this case, USD/CAD retraced against the prevailing downtrend and tested the VWAP anchored to the recent swing highs. At that point, price formed a clear pin-bar reversal, signalling rejection and potential continuation with the broader trend.
USD/CAD Daily Candle Chart
Past performance is not a reliable indicator of future results
Step Two: What’s Happening Under the Hood?
Once you’ve got a pin bar at a meaningful level, it’s time to look deeper. One of the best ways to do that is by dropping down to a lower timeframe, like the 5-minute chart, and replaying the session that created the candle.
Why?
Because daily candles can hide a lot. A clean pin bar might look like a strong rejection, but on the intraday chart, it might just be a low-volume fakeout or one impulsive move during quiet hours. On the other hand, a pin bar backed by real market structure is far more likely to hold.
Here’s what to look for on the lower timeframe:
• Was there a liquidity grab or stop run into the level?
• Did price pause, base or reverse with intent?
• Were there multiple attempts to push beyond the level that failed?
• Did volume spike during the rejection?
When a pin bar reflects a genuine intraday battle, not just a random wick, it often tells you more about the intentions of real participants.
Example:
In this example, GBP/USD forms a bearish pin-bar at a key area of swing resistance on the daily chart. Dropping down to the 5-minute timeframe helps reveal what actually happened inside that candle.
On this lower timeframe we can see that price initially pushed above resistance but failed to hold, triggering a steady wave of intraday selling pressure. This move was followed by a mild pullback during the latter half of the US session and into the New York close, reinforcing the idea of rejection and offering insight into the mechanics behind the pin-bar.
GBP/USD Daily Candle Chart
Past performance is not a reliable indicator of future results
GBP/USD 5min Candle Chart: How the Daily Pin-bar Formed
Past performance is not a reliable indicator of future results
Bonus Filter: What’s the Trend Context?
You could also add a third layer if you want to refine even further. Is the pin bar counter-trend, or is it a pullback within trend?
Counter-trend pin bars at key levels can work, but they’re lower probability and often take more time to play out. Pin bars that form as part of a pullback to structure in the direction of the prevailing trend tend to move more cleanly.
This is where using something like a 20 EMA or anchored VWAP can help frame the setup.
Putting It All Together
Next time you see a pin bar, pause. Don’t rush in. Ask yourself:
• Did this happen at a level that matters?
• Does the intraday story back up the candle?
If the answer is yes to both, now you’ve got something worth trading. Not just another wick in the wind.
Pin bars can be strong signals, but only when they reflect real intent. This two-step filter helps you cut through the clutter and focus on the ones that do.
Disclaimer: This is for information and learning purposes only. The information provided does not constitute investment advice nor take into account the individual financial circumstances or objectives of any investor. Any information that may be provided relating to past performance is not a reliable indicator of future results or performance. Social media channels are not relevant for UK residents.
Spread bets and CFDs are complex instruments and come with a high risk of losing money rapidly due to leverage. 85.24% of retail investor accounts lose money when trading spread bets and CFDs with this provider. You should consider whether you understand how spread bets and CFDs work and whether you can afford to take the high risk of losing your money.

HelenP. I Euro will drop more, breaking the support levelHi folks today I'm prepared for you Euro analytics. After analyzing the current structure of the EURUSD chart, I noticed a strong break of the ascending trend line, which had been respected for a long period. The price has now returned to test the broken trend line from below, aligning with the resistance zone between 1.1665 and 1.1700 points. This area used to serve as solid support, but after the breakout, it turned into resistance. The retest from below could become the final confirmation before the pair continues its downward movement. Right now, EUR is trading just inside this resistance zone. There is a small chance the price might move slightly higher to touch the upper boundary of the zone, but overall, the pressure looks bearish. I expect that after a minor bounce, EUR will decline again, breaking below the local support at 1.1665. Once that happens, a larger impulse down could be triggered, targeting even 1.1525 points, which is my main goal for this setup. This bearish scenario is supported by the failed attempts to recover above the trend line and the fact that previous support has already flipped to resistance. If you like my analytics you may support me with your like/comment.❤️
Disclaimer: As part of ThinkMarkets’ Influencer Program, I am sponsored to share and publish their charts in my analysis.

USDJPY : More Upside Ahead?USDJPY : More Upside Ahead?
USDJPY remains firmly in a bullish trend, largely driven by renewed tariff concerns.
The yen weakened sharply after U.S. President Donald Trump reaffirmed plans to impose 25% tariffs on Japanese goods starting August 1st.
Since that announcement, USDJPY has rallied nearly 200 pips before encountering some profit-taking.
Despite the brief pause, the broader trend remains intact, and the pair appears poised for further gains.
Key upside targets to watch:
146.95
147.80
148.40
You may find more details in the chart!
Thank you and Good Luck!
PS: Please support with a like or comment if you find this analysis useful for your trading day
Disclosure: I am part of Trade Nation's Influencer program and receive a monthly fee for using their TradingView charts in my analysis.

GBP/USD - H1- Bearish Flag (07.07.2025)The GBP/USD Pair on the M30 timeframe presents a Potential Selling Opportunity due to a recent Formation of a Bearish Flag Pattern. This suggests a shift in momentum towards the downside in the coming hours.
Possible Short Trade:
Entry: Consider Entering A Short Position around Trendline Of The Pattern.
Target Levels:
1st Support – 1.3520
2nd Support – 1.3460
🎁 Please hit the like button and
🎁 Leave a comment to support for My Post !
Your likes and comments are incredibly motivating and will encourage me to share more analysis with you.
Best Regards, KABHI_TA_TRADING
Thank you.
Disclosure: I am part of Trade Nation's Influencer program and receive a monthly fee for using their TradingView charts in my analysis.

AUDUSD Potential UpsidesHey Traders, in today's trading session we are monitoring AUDUSD for a buying opportunity around 0.65300 zone, AUDUSD is trading in an uptrend and currently is in a correction phase in which it is approaching the trend at 0.65300 support and resistance area.
Trade safe, Joe.

NZD/USD H&S Reversal Pattern Clear,Short Setup To Get 150 Pips !Here is my opinion On NZD/USD On 4H T.F , If we checked the chart we will see that we have a very strong Historical res that forced the price many times to respect it and stay below it and now we have another good confirmation , we have a perfect reversal pattern and we have a clear closure below our neckline so the pattern already confirmed , i`m waiting the price to go up a little to retest my broken neckline and then we can enter a sell trade . only 1 case i will avoid this idea , if we have a daily closure agin above my res with clear closure .

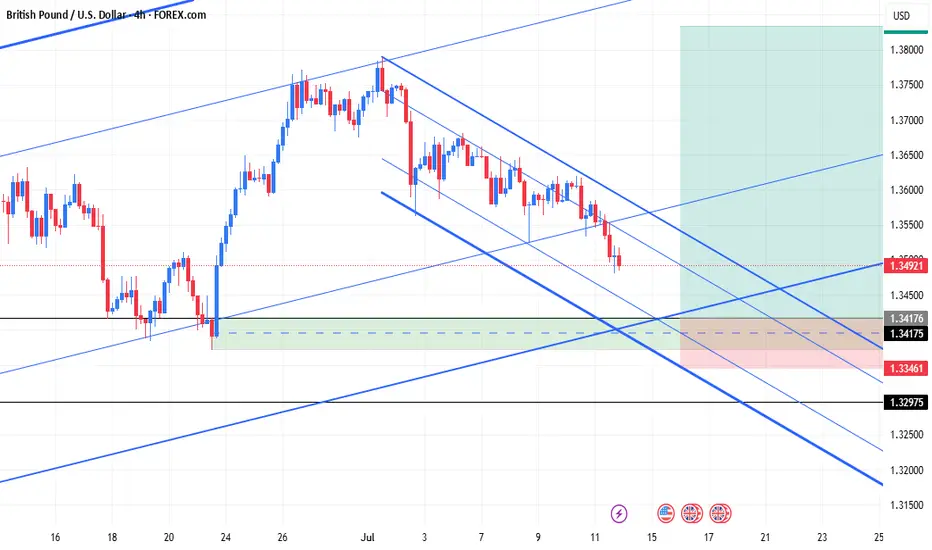
GBPUSD: Two Strong Bullish Area To Buy From ?GU is currently in a bullish trend when examined on a daily time frame. There are two potential areas for purchase. The first area is currently active, as we anticipate a price reversal from this point. There is a significant possibility that price could decline to the second area and subsequently reverse from there directly. The sole reason we believe price could drop to the second area is if the US Dollar experiences corrections, which could cause GU to drop to our second area and subsequently rebound.
If you appreciate our analysis, we kindly request that you consider the following actions:
-Liking the Ideas
-Commenting on the Ideas
-Sharing the Ideas
We extend our sincere gratitude for your continuous support. We trust that our insights have provided even a modicum of assistance.
Team Setupsfx_
❤️🚀

EURUSD LONG The dollar is looking to fall hard as the euro continues to gain we still see the market long on the euro in terms of institutions etc. we had a weak push to the downside and have now met trend line resistance will be interesting to see what happens from here . The trade isn’t perfect yet but this is what I’m looking at so far .

Gbpusd Long SetupGbpusd (M,W,D Strong Bullish)
Daily Bullish trend channel
1:4hr Demand Zone +Fvg
2:1hr Demand Zone +Fvg
According to Seasonality :gbpusd Bullish (July)
NZDCAD Bullish 15 min ICT 15 minute Entry:
1. Sell - side liquidity swept.
2. BOS up onM15 confirm shift.
3. Entry from bullish OB or FVG after pullback.
4. SL below liquidity sweep.
5. TP internal high/TP2 premium zone.

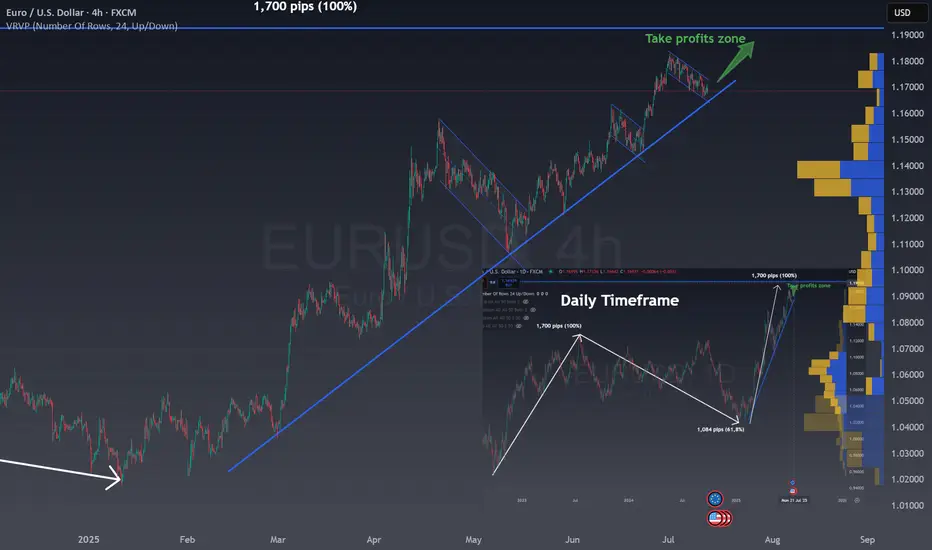
One last rally in EUR/USDIn the right bottom you can see the Daily chart for EUR/USD:
The chart shows the EUR/USD on a daily timeframe.
There was an initial strong rise of 1,700 pips, marked as a 100% move.
After this, the price corrected downward by 1,084 pips, which is 61.8% of the previous rise.
The 61.8% retracement is a common Fibonacci level, often signaling a reversal or pause.
Now, the price is moving up again, following a similar path as the first rise.
The chart suggests a possible new upward move of another 1,700 pips (100%).
A "take profits zone" is marked at the top, indicating a target area for traders.
This pattern reflects how markets often move in waves: trend, correction, and trend continuation.
Fibonacci levels help traders identify potential reversal points.
The chart is used to project future moves based on past price behavior.
The MAIN CHART shows a clear uptrend for EURUSD and the current correction with a flag.
The combination of both patterns give us a clear BUY zone in the channel and using the trend as support or once the channel break upwards.
This is a very good risk reward ratio trade situation where all traders should be!
EURNZD Will Go Lower From Resistance! Sell!
Take a look at our analysis for EURNZD.
Time Frame: 15m
Current Trend: Bearish
Sentiment: Overbought (based on 7-period RSI)
Forecast: Bearish
The market is on a crucial zone of supply 1.945.
The above-mentioned technicals clearly indicate the dominance of sellers on the market. I recommend shorting the instrument, aiming at 1.943 level.
P.S
Overbought describes a period of time where there has been a significant and consistent upward move in price over a period of time without much pullback.
Disclosure: I am part of Trade Nation's Influencer program and receive a monthly fee for using their TradingView charts in my analysis.
Like and subscribe and comment my ideas if you enjoy them!

NZDUSD beating for a robust up move soon The coming weekdmight be a more volatile week for NZD, Stay put, I feel take out for long positions when you see the Opportunities.
