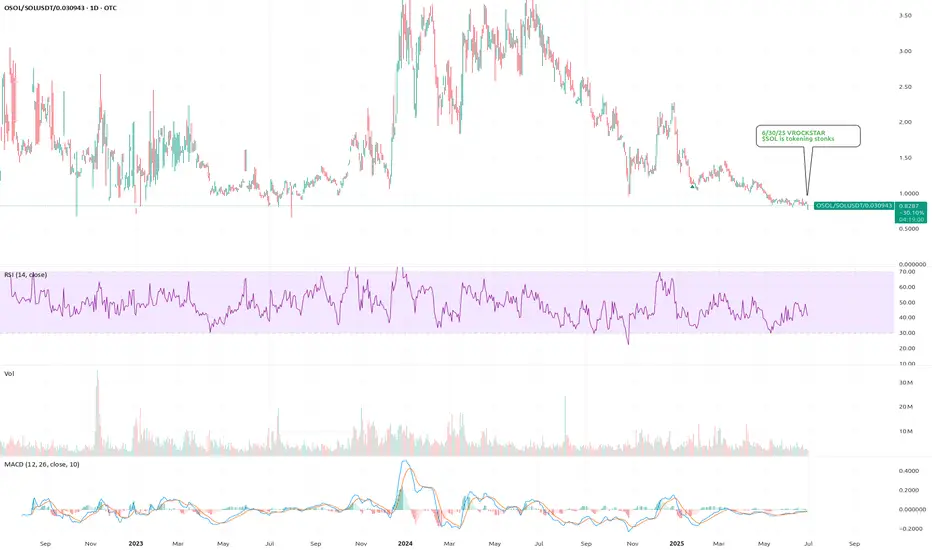
6/30/25 - $osol - $SOL is tokening stonks6/30/25 :: VROCKSTAR :: OTC:OSOL
CRYPTOCAP:SOL is tokening stonks
- so OTC:OSOL is osprey's SOL closed end fund
- similar to OTC:OBTC that i talk about, the chart you see below is vs. the NAV e.g. this is currently at 17% discount to spot
- and we know SOL will have an ETF this month
- we see stocks being now tokenized on chain and SOL is the chain that will see the most volume
- so if you like stable coins... you should like tokenized stocks even better
- closed end funds trade funny
V
ETF market
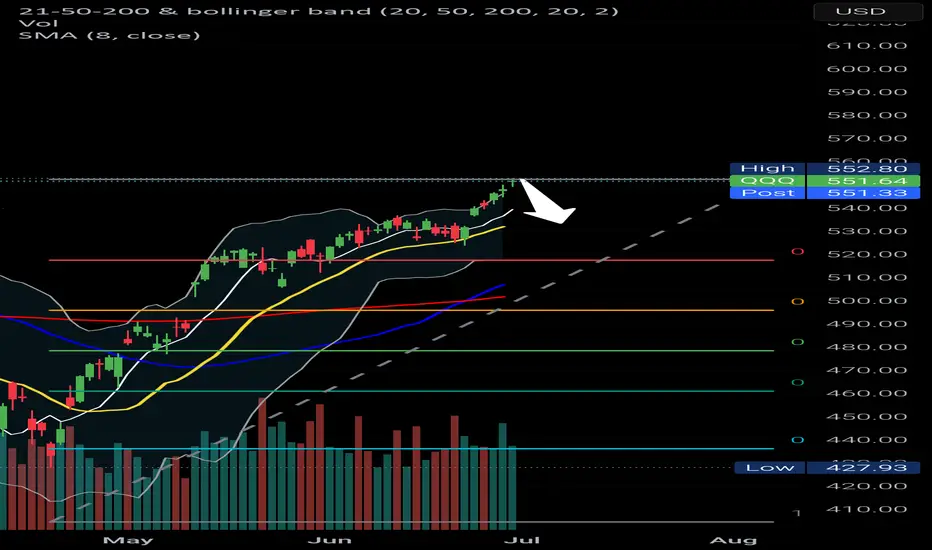
SPY/QQQ Plan Your Trade For 6-30-25 : Gap Potential PatternToday's pattern suggests the SPY will attempt to create a GAP at the open. It looks like the markets may attempt to move higher as the SPY is already nearly 0.35% higher as I type.
Last week was very exciting as we watched the QQQ and the SPY break into new All-Time Highs.
I suspect the markets will continue a bit of a rally into the early Q2 earnings season where retail traders attempt to prepare for the strong technology/innovation/AI earnings data (like last quarter).
I do believe this rally is due for a pullback. I've highlighted this many times in the past. Typically, price does not go straight up or straight down. There are usually multiple pullbacks in a trend.
So, at this point, the markets are BULLISH, but I still want to warn you to stay somewhat cautious of a pullback in the near future (maybe something news-related).
Gold and Silver should start to move higher over the next 5-10+ days, with gold trying to rally back above $3450. I see Gold in a solid FLAGGING formation that is moving closer to the APEX pattern.
Bitcoin is nearing a make-or-break volatility point. I see BTCUSD breaking downward, but it could break into a very volatile phase where it attempts to rally (with the QQQ through earnings), then collapse later in July. We'll see how things play out.
Remember, tomorrow morning I have a doctor's appointment. So I may or may not get a morning video done. FYI.
Get some today.

Statistical Tendencies in Market StructureMarket Disorder
Involvement in financial markets occurs for a variety of reasons, including speculation, hedging, liquidation, automation, and rebalancing. These are executed by a broad range of participants, such as funds, banks, algorithms, and retail traders. These operate across different timeframes and objectives. The same information could lead to different interpretations and execution.
This creates structural disorder. The market does not behave in a clean or deterministic manner. Behaviour is shaped by overlapping flows, unknown motivations, and shifting expectations. While each trade is executed with intent and structure, the collective result of these actions creates disorder. From the perspective of a technical trader, outcomes could appear no different from randomness. In practice, this is experienced as noise or inconsistent behavior.
Randomness in Market Theory
Traditional financial models like the Random Walk Hypothesis (RWH) suggest that price movements are random and not influenced by past behavior. In other words, markets exhibit no memory and each price change is statistically unrelated to the prior ones. In case this would be true, no historical data or technical method would provide a reliable basis for forecasting future prices. In such a market, price behavior would be indistinguishable from statistical noise. Apparent trends would arise by coincidence, and no persistent trading edge could be developed.
A visual example of a chart based on a random walk. Price evolves through multiplicative steps without memory, reflecting the assumptions of the Random Walk Hypothesis.
Multiple experiments have shown that when traders are presented with randomly generated charts, they tend to perceive them as genuine market data. This reflects a common cognitive bias: the tendency to perceive structure even where none exists. Much of what is interpreted as meaningful could be the result of psychological projection, pattern recognition, or hindsight bias applied to what is essentially noise. Randomness can resemble market data, which makes it difficult to differentiate between valid and coincidental patterns.
Market Tendencies: Departures from Randomness
Not all aspects of market behavior conform to the random walk model. In particular, certain patterns appear to be consistent and do not fit the definition of pure randomness. These patterns are not statistical anomalies in the dismissive sense, but measurable and repeatable features of price action. It is from these deviations that systematic trading methods can be developed.
Volatility Clustering
Volatility clustering refers to the tendency for large price changes to be followed by more large changes, and for small changes to be followed by more small changes. This effect does not imply direction, but indicates that the magnitude of price changes tends to show persistence. This helps explain why markets transition between calm periods and phases of high turbulence, rather than constant variance. The behavior violates the random walk assumption that each price change is independent from the last.
A visual example of volatility clustering, with columns marking periods where rolling volatility exceeds a dynamic threshold.
This pattern is central to many econometric and trading models. It forms the basis for regime-based strategies and conditional volatility systems such as ARCH (Engle, 1982) and GARCH (Bollerslev, 1986). Mandelbrot (1963) first described the phenomenon in the context of financial turbulence.
Momentum
Momentum refers to the observed tendency of markets to continue moving in the same direction over short- to intermediate-term timeframes. In statistics, this is shown as positive serial correlation in returns. In simple terms, recent winners tend to keep winning, and losers tend to keep losing.
A visual example of momentum, showing the slope of a linear regression line over a rolling window. Positive values indicate upward movement, negative values indicate downward movement.
Momentum contradicts the idea that price changes are independent and identically distributed. The effect has been extensively documented across markets and asset classes. Foundational research includes Jegadeesh and Titman (1993), Carhart (1997), and the cross-asset studies by Asness, Moskowitz, and Pedersen (2013). It is a key principle behind trend-following strategies.
Mean Reversion
Mean reversion describes the tendency of prices to return to a long-term average after deviating significantly. This behavior implies negative feedback: the further price moves from its mean, the greater the probability of a reversal.
A visual example of mean reversion, showing the deviation of price from its moving average. Baseline is centered at zero, with positives above the mean and negatives below.
This effect challenges the assumption that markets move without anchor. It is most evident in valuation-driven models, short-term overreaction trades, and statistical arbitrage. Empirical support includes long-term reversals (DeBondt and Thaler, 1985), medium-term autocorrelation (Poterba and Summers, 1988), and short-term corrections (Jegadeesh, 1990; Lehmann, 1990).
Conceptual Differentiation
These deviations from randomness have different statistical profiles. Volatility clustering reflects persistence in the magnitude of price changes. Momentum is defined by positive autocorrelation in returns, meaning recent trends tend to continue. Mean reversion is characterized by negative autocorrelation, where extreme moves are more likely to reverse. Together, these effects define some of the limited but viable edges that exist within an otherwise random market.
Strategic Implications for Trading
Comprehending these deviations from randomness helps clarify two broad categories of trading strategies, each shaped to exploit different forms of market behavior.
Momentum forms the foundation of trend-following strategies. These approaches are built on the premise that price movements often persist over time. Traders applying this logic aim to buy strength and sell weakness, anticipating that trends will continue. The core idea is that price is more likely to extend its current direction than to reverse. Common techniques include:
Breakout-Based Entries
Trend Pullback Trades
Continuation Patterns
Mean reversion, by contrast, serves as the basis for contrarian strategies. These methods are shaped around the observation that extreme price movements tend to reverse. Traders using this approach aim to sell strength and buy weakness when price diverges sharply from a perceived equilibrium. The underlying principle is that price tends to return toward its average following an overextension. Techniques include:
Fading Overextension
Range-Based Trades
Statistical Divergence Setups
Momentum and mean reversion coexist in markets, but their relative influence has variance. In some periods, one could dominate; in others, both have comparable effects. This balance shapes market structure. Recognizing this concept helps contextualize price action and adapt to the current environment.
Interpretation and Standardization
Many individuals enter the market with the misconception that technical analysis is a tool for predicting future price movements. However, its true value lies in interpretation. Technical charts provide information about structure and sentiment, which helps us take a reasonable bet. In a sense, there is a prediction based on the past, but with uncertainty. This interpretative approach, combined with a well-tested method, creates a solid foundation.
Markets are not a math problem with a fixed solution. If they were predictable, all variables could be quantified and outcomes automated with precision. In reality, even systematic approaches require discretion and adaptation. Markets are complex environments shaped by uncertainty and disorder. Even the most robust methods encounter both wins and losses.
It is also important to understand the role of perception. As humans, we are wired to find patterns, even in random data. We may focus on evidence that supports our expectations, see structure where none exists, or assume past events were obvious in hindsight. These tendencies often lead to overconfidence and unreliable interpretation. A related issue is overfitting, where methods that appear effective on historical data fail to translate. These may seem precise in hindsight but often lack the ability to generalize, usually due to selective parameter tuning or retrospective reasoning.
The solution is not added complexity, but standardization. To separate random movement from meaningful structure, chart interpretation must rely on consistent and objective criteria. A pattern is not meaningful in isolation but gains relevance when it departs from statistical norms. This must be combined with a probabilistic mindset, where each trade is treated as uncertain and evaluated as part of a broader process.
The content in this post is extracted from the book The Art of Technical Trading by StockLeave for educational purposes.

QQQ A Fall Expected! SELL!
My dear subscribers,
This is my opinion on the QQQ next move:
The instrument tests an important psychological level 548.21
Bias - Bearish
Technical Indicators: Supper Trend gives a precise Bearish signal, while Pivot Point HL predicts price changes and potential reversals in the market.
Target - 535.27
About Used Indicators:
On the subsequent day, trading above the pivot point is thought to indicate ongoing bullish sentiment, while trading below the pivot point indicates bearish sentiment.
Disclosure: I am part of Trade Nation's Influencer program and receive a monthly fee for using their TradingView charts in my analysis.
———————————
WISH YOU ALL LUCK

$SPY Review of 6.30.25Yesterday’s price action was flat near previous ATH’s for the first part of the day and then the second part of the day we had some nice volatility that tapped the top of the implied move at 619 and then pulled back.

QQQ Nasdaq 100 Year-End Price Target and Technical Rebound SetupIf you haven`t bought the previous oversold area on QQQ:
Now the Nasdaq-100 ETF (QQQ), which tracks the performance of the largest non-financial companies in the Nasdaq, has recently entered oversold territory, suggesting that a technical rebound may be imminent. Similar to the Russell 2000, QQQ has experienced significant selling pressure, driving key technical indicators into oversold zones and creating favorable conditions for a bounce.
The Relative Strength Index (RSI) has dropped below 30, a level that typically signals oversold conditions and the potential for a reversal. Additionally, QQQ is trading near key support levels, with a large portion of its components underperforming their 50-day and 200-day moving averages — a classic setup for a mean reversion rally.
From a historical perspective, QQQ has shown a tendency to rebound strongly after similar oversold conditions, particularly when macroeconomic factors stabilize and buying pressure returns. Given the current technical setup, my price target for QQQ is $550 by the end of the year. This represents a recovery of approximately 8-10% from current levels, aligning with previous post-oversold rallies in the index.
While downside risks remain — including potential volatility around Federal Reserve policy and broader economic data — the technical backdrop suggests that QQQ is well-positioned for a recovery in the coming months.

Nightly $SPY / $SPX Scenarios for July 1, 2025 🔮 Nightly AMEX:SPY / SP:SPX Scenarios for July 1, 2025 🔮
🌍 Market-Moving News 🌍
📊 Core Inflation Edges Higher
May’s core inflation rose unexpectedly to 2.7% year-over-year, up from 2.6%, casting uncertainty over the Fed’s timeline for rate cuts. While headline CPI sits at 2.3%, the resilience in underlying prices complicates policymakers’ projections for later this year
💵 Weak Dollar, Rising Rate-Cut Bets
Markets are reacting to “summertime data”—like the core CPI uptick—with renewed optimism. Traders now see up to 75 bps in Fed rate cuts later this year, while the dollar remains near 3½-year lows on concerns about Powell’s independence and trade developments
🇨🇦 U.S.–Canada Trade Talks Resume
Trade talks between the U.S. and Canada restarted today, following Ottawa’s suspension of its digital-services tax. Progress toward a broader agreement could reduce tariff risk and offer further relief to risk assets
📊 Key Data Releases & Events 📊
📅 Tuesday, July 1:
All Day – U.S.–Canada Trade Talks
Markets will watch for updates on tariff resolution and broader trade deals. Any breakthrough could notably boost equities and improve trade sentiment.
10:00 AM ET – ISM Manufacturing PMI (June)
A below-50 reading again would reinforce the narrative of industrial weakness. A rebound could support equities and temper recession concerns
10:00 AM ET – JOLTS Job Openings (May)
Still at elevated levels (~7.39 million in April), this metric assesses labor-market resilience. A decline could shift rate-cut expectations.
⚠️ Disclaimer:
This is for educational and informational purposes only. It does not constitute financial advice. Consult a licensed financial advisor before investing.
📌 #trading #stockmarket #economy #news #trendtao #charting #technicalanalysis

Qqq short Qqq short 532
Bounce LH and another dump
No need to complicate things too much .
Good luck
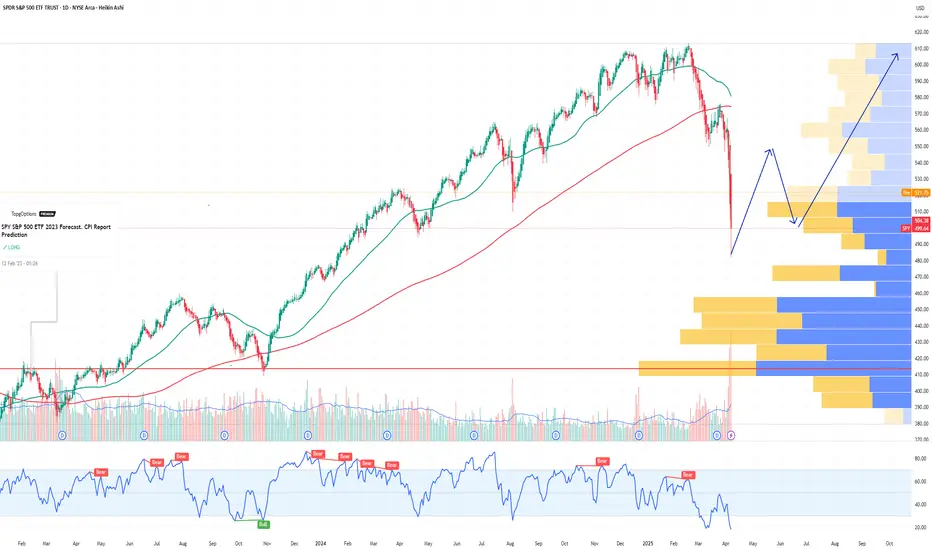
SPY S&P 500 ETF Potential W-Shaped Recovery Forming We may be witnessing the formation of a W-shaped recovery on the SPY (S&P 500 ETF) – a classic double-bottom structure that often signals a strong reversal after a period of correction or volatility. Let’s dive into the technicals and what this could mean in the sessions ahead.
🔍 The Technical Setup:
SPY recently tested key support around the $485-$500 zone, bouncing off that area twice in the past few weeks. This gives us the left leg of the W and the first bottom. After a modest relief rally to ~$520, we saw another pullback – but this second dip failed to break below the first bottom, a hallmark of the W-pattern.
As of today, SPY is starting to reclaim ground toward the $517-$520 resistance zone. If bulls can push through this neckline area, especially with volume confirmation, we could see a breakout that targets the $530-$535 area in the short term.
🔑 Key Levels to Watch:
Support: $490-$500 (double-bottom support zone)
Neckline/Resistance: $530
Breakout Target: $550 (previous highs)
Invalidation: A break below $490 with volume could invalidate the W-recovery idea and shift bias bearish.
📊 Momentum & Volume:
RSI is climbing back above the 50 level – bullish momentum building.
MACD shows a potential crossover forming, hinting at a shift in trend.
Watch for increasing buy volume as SPY approaches the neckline – that’s where the bulls will need to step up.
🧠 Macro & Earnings Angle:
Don’t forget – we’re entering a heavy earnings season and rate cut expectations are still a wildcard. A dovish tone from the Fed and strong corporate results could be the fuel that sends SPY higher to complete this W-shaped recovery.
🧭 Final Thoughts:
This is a high-probability setup if neckline resistance is broken cleanly. Wait for confirmation before going heavy – fakeouts are common in double-bottom scenarios. If we do get the breakout, we may be looking at a broader market rebound going into summer.
🔔 Set alerts near $525. A confirmed breakout could mean the bulls are back in charge.
How I screen for long term investmentsIn this video, I’ll show you the exact stock screener I use to find long-term investment opportunities — the kind of stocks you can buy and hold for years.
I’ll walk you through the key metrics to look for, how to use free tools like TradingView screener, and what red flags to avoid. This strategy is perfect for beginner and experienced investors who want to build long-term wealth, not chase hype.
Whether you're looking for undervalued stocks, consistent compounders, or just trying to build your long-term portfolio, this screener can help.
Hope you enjoy!!

QQQ 30/04/2025 ShortFailure to break back inside the ascending channel
IMO going down to form a double bottom 410$

Market BreadthMarkets are still in 'Bull' mode going into the 4th. Keeping a eye on the 9-EMA which I use as a trailing stop on my long positions. Not likely to pick up any new positions for now.

Weekly $SPY / $SPX Scenarios for June 30 – July 3, 2025🔮 Weekly AMEX:SPY / SP:SPX Scenarios for June 30 – July 3, 2025 🔮
🌍 Market-Moving News 🌍
📈 US Stocks Rally to Record Highs
Following a volatile first half, U.S. equities surged into record territory in late June on a combination of easing Middle East tensions, cooling inflation data, and the 90-day tariff pause
💵 Dollar Weakens on Fed and Trade Uncertainty
The U.S. dollar fell to a 3½-year low, pressured by persistent speculations over President Trump replacing Fed Chair Powell and extending rate-cut expectations, as well as progress in U.S.-Canada trade talks
🇨🇦 U.S.–Canada Trade Talks Lift Sentiment
Canada temporarily repealed its digital services tax to facilitate talks seeking a broader trade agreement by July 21, boosting U.S. equity futures
🛢️ Oil Prices Stabilize
After spiking on geopolitical fears, oil traders settled between $65–78/bbl amid supply relief following ceasefire developments and easing Middle East risks
⚠️ July Risks Loom
The coming week will spotlight:
July 4 deadline for Trump’s tax bill
Expiry of the tariff pause on July 9
U.S. Nonfarm Payrolls on July 3
Each poses potential for increased volatility if outcomes disappoint
📊 Key Data Releases & Events 📊
📅 Monday, June 30
9:45 AM ET – Chicago PMI (June): Gauge of Midwestern factory activity
📅 Tuesday, July 1
U.S. markets open, watch trade developments
📅 Wednesday, July 2
Global PMI readings released
📅 Thursday, July 3 (Early close ahead of Independence Day)
8:30 AM ET – Nonfarm Payrolls (June)
8:30 AM ET – Unemployment Rate (June)
8:30 AM ET – Average Hourly Earnings (June)
These labor metrics will be critical for Fed rate outlooking
⚠️ Disclaimer:
This information is for educational and informational purposes only and should not be construed as financial advice. Always consult a licensed financial advisor before making investment decisions.
📌 #trading #stockmarket #economy #jobs #Fed #oil #trade #technicalanalysis

Preponderance of (or Preposterous?) Evidence
I was just proposing yesterday staying neutral in SPY (the S&P 500 ETF). The FOMC meeting today (Jun 18th) was a big-nothing burger (so far), which supports my (non)position, but we'll see. I will update that post when the time is right (ATH, 200dma, or bust).
Today, though, the IWM (the Russell 2000 Small Cap Index ETF) and, surprisingly, a potential short position.
First, the IWM (see below) is overbought on a weekly chart, with the Stochastics being above 80 (more on Stochastics and weekly charts at a later date). For now, let's go with IWM being a little overbought, in the longer-term view.
Now, let's switch to the big daily chart at the top and look at the evidence for going short;
- IWM never really got above it's 200-day moving average (purple line),
- That same level was consistent with a lot of resistance ~213 (yellow circles),
- IWM has trailed this whole rally.
- It has broken and somewhat retested a trendline (light blue) from this most recent rally,
- It bounced off it's 61.8% Fibonacci level (orange line, not my favorite indicator for ETFs, but I often sneak a peek),
- It's at its previous resistance high around 209 (blue circles).
On the not-bearish side;
- The daily chart is less overbought (this has to happen on weakness, though),
- There's (a little) support at 199 but not really again until 172,
- I still feel like the All-Time-High (ATH) is a magnet for the S&P (but IWM has trailed).
That's (a lot) more (and better) points for being bearish.
I'll go short (via a ~90 day ITM put position*) if IWM breaks below 207.50, between that and 202. If it opens lower than 202, I'll wait for a pull-up.
The stop will be a close above the 200 day.
The target is 172 (the previous tariff low), but I will lighten/tighten up (by selling OTM puts* and/or moving stop down) as IWM drops (if it drops).
It may seem a bit duplicitous to be neutral on SPY while being bearish on IWM.
But sometimes you have to go with the Preponderance of Evidence (or will it prove Preposterous Evidence?)
An update will be coming.
*Sorry for bringing up options. One can just go short IWM. I will explain my option choice one day.
My ideas here on TradingView are for educational purposes only. It is NOT trading advice. I often lose money and you would be a fool to follow me blindly.

SPY Rejected at Gamma Wall–Watch $610 Breakdown or $615 Reclaim🧠 GEX-Based Options Sentiment:
SPY closed Friday with a rejection off the Highest Positive Net GEX / Gamma Wall at $615, with sellers defending the upper structure near the 2nd Call Wall at $620.
Support now lies in the $608–$604 range, with $605.54 and $604.45 aligning with GEX magnets and prior structure. Below that, there’s a gap to the HVL zone near $599, and the gamma floor starts deep around $591, which is also defended by the 2nd and 3rd PUT Walls.
Implied Volatility Rank is 12.2, with IVX below average. This implies premium selling could be dominant unless we break key levels. Meanwhile, PUT flow dominates at 31.9%, showing a clear defensive posture by institutions.
🔧 Options Trade Setup (for Monday–Wednesday):
Bearish Setup:
If SPY confirms under $610, especially during the first hour Monday, it could trigger a fade toward $605 or even $599 HVL.
Consider a PUT debit spread like 610p/600p (Jul 3).
Stop out if price reclaims $613.50–$615 cleanly.
Bullish Setup:
If SPY holds $610 and reclaims $615 with force, it can squeeze into the GEX void toward $620–$622.
Consider a CALL debit spread like 615c/620c (Jul 3).
Stop if price breaks back under $610 with volume.
📉 Intraday Technical Breakdown (1H Chart):
We now have back-to-back CHoCHs printed below rising wedge structure, followed by a failed retest at the top. This is a textbook sign of exhaustion. The final BOS and CHoCH from Friday confirmed that buyers lost short-term control.
The current structure is rolling over with lower highs, and SPY is now trading inside a descending micro-channel after rejection at $615.
Volume picked up on the Thursday/Friday rejection, which adds weight to the downside scenario unless we open strong Monday.
📌 Key Levels to Watch:
$617.00 – Upper Gamma ceiling
$615.00 – Gamma Wall & recent supply zone
$613.50 – Mid-level rejection pivot
$610.00 – Structure support now under threat
$608.48 – Intraday gamma magnet
$605.54 / $604.45 – Strong confluence support zone
$599.49 – HVL target zone
$591.90 – Gamma floor if broader selloff triggers
✅ Thoughts and Monday Game Plan:
SPY looks vulnerable under $610 — this is the most important level to watch. If that breaks and holds below in the first 30–60 minutes, we likely fade to $605 or lower.
The ideal trade setup would be to short the retest of $610 from below, or buy PUTs on confirmed weakness into the gamma air pocket. Alternatively, wait for a high-volume reclaim of $615 to trade with the bulls, but until then, the path of least resistance is down.
Macro catalysts are light, but pre-holiday positioning could bring volatility — stay nimble.
Disclaimer:
This analysis is for educational purposes only and not financial advice. Always use proper risk management and trade with a plan.

The Big Banks are in BIG TROUBLEAs you can see on this weekly chart, the XLF has been in this steady up trend since October 2023. It bounced off this upward slopping trendline 3 different times and then finally broke through it on the 4th hit, then came back up to test the underside of the trendline as resistance. It did get back above the trendline briefly last month, but it ended up being a bull trap as it fell back below the trendline and is now testing it as resistance once again and is currently being rejected. A Fibonacci retrace shows the 0.786 fib level also lines up with this area giving added confluence, as well as RSI divergence that I have highlighted. Massive Massive resistance in this area and so much room for potential downside. I see this trade as an extremely high probability of playing out. The options market agrees with me as well.

SPY Stuck at Gamma Ceiling! Will Bulls Break 619 or Get Rejected Again? 🎯
🔍 GEX Option Flow Outlook
SPY is grinding right under the heavy call wall at 619, which aligns with the highest NET GEX resistance zone. The flow is dominated by calls, and GEX is flashing 4 green dots, meaning dealer hedging could drive price higher if 619 breaks cleanly.
* GEX Resistance Wall:
* 🔹 $619–$620 = stacked resistance (Call Wall + GEX7 + GEX8 + GEX9)
* 🚫 Historically acts like a magnet & rejection zone
* GEX Support Wall:
* 🔸 $614 = HVL support (strong bounce zone for 0DTE plays)
* 🔻 $610–$608 = Put Wall danger zone
💡 Based on the current GEX map, if bulls can break above 619 with volume, the path to 623 opens. But failure to do so likely triggers a pullback to 614.
🧠 Smart Money Price Action (1H Chart)
SPY remains in a bullish rising channel, printing higher lows. However, price is stuck inside a CHoCH zone (consolidation under resistance) right under the 619 level.
* BOS from June 27 confirms structure shift
* CHoCH zone holding short-term price action
* 📦 Demand zone: 615–614 → where bulls stepped in before
* Volume dropping = market waiting for catalyst
🎯 Trade Setups:
📈 Bullish Breakout Plan:
* Trigger: Above 619.50 with momentum
* Target: 621 → 623
* Stop: Below 617.50
* Trade Idea: Buy 620C or 622C (0DTE/1DTE) for a quick breakout scalp
📉 Bearish Rejection Plan:
* Trigger: Rejection below 619 with spike in volume
* Target: 614 → 610
* Stop: Above 620
* Trade Idea: Buy 615P or 612P (1–2 DTE) on failed breakout
🧠 My Take:
SPY is at a critical pressure point. If dealers are forced to hedge more delta due to call buying, we could see a breakout. But the Gamma Wall at 619 is real — bulls must break it with force or risk another fade.
Disclaimer: This is not financial advice. For educational purposes only. Always manage your risk. 🎯

Nightly $SPY / $SPX Scenarios for July 2, 2025🔮 Nightly AMEX:SPY / SP:SPX Scenarios for July 2, 2025 🔮
🌍 Market-Moving News 🌍
🏭 U.S. Manufacturing Remains Under Pressure
The ISM Manufacturing PMI for June rose slightly to 49.0 from 48.5 in May—still in contraction territory. Tariff-induced uncertainty and rising input costs continue to weigh on factory activity, with new orders still weak and employment contracting
📈 Global Factory Rebound Led by India & Europe
While U.S. factories struggle, India hit a 14-month high in its manufacturing PMI at 58.4, and euro‑zone factory orders stabilized at 49.5—the first sign of recovery in over three years. Asia-Europe divergence may shift global capital flows .
🏦 Powell Says Tariffs Are Delaying Rate Cuts
Fed Chair Powell warned at the ECB forum in Sintra that elevated inflation—driven in part by Trump-era tariffs—has postponed the timeline for U.S. rate cuts. The Fed’s dot-plot now indicates only two cuts for 2025, with markets adjusting accordingly
💵 Dollar Nears 3½-Year Lows
The U.S. dollar weakened further, trading near a three-and-a-half-year low amid soft PMI data, a dovish Fed tilt, and renewed optimism over U.S.–Canada trade talks
📊 Key Data Releases & Events 📊
📅 Wednesday, July 2:
(No major scheduled U.S. economic data)
Market focus shifts to upcoming Nonfarm Payrolls on July 3, Powell's remarks, and trade-talk headlines.
⚠️ Disclaimer:
This information is for educational and informational purposes only and should not be construed as financial advice. Always consult a licensed financial advisor before making investment decisions.
📌 #trading #stockmarket #economy #manufacturing #Fed #inflation #charting #technicalanalysis

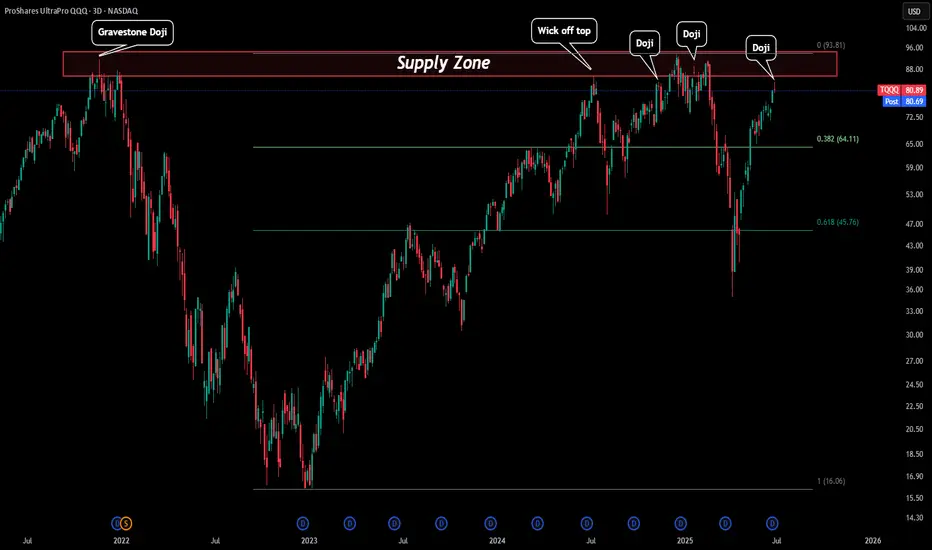
TQQQ - Red Days Ahead?TQQQ just created a 3D doji. The reason this is important is everytime we have seen reversal candles close to or in our red box (Supply zone) usually we see selloffs follow.
Price came very close to the red box and created a 3D reversal doji that could signal some downside price action. If this is to occur the first level to watch would be our 0.382 Fibonacci level around $65.
USA variablesVariables importantes de
Como se complementen estas variables puede determinar el futuro de USA.

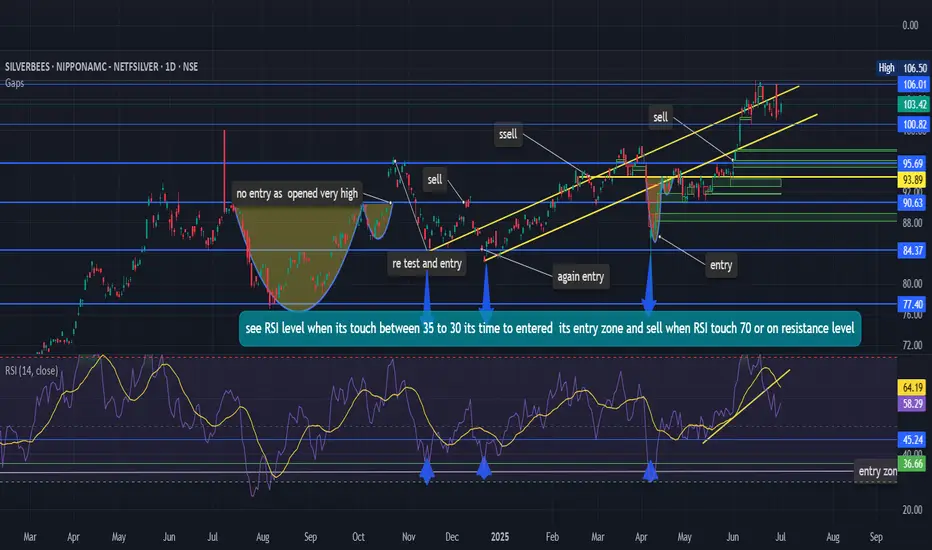
nifty siver bees chart Nifty Silver BeES – RSI Strategy & Quick Analysis
I wanted to share this Nifty Silver BeES chart with you all, purely for learning and discussion. By studying this chart, you might find some useful insights to sharpen your own analysis.
One of the key things here is the RSI (Relative Strength Index) — it plays a major role in identifying potential entry and exit zones:
✅ Entry Zone: Whenever the RSI drops into the 30–35 range, it often signals a good buying opportunity. Historically, we tend to see a decent upward move from this zone.
🚩 Exit Zone: When the RSI approaches 70 or higher — especially near resistance levels — that’s usually a signal to start selling or at least tightening stops.
That said, patience is absolutely crucial with this approach. Sometimes profit booking can take a while, and at other times, it could be as quick as “buy and get out.” It all depends on how the market behaves on that particular day.
If you find this chart interesting, do let me know. And if you spot any ways to improve this strategy or add more depth to the analysis, I’d love to hear your thoughts!
By the way, targeting a quick 2–4% profit often works quite well with this method, provided you stick to your plan and manage risk carefully.
Update on the markets 7-1-2025SPX still floating but IWM and DJT are both having strong rallies, which usually means SPX will go higher today or tomorrow. Gold is at resistance. NG is a support. OIl still looks like a bear flag. BTC is pulling back from 107k - again.

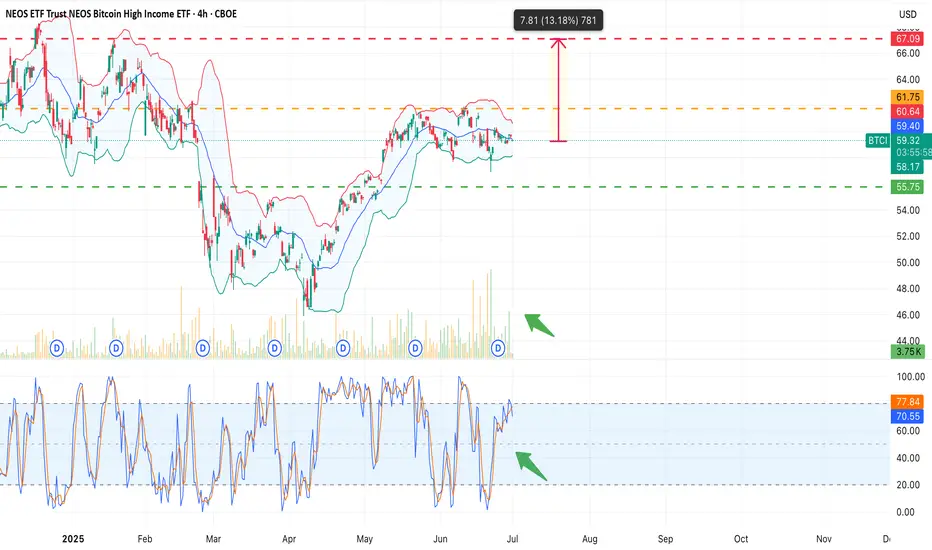
BTCI – setting up for a breakout?What is CBOE:BTCI ?
BTCI is the NEOS Bitcoin High Income ETF – a covered-call ETF designed to provide exposure to Bitcoin price trends with monthly income. The fund uses options strategies to generate consistent yields while holding Bitcoin futures and related instruments.
💰 Annual dividend yield: approx. 18%, paid monthly
📆 Ideal for income-focused investors who still want crypto exposure without direct volatility.
CBOE:BTCI Current price: $59.64
Strong volume is building up (green arrow), and the stochastic oscillator shows bullish momentum returning.
Price is consolidating just under the resistance at $60.90–61.75, with a potential upside of +13.2%, targeting the $67.09 zone.
📈 If volume holds and breaks above $61.75, the move toward the target becomes likely.
🟩 Key support: $58.07 / $55.75