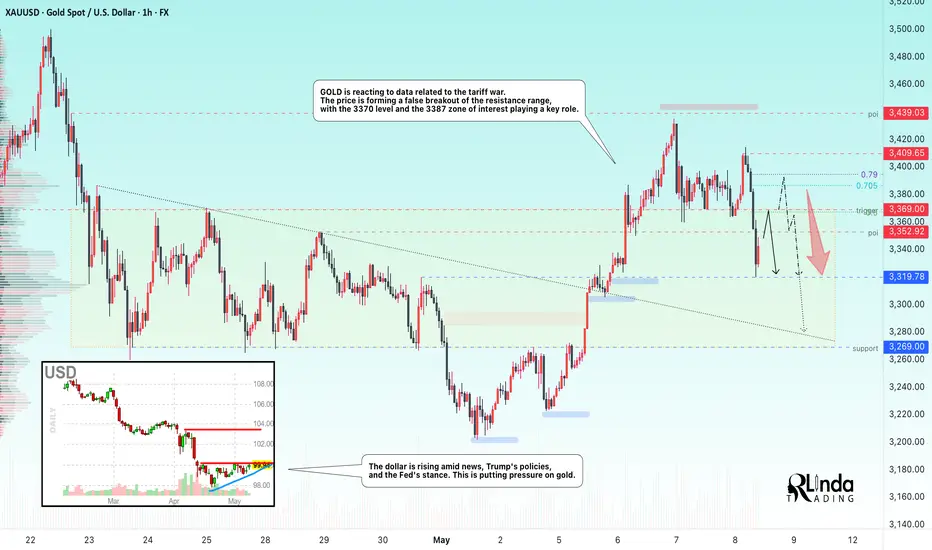
GOLD → Return to range. Fall from resistance...FX:XAUUSD is reacting to data related to the tariff war. The price is returning to the range and forming a false breakout of resistance. The level of 3370 and the zone of interest at 3387 play a key role.
On Thursday, gold rose to $3,400 amid a weaker dollar, increased demand for safe-haven assets, and continued uncertainty due to US trade policy and tensions in the Middle East and Ukraine. The Fed left rates unchanged and expressed caution in its assessment of the outlook, which also supports gold's rise.
However, in the European session, we are seeing gold react to the trade deal with Britain, most likely due to the easing of tariffs. Now the main focus is on the terms of the deal. We should not forget about China, where the situation remains tense, but everyone is waiting for a resolution.
Resistance levels: 3352, 3369, 3385
Support levels: 3319, 3269
The fundamental backdrop changes several times a day. At the moment, the situation is as follows: the rise of the dollar, the weakening of the tariff war, and the hawkish stance of the Fed may put pressure on gold. Therefore, I expect the decline to continue after a retest of 3370-3386. In this case, the target could be 3319.
Best regards, R. Linda!
Futures market
Lingrid | GOLD potential PULLBACK and CONTINUATIONThe price perfectly fulfilled my previous idea . OANDA:XAUUSD is accelerating off the trendline support with a sharp impulse leg and now hovering around a potential breakout zone. Momentum remains bullish as price reclaims previous highs and aims for the upper boundary of the resistance zone. The structure favors continuation as long as the trendline holds.
📌 Key Levels
Support zone: 3,345.000 (PDH and trendline convergence)
Breakout target: 3,495.000 (Resistance ceiling within the TARGET area)
Invalidation level: Below 3,345.000 and trendline breakdown ⚠️ Risks
Potential false breakout above 3,400
Failure to hold above 3,345 may trigger deeper correction
Resistance at ATH level could stall momentum
Traders, if you liked this idea or if you have your own opinion about it, write in the comments. I will be glad 👩💻

GOLD Analysis - Can buyers push toward 3,410$?OANDA:XAUUSD is trading within a clear ascending channel, with price action consistently respecting both the upper and lower boundaries. The recent bullish momentum indicates that buyers are in control, suggesting there's chances for potential continuation on the upside.
The price has recently broken above a key resistance zone and now came back for a retest. If this level holds as support, it would reinforce the bullish structure and increase the likelihood of a move toward the 3,410 target, which aligns with the channel’s upper boundary.
As long as the price remains above this support zone, the bullish outlook stays intact. However, a failure to hold above this level could invalidate the bullish scenario and increase the likelihood of a deeper pullback.
Remember, always confirm your setups and use proper risk management.

GOLD 4H CHART ROUTE MAP UPDATEHey Everyone,
Once again another smashing day on the charts today. After sharing updates and completing targets on our 1h chart idea; please now see update on our 4H chart idea, which is also playing out as analysed.
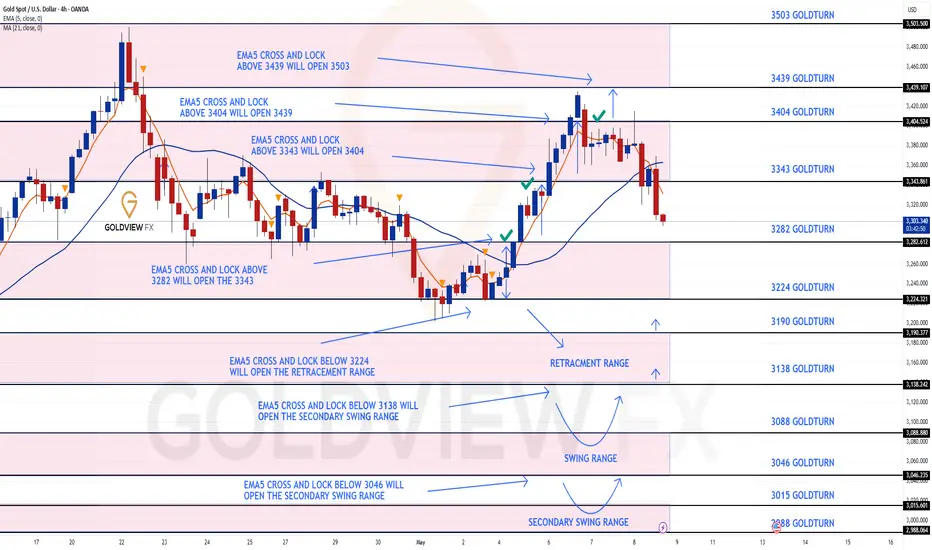
We started with our Bullish target hit at 3282, followed with ema5 cross and lock opening 3343, which was hit perfectly. We then got ema5 cross and lock above 3342 opening 3404, also got completed. The cross and lock confirmation gave plenty of time to get in for the action.
No further cross and lock with ema5 above 3404 confirmed the perfect rejection, which we are seeing now, with price testing the lower Goldturns for support.
We will continue to buy dips using our support levels taking 30 to 40 pips. As stated before each of our level structures give 20 to 40 pip bounces, which is enough for a nice entry and exit. If you back test the levels we shared every week for the past 24 months, you can see how effectively they were used to trade with or against short/mid term swings and trends.
The swing range give bigger bounces then our weighted levels that's the difference between weighted levels and swing ranges.
BULLISH TARGET
3282 - DONE
EMA5 CROSS AND LOCK ABOVE 3282 WILL OPEN THE FOLLOWING BULLISH TARGET
3343 - DONE
EMA5 CROSS AND LOCK ABOVE 3343 WILL OPEN THE FOLLOWING BULLISH TARGET
3404 - DONE
EMA5 CROSS AND LOCK ABOVE 3404 WILL OPEN THE FOLLOWING BULLISH TARGET
3439
EMA5 CROSS AND LOCK ABOVE 3439 WILL OPEN THE FOLLOWING BULLISH TARGET
3503
BEARISH TARGETS
3224
EMA5 CROSS AND LOCK BELOW 3224 WILL OPEN THE FOLLOWING RETRACEMENT RANGE
3190
3138
EMA5 CROSS AND LOCK BELOW 3138 WILL OPEN THE SWING RANGE
SWING RANGE
3088 - 3046
EMA5 CROSS AND LOCK BELOW 3046 WILL OPEN THE SECONDARY SWING RANGE
SECONDARY SWING RANGE
3015 - 2988
As always, we will keep you all updated with regular updates throughout the week and how we manage the active ideas and setups. Thank you all for your likes, comments and follows, we really appreciate it!
Mr Gold
GoldViewFX
XAU/USD: Gold Regains Strength After Pullback – New Highs Ahead?By analyzing the gold chart on the 2-hour timeframe, we can see that yesterday, as expected, gold surged above $3400, reaching as high as $3439 before facing strong selling pressure, dropping sharply to $3359.
Currently, gold is trading around $3385, and if the price can hold above $3366, we may expect further bullish momentum. I believe gold is setting up for another move above $3400, potentially aiming to break into new highs once again.
THE LATEST ANALYSIS :
Please support me with your likes and comments to motivate me to share more analysis with you and share your opinion about the possible trend of this chart with me !
Best Regards , Arman Shaban

XAU/USD - Fed warns of Economic UncertaintyThe XAU/USD pair on the M30 timeframe presents a Potential Buying Opportunity due to a recent Formation of a Bullish Flag Pattern. This suggests a shift in momentum towards the upside and a higher likelihood of further advances in the coming hours.
Possible Long Trade:
Entry: Consider Entering A Long Position around Trendline Of The Pattern.
Target Levels:
1st Resistance – 3473
2nd Resistance – 3519
🎁 Please hit the like button and
🎁 Leave a comment to support for My Post !
Your likes and comments are incredibly motivating and will encourage me to share more analysis with you.
Best Regards, KABHI_TA_TRADING
Thank you.

GOLD → The rally has given way to a correction. News aheadFX:XAUUSD is rising amid a challenging geopolitical environment. During the Asian session, a correction to the zone of interest (0.5 Fibonacci) is forming. The situation is quite complex and tense.
On Tuesday, the metal strengthened to 3433 due to tensions in the Middle East, but during the Asian session, gold fell sharply due to optimism surrounding the upcoming US-China trade talks, the strengthening of the dollar, and profit-taking ahead of the Fed's decision.
Investors are waiting for Powell's speech, which will determine the future of interest rate policy.
Despite the decline, gold is supported by ongoing geopolitical risks in the Middle East, Eastern Europe, and South Asia.
Theoretically, if the bulls keep the price above 0.5 Fibonacci, the growth may continue to 3439, as the price has not yet reached the liquidity zone.
Resistance levels: 3439
Support levels: 3369, 3352
However, unpredictable data could trigger a return of the price to the range and a correction to 3323-3300. Risk is posed by upcoming news: FOMC, Powell's speech, and the rate meeting. The Fed's hawkish stance could put pressure on gold...
Best regards, R. Linda!

(XAU/USD) Bearish Trade Setup – Targeting $3,222 with 1:6 Risk/REntry Point: Around 3,409.33 - 3,408.41 USD.
Stop Loss: 3,437.87 USD.
Target (Take Profit): 3,222.53 USD.
Risk/Reward Ratio: Approximately 1:6, which is favorable.
📉 Price Action & Trend Analysis:
A rising wedge (or channel) appears to have formed and broken to the downside — a bearish signal.
The current price at 3,341.47 has broken below a minor support zone (highlighted in purple), indicating bearish momentum.
Price is now approaching the 200 EMA, which is acting as potential dynamic support.
📌 Key Levels Highlighted:
Support Zones: Near 3,347.47 (previous minor support) and 3,222.53 (main target zone).
Resistance Zones: At the entry level and above, near 3,437.87 (Stop Loss zone).
🔄 Indicators:
Moving Averages (Red and Blue Lines): Shorter-term moving average (red) is below the longer-term (blue), indicating downward pressure.
Momentum Shift: The sharp drop suggests a likely continuation of the bearish trend.

THE KOG REPORT - Update End of day update from us here at KOG:
We can honestly say, even though the KOG Report plan didn't work out as we intended this week, it's been a phenomenal week on gold in Camelot. We've managed to capture the top (AGAIN), then bounced the low, then produced the FOMC KOG Report which gave us another level to level short with a pip perfect bounce for the long.
Early we published the play stating 3370 needs to break to go higher which it didn't giving the move downside that we're seeing now. Support here is below on this move if they manage to break through the 3300 level. No point attempting a long or short here as it's late session so the levels to watch are:
Support 3301 / 3296 and below that 3276
Resistance 3310 and above that 3320 which will need to break
As always, trade safe.
KOG

08.05.25 Morning ForecastPairs on Watch -
FX:AUDCAD
FX:EURCAD
FX:USDCHF
FOREXCOM:COFFEE
A short overview of the instruments I am looking at for today, multi-timeframe analysis down to what I will be looking at for an entry. Enjoy!

Simple Break of Structure BoS Trading Strategy Explained
One of the best and reliable strategies to trade break of structure BoS is to apply multiple time frame analysis.
In this article, I will teach you my break of structure gold forex trading strategy. You will get a complete step-by-step guide with examples.
Let's start with a quick theory and let me explain to you what is break of structure BoS in Smart Money Concept SMC trading.
In a bullish trend, break of structure BoS is an important event that signifies a continuation of an uptrend. It is based on a violation and a candle close above the level of the last higher high (HH).
After a breakout, the broken level becomes the first strong support for trend-following buying.
Check multiple examples of confirmed breaks of structure BoS on GBPNZD forex pair on a weekly time frame.
In a downtrend, Break of Structure BoS means a bearish trend continuation . Break of Structure is considered to be confirmed when a candle closes below the level of the last lower low (LL).
The broken key level becomes the closest strong support for buying.
That's the example of a healthy downtrend on USDJPY forex pair on a daily. Each break of structure BoS pushed the prices lower, providing a strong signal to sell.
What newbie traders do incorrectly, they trade break of structure without a confirmation strategy, and it leads to substantial losses.
Though GBPCHF is trading in a bullish trend and though each BoS provided a trend-following signal. The price retraced significantly lower below the broken structure before the growth resumed.
When the price retests a broken structure after BoS in a bullish trend, start lower time frame analysis.
If you identified a break of structure on a daily, analyze 4h/1h time frames.
If on a 4H, then 30/15 minutes.
After the price sets a new higher high with BoS in uptrend, it usually starts trading in a minor bearish trend on lower time frames.
With our strategy, your signal to buy will be a retest of a broken structure and a consequent bullish Change of Character CHoCH . That will provide an accurate bullish signal.
In a bearish trend, analyze the lower time frames after a retest of a broken structure. Your signal to sell will be a bearish Change of Character CHoCH.
Look at a price action on EURCHF on a daily.
We see a strong bullish trend and a confirmed Break of Structure BoS.
According to the rules of our trading strategy, we start analyzing 4h/1h time frames after a retest of a broken level of the last Higher High.
Our signal to buy is an intraday bullish CHoCH. We open a long trade after that with the stop loss below the intraday lows and take profit being a current high.
That's how simple this strategy is.
Multiple time frame analysis provides the extra level of security.
Strong lower time frame confirmation substantially increases the win ratio of a trading setup.
❤️Please, support my work with like, thank you!❤️
I am part of Trade Nation's Influencer program and receive a monthly fee for using their TradingView charts in my analysis.

Gold's Bearish Momentum Builds from PRZ-Short SetupGold ( OANDA:XAUUSD ) started to decline exactly from PRZ (previous idea) as I expected in my previous idea . And with the loss of the Support zone($3,387-$3,357) we can expect further decline.
Gold is currently moving near the Resistance zone($3,387-$3,357 ) and the Potential Reversal Zone(PRZ) .
From the Elliott Wave theory , Gold appears to have completed a five-wave impuls e and we should expect corrective waves . Since the momentum of the second decline that broke the Support zone($3,387-$3,357) is high , the correction is expected to continue and Gold appears to be completing a pullback .
---------------------------------------------
The US Unemployment Claims Index was also released a few minutes ago, and let's take a look and examine the possible impact on Gold .
This better-than-expected data confirms a stronger U.S. labor market , reducing the urgency for the Fed to cut rates anytime soon .
Impact on Gold :
A resilient job market supports the hawkish stance of the Fed , which could keep downward pressure on Gold in the short term as yields and the dollar remain firm.
However, traders should remain cautious and watch for upcoming data and Fed commentary, which could shift the tone.
---------------------------------------------
I expect Gold to start falling from Potential Reversal Zone(PRZ) to the targets I have indicated on the chart. The first target could be around $3,319 .
Note: If Gold touches $3,401(the worst Stop Loss(SL)), we can expect the resistance lines to break and gold to rise further.
Gold Analyze ( XAUUSD ), 1-hour time frame.
Be sure to follow the updated ideas.
Do not forget to put a Stop loss for your positions (For every position you want to open).
Please follow your strategy; this is just my idea, and I will gladly see your ideas in this post.
Please do not forget the ✅' like '✅ button 🙏😊 & Share it with your friends; thanks, and Trade safe.

#XAUUSD: Gold to continue rising,$4000 by end of the year targetGold has unexpectedly declined to 3335 in response to the anticipated price increase following the unfolding conflict in Asia. Currently, two regions exhibit price reversals.
The XAUUSD price is progressing in accordance with our previous analysis. Both analyses have successfully reached the take-profit target, and we anticipate further bullish momentum in the near future. However, price movement is subject to potential reversals in two areas. Both targets are long-term oriented, indicating potential swing moves that may take time to complete. Stop-loss, intraday target, and position decisions should be based on individual analysis and overall market assessment. Strong fundamentals are essential for price to reach the designated target area.
We acknowledge our bias in this analysis, but it does not guarantee the realisation of the described outcome.
Upon trade activation, you can establish two targets. You have the flexibility to select your own take-profit based on your analysis and trade management strategies.
We appreciate your unwavering support.
For those who wish to contribute, we offer several avenues for assistance:
- Liking our ideas
- Commenting on our ideas
- Sharing our ideas
Thank you for your continued support.
If you feel inclined, we would be grateful for your generosity.
Best regards,
Team Setupsfx_❤️🚀

Gold – False Break Signals More DownsideIn my commentary yesterday, I highlighted the importance of the 3360 support zone. While Gold initially found a bid around this level, the sharp reversal from the 3415 Asian session high suggests a failed breakout.
Key Observations:
• The quick rejection above 3360 now looks like a false break, reinforcing the bearish outlook.
• The recent high around 3415 appears to be a lower high following the 3500 ATH, confirming potential trend weakness.
• Given this structure, a drop back to at least the 3270 support zone seems highly probable.
Disclosure: I am part of Trade Nation's Influencer program and receive a monthly fee for using their TradingView charts in my analyses and educational articles.

DeGRAM | GOLD has reached the channel boundary📊 Technical Analysis
● Chart shows a bullish breakout from the falling wedge into a rising channel. Support near $3,300 held firm, and price is now above the $3,360 pivot, eyeing the $3,430–$3,500 resistance zone. Oscillators on daily chart remain positive, reinforcing the upward bias.
💡 Fundamental Analysis
● Global uncertainty is fueling safe-haven demand: tensions in Ukraine, the Middle East and renewed US-China trade fears are supporting gold.
● A softer US dollar and policy uncertainty also boost bullion; analysts note continued demand keeping prices elevated above $3,000.
● Bank of America highlights that US trade-policy uncertainty will “lend support” to gold prices.
✨ Summary
Upside momentum remains strong, with key support around $3,300–$3,360. Gold’s long bias points toward ~$3,500 in the short term, underpinned by geopolitical risks and a weak dollar.
-------------------
Share your opinion in the comments and support the idea with a like. Thanks for your support!

THE KOG REPORT - FOMCTHE KOG REPORT – FOMC
This is our view for FOMC, please do your own research and analysis to make an informed decision on the markets. It is not recommended you try to trade the event if you have less than 6 months trading experience and have a trusted risk strategy in place. The markets are extremely volatile, and these events can cause aggressive swings in price.
Our NFP KOG Report worked pretty well apart from it being a Friday and us closing out positions for the weekend only for the move to complete on Monday. For this FOMC we’ll share the levels and potential reaction points on the red boxes as well as the red box target levels. Due to the range, it’s best to wait for the break and also for them to move the price to where they want, then hunt the trade once price has settled.
We have the immediate support level below 3360-55 which if held can push this upside to break the recent high and that 3480-90 level again. Break of that level we have red box region 3330-20 which is where we could get a RIP but that will give us the flip with potential for the order region 3350-55 to turn into resistance unless broken. For that reason, a down move for now could only give scalps for decent captures on tap and bounces.
3320 is the line in the sand, if broken below we’ll get the long from the 3290-95 region which will come next week.
Note, these days it’s only Trump that manages to move the markets aggressively, so this FOMC is most likely already priced in. Not worth attempting the immediate levels so we’ll rather wait for the extreme levels.
RED BOXES INDI LEVELS:
Break above 3395 for 3406, 3410, 3420, 3430 and 3435 in extension of the move
Break below 3375 for 3370, 3366, 3356, 3351 and 3345 in extension of the move
Please do support us by hitting the like button, leaving a comment, and giving us a follow. We’ve been doing this for a long time now providing traders with in-depth free analysis on Gold, so your likes and comments are very much appreciated.
As always, trade safe.
KOG

XAU/USD: Bullish Momentum Builds Near Breakout Zone, Key SupportGold (XAU/USD) is gaining strength after rebounding from trendline support, forming a sharp impulsive move and now hovering near a potential breakout zone. Momentum remains bullish, as the price reclaims previous highs and eyes the upper resistance boundary around 3,495.000.
The structure favors trend continuation as long as price remains above the key support zone at 3,345.000, where trendline and previous day’s high converge. A sustained move above 3,400 could confirm a breakout, but the risk of a false breakout remains.
Currently, the price is consolidating above a critical intersection of trendline and horizontal support near 3,300. This level must hold for bulls to retain control. A bounce from this zone would support a move toward the upper resistance, with the next target at 3,495.000. However, a break below 3,345.000 may invalidate the setup and lead to deeper correction

GOLD OUTLOOK: US–UK Trade Deal in Focus as Tariff Tensions Ease GOLD OUTLOOK: US–UK Trade Deal in Focus as Tariff Tensions Ease — Is War Risk Losing Grip?
The spotlight has shifted.
As geopolitical tensions between India and Pakistan continue to simmer, gold has surprisingly failed to respond with the expected safe-haven spike. Instead, the market’s attention has turned sharply toward global trade negotiations — particularly the latest developments between the United States and the United Kingdom.
🌐 Global Trade Truce: Why It Matters
Recent headlines confirm the UK is one of the first nations to sign a new trade and tariff agreement with the US — easing pressure from global tariff wars and restoring market confidence.
➡️ Result?
The US Dollar (DXY) has staged a meaningful recovery, limiting gold’s upside and reducing short-term bullish sentiment.
While the war narrative is still present, it's the economic diplomacy that’s dominating headlines and price action this week.
📉 Market Reaction: Mixed Signals & Wild Volatility
Recent gold movements have been erratic — sweeping liquidity zones of nearly $100 per ounce in single sessions. This type of behavior reflects deep uncertainty and makes short-term directional trading highly risky.
For now, the priority should be on key H2–H4 zones, with reduced exposure to scalp trades until structure stabilizes.
🔍 Key Levels to Watch (H4 Anchored)
🔻 SELL SCALP
Entry: 3,364 – 3,366
SL: 3,370
TPs: 3,360 → 3,356 → 3,352 → 3,348 → 3,344 → 3,340 → 3,330
🔻 SELL ZONE (Breakout Rejection Area)
Entry: 3,380 – 3,382
SL: 3,386
TPs: 3,376 → 3,372 → 3,368 → 3,364 → 3,360 → 3,350
🟢 BUY ZONE (Mid-Term Support)
Entry: 3,322 – 3,320
SL: 3,316
TPs: 3,326 → 3,330 → 3,334 → 3,340
📌 Strategy Notes:
The European session open has triggered bearish candles — be cautious on BUY setups during London hours.
If you’re holding long positions from earlier this week, consider scaling out around the 3,355 zone.
Keep an eye on upcoming comments from Donald Trump, especially around the new trade framework. These could trigger short-term volatility spikes or broader trend shifts.
🧠 Final Thoughts:
Gold is no longer driven solely by geopolitical unrest — macro narratives are back in control.
With tariff tensions easing and stronger-than-expected USD recovery, traders need to remain flexible, disciplined, and reactive — not predictive.
✅ Focus on clear levels.
✅ Trade with confirmation.
✅ Avoid emotional scalps during uncertainty.
📣 Follow this page for real-time zone updates and structured market reads. Let’s finish this week strong.

GOLD 1H CHART ROUTE MAP UPDATEHey Everyone,
Once again our trading idea delivers the goods!!!
We got our target yesterday at 3382 and then followed with the cross and lock above 3382 leaving 3428 open.
- This played out perfectly with 3428 getting hit. No further cross and lock above 3428 confirmed the perfect rejection into the lower weighted Goldturn. The Goldturn gave the bounces, for 20 to 40 pips, just like we always state. This was once again a double bubble move for us!!
We will continue to buy dips using our support levels taking 20 to 40 pips. As stated before each of our level structures give 20 to 40 pip bounces, which is enough for a nice entry and exit. If you back test the levels we shared every week for the past 24 months, you can see how effectively they were used to trade with or against short/mid term swings and trends.
The swing range give bigger bounces then our weighted levels that's the difference between weighted levels and swing ranges.
BULLISH TARGET
3260 - DONE
EMA5 CROSS AND LOCK ABOVE 3260 WILL OPEN THE FOLLOWING BULLISH TARGETS
3308 - DONE
EMA5 CROSS AND LOCK ABOVE 3308 WILL OPEN THE FOLLOWING BULLISH TARGET
3340 -DONE
EMA5 CROSS AND LOCK ABOVE 3340 WILL OPEN THE FOLLOWING BULLISH TARGET
3382 - DONE
EMA5 CROSS AND LOCK ABOVE 3382 WILL OPEN THE FOLLOWING BULLISH TARGETS
3428 - DONE
EMA5 CROSS AND LOCK ABOVE 3428 WILL OPEN THE FOLLOWING BULLISH TARGETS
3478
BEARISH TARGETS
3217
EMA5 CROSS AND LOCK BELOW 3217 WILL OPEN THE BEARISH TARGETS
3174
EMA5 CROSS AND LOCK BELOW 3174 WILL OPEN THE SWING RNGE
3126
3078
EMA5 CROSS AND LOCK BELOW 3078 WILL OPEN THE SECONDARY SWING RANGE
SECONDARY SWING RANGE
3034 - 2979
As always, we will keep you all updated with regular updates throughout the week and how we manage the active ideas and setups. Thank you all for your likes, comments and follows, we really appreciate it!
Mr Gold
GoldViewFX

Hanzo : Gold15m : Reversal Zone / Next Move is Confirmed🆚 Gold – Hanzo’s Strike Setup
🔥 Timeframe: 15-Minute (15M)
——————
💯 Main Focus: Bearish After Retest at 3354
We are watching this zone closely.
———
👌 Market Signs (15M TF):
• Liquidity Grab + CHoCH at 3350
• Liquidity Grab + CHoCH at 3400
• Strong Rejections seen at:
➗ 3325 – Major support / Key level x5 Retest
➗ 3360 – Proven resistance

Bullish bounce of pullback support?WTI Oil (XTI/USD) has bounced off the pivot which has been identified as a pullback support support and could potentially rise to the pullback resistance.
Pivot: 57.60
1st Support: 56.26
1st Resistance: 59.82
Risk Warning:
Trading Forex and CFDs carries a high level of risk to your capital and you should only trade with money you can afford to lose. Trading Forex and CFDs may not be suitable for all investors, so please ensure that you fully understand the risks involved and seek independent advice if necessary.
Disclaimer:
The above opinions given constitute general market commentary, and do not constitute the opinion or advice of IC Markets or any form of personal or investment advice.
Any opinions, news, research, analyses, prices, other information, or links to third-party sites contained on this website are provided on an "as-is" basis, are intended only to be informative, is not an advice nor a recommendation, nor research, or a record of our trading prices, or an offer of, or solicitation for a transaction in any financial instrument and thus should not be treated as such. The information provided does not involve any specific investment objectives, financial situation and needs of any specific person who may receive it. Please be aware, that past performance is not a reliable indicator of future performance and/or results. Past Performance or Forward-looking scenarios based upon the reasonable beliefs of the third-party provider are not a guarantee of future performance. Actual results may differ materially from those anticipated in forward-looking or past performance statements. IC Markets makes no representation or warranty and assumes no liability as to the accuracy or completeness of the information provided, nor any loss arising from any investment based on a recommendation, forecast or any information supplied by any third-party.

How to Set Up and Use OCO Orders on TradingViewThis tutorial video explains what OCO (Order cancels orders) are, how they work, how to place them in Tradingview, and how they relate to bracket orders.
You'll learn how to add them to new entry orders as well as existing positions.
There is a substantial risk of loss in futures trading. Past performance is not indicative of future results. Please trade only with risk capital. We are not responsible for any third-party links, comments, or content shared on TradingView. Any opinions, links, or messages posted by users on TradingView do not represent our views or recommendations. Please exercise your own judgment and due diligence when engaging with any external content or user commentary.

Gold is expected to fall below 3300, continue to short gold!Fundamentals:
1. Pay attention to whether the geopolitical conflicts escalate, including the situation between India and Pakistan, Russia and Ukraine, and the situation between the United States and Iran, etc.
Technical aspects:
Although the gold price gradually rebounded after hitting 3320 points, the current rebound momentum is relatively weak. The gold price has turned from strong to weak, and the short-term "M"-shaped top structure formed by 3435 points and 3414 points above has suppressed the upward space of the gold price. Therefore, we still focus on shorting gold after the rebound. First, we focus on the resistance area of 3355-3365 points above. If the gold price rebound fails to successfully break through this area, the gold price will fall again and is expected to continue to fall to around 3280 points.
Trading strategy:
Consider shorting gold after gold rebounds to the 3355-3365 area, target price: 3340
