XAU/USD Market Analysis PlanDate: 17/06/2024
-
This analysis is a case study only, a study of investment advice and does not provide signals to inform you of responsibility for the actions to be taken. ❤
Futures market

Silver Short Idea for June Seasonal Outlook 🌦️
June has historically been a challenging month for silver. Seasonality analysis suggests that silver often experiences weakness during this period. Various factors, including market liquidity, investor behavior, and macroeconomic conditions, contribute to this trend. As we enter June, these seasonal patterns may play a significant role in influencing silver prices, potentially leading to a decline.
Commitment of Traders (COT) Index 📊
The COT index, which measures the positioning of different market participants, offers valuable insights into market sentiment. Currently, the 6 month COT index score for silver is at a bearish 3.8%, while the 3-year rolling COT index score is even lower at 2.3%. These figures indicate that smart money—typically the more informed and larger traders—are significantly short on silver. This bearish sentiment from smart money contrasts sharply with the retail traders, who are predominantly long on silver. This divergence often suggests a potential reversal or pullback in prices as the smart money tends to be on the right side of the market over time.
Technical Analysis 🔍
Despite the overall uptrend in silver prices, several key technical signals suggest a potential pullback is on the horizon:
Break of Structure: A higher time frame break of structure has been observed, indicating a potential shift in market dynamics.
Buy Side Liquidity Taken: Recent price action has taken out buy-side liquidity, potentially trapping retail traders who are long.
Imbalance Left Behind: An imbalance left on the H4 chart adds to the expectation of a corrective move.
Given these factors, a strategic short position could be advantageous. The proposed trading plan is as follows:
Entry: Sell at $31.24
Stop Loss: Above the recent H4 high after the imbalance
Take Profit: $26.80
This plan aims to capitalize on the expected pullback to a daily demand level before any new buyers step in.
Conclusion 🧩
In summary, the seasonal weakness in June, coupled with bearish signals from the COT index and technical indicators, supports the case for a short position in silver. While the overall trend remains up, the confluence of these factors suggests a pullback is likely. Traders should consider the outlined strategy to navigate the anticipated market movements.

Why Is The SPX So High And Where Will It End Up?The S&P is rallying on longer term continued softer outlook/risk on rhetoric.
The more Investors have confidence, the more they buy. The more they take long holdings, the more the index rallies as a whole.
At some point, as throughout history this ends.

Gold prices rebounded due to unfavorable news for the dollarGold rate remaining week began out the primary buying and selling consultation at 2,293.70 USD/ounce. During Sunday night buying and selling, spot gold surpassed $2,three hundred an oz. approximately hours earlier than North American markets opened and that degree held in the course of the relaxation of the week.
After that, gold costs reduced slightly, to approximately 15 USD/ounce because the marketplace waited for americaA purchaser inflation file and the FOMC`s hobby fee announcement, up to date monetary forecasts and the clicking convention of FED Chairman - Mr. Jerome Powell on Wednesday.
The US CPI file brought on the marketplace to interrupt out of sideways buying and selling, pushing spot gold from $2,313/ounce to a excessive of $2,336.72/ounce.
By the time the FED introduced that they might preserve hobby charges unchanged, costs had lower back to $2,326/ounce and see gold endured to be offered off because the marketplace absorbed the FED Chairman's "hawkish" stance.
By Thursday, spot gold had over again slipped to help levels. However, the treasured steel has considering that visible a strong healing. By Friday morning, gold costs over again increased, remaining the buying and selling week at 2,332 USD/ounce.
After a protracted slide, global gold costs recorded a sturdy healing week. This is inflicting many specialists to make pretty superb forecasts approximately the short-time period possibilities of treasured metals.
James Stanley - senior marketplace strategist at Forex.com - is one of the specialists forecasting gold costs to upward thrust subsequent week: "I am looking longer-time period variety resistance, round 2,075 -2,082 USD/ounce for longer-time period help.
Sharing the equal opinion, Colin Cieszynski - Chief Market Strategist at SIA Wealth Management - said: "I am positive approximately gold subsequent week. It looks like gold is prepared for a technical healing."
In addition, thirteen Wall Street analysts participated withinside the Kitco News Gold Survey. Experts are notably extra positive approximately the short-time period possibilities of treasured metals.
eight specialists (accounting for 62%) assume gold costs to upward thrust better subsequent week. Only analysts (or 15%) are expecting costs will decline. The closing 3 people (equal to 23%) assume gold to alternate sideways subsequent week.
Meanwhile, 216 votes had been solid in Kitco's on line poll. Of these, 117 traders (equal to 54%) are expecting gold costs will growth subsequent week. Another forty nine people (equal to 23%) are expecting treasured metals will lower in rate. While 50 people (equal to the closing 23%) forecast that gold costs may be flat subsequent week.

Where are we now in the Hong Kong Stock market ?Now, it is always clearer when we have a longer time frame to plot the chart and it seems more common sense why we should buy later and not earlier. Bear in mind that the chart is constantly plotting its price movements and in December 2022, that was the picture shown and one has to rely on this to make a decision.
Of course, if you are trading, then you would have a stop loss, probably at 16968 level. But if you are like me who see the longer term potential of the China market, then a paper loss of 20% is pretty common. And you would average down at 17193 recently when it presents another better buying opportunity.
19116 is an important support level and the price action has went down below it. The next support is at 17193 level and if this breaches, then it is possible that it may returns back to the bearish trend again. I doubt so when the National Team in China are seriously propping up the stock market with different measures.
If we take 14903 as the bottom price point, then the index has risen more than 32% , thus a 8-10% retracement is very common. It should be a buying opportunity for those who continues to believe in the cheap valuation of the Hong Kong stock market.
The only sectors that remains hazy is the property sectors which may take some years to stabilise(2025-2026). Banks are pretty stable not forgetting they are state owned so the government will ensure its viability. Tech stocks are what drives the China market in the coming years - robotics, AI, E-commerce, EV, semiconductors, etc which the Government continues to pour investments into it.
I remain bullish on the HK/China stock market and will continue to accumulate on weakness. Please DYODD

Crude Futures Settle Lower, But Post Weekly Gains I think there are many factors that can cause crude oil to rise, after all, the world situation is unstable right now.

GOLD🔴 Gold is moving within a descending channel and is expected to test the channel’s upper boundary at the 2350 levels, after which the downward trend is likely to continue.

GOLD ( DOWNWARD )OANDA:XAUUSD
HELLO TRADERS
Tendency the price is under bullish pressure at 2,327$
Turning level : The turning 2,327$, so as long as the price bellow this level, there will be a bearish trend
resistance level : the trading above the turning level2,327$ , the price will rise to 2,347 $ , price stabilize this level , there will be reach to 2,365$
support level : The trading stabilizing below 2,327$ , the price will reach the support level of 2,300$ and 2,278 $
corrective level : price will attempt 2,327$ , correct itself before dropping
I HOPE YOU PROFITABLE DAY

US Federal Reserve member Kashkari & GoldUS Federal Reserve member Kashkari declares that there will be only one rate cut this year and it will happen in December.
An interest rate cut by the Federal Reserve is generally considered bearish for gold.
However, Kashkari's statement that there will only be one rate cut this year, and it will happen in December, could be seen as slightly bullish for gold in the short term. This is because it suggests that the Federal Reserve is not planning on aggressive rate cuts, which could help to support the price of gold.

This is my oportunity for today trade. If you have skills and if you have learned something about trading, you have to see this and do something about it, if you dont try, if you are afraid, why?
Just if you put your RISK MANAGMENT there is no fear for you to take a trade and let to it free space.

Solve a WEEKLY PUZZLE :)See the screenshot below.
Imagine this is the only data you have and only timeframe.
What will happen in the nearest future?
Price will go up to green, stays in the grey range, or down to red?
Answer in the comments with your arguments, and later I'll publish a video breakdown.

GOLD 2360 Hey there on 4hTF the Gold has looking for further downside pressure from 2360-62 level
And the upside 12h pressure for sell zone 2390
And the demand supply for upside 2300
So we can expect that in this week we can see again 2360 or 2390 downside movement
After that the upside support level 2300 we had to seems also previously week

POSSIBLE BUY OPPORTUNITY ON SILVERPrice currently trades at $29.169 I anticipate buyers to push the price higher from the current market price.
Target is $29.597

gold ideaThis Is An Educational + Analytic Content That Will show entry ideas for trades.
Make Sure You Watch The Price Action Closely In Each Analysis As This Is A Very Important Part Of Our Method
Disclaimer : This Analysis Can Change At Anytime Without Notice And It Is Only For educational Purpose to Traders To Make Independent Investments Decisions.
Disclaimer
The information and publications are not meant to be, and do not constitute, financial, investment, trading, or other types of advice or recommendations supplied or endorsed by TradingView

XAUUSD CONTINOUS SELLAfter the Chinese government halts the buy of Gold after 18 months, we will see XAUUSD going downwards till 2300 or 2295.

XAUUSD: SELL Short term sell on Gold ..Use proper risk management & please do correct me if I messed up somewhere.

XAUUSD. The seller is aiming for 2326 and belowOn the daily time frame, a sideways movement has been forming since April 9th. The buyer’s vector 4-5 reached a new high. The key candle of vector 4-5 was on May 20th and is located at the top (highest volume, "tKC" on the chart). The seller absorbed this candle, and now the seller’s vector 5-6 is developing. The first target is 2326.515.
On the hourly time frame, there is a short trend. The last seller’s impulse started from 2374.01. The price corrected to the 50% level of the last impulse (2364.498), and we see a strong seller’s continuation.
It makes sense to look for sell opportunities above 2390 if the price returns there or from the defense of the trend by the seller.

Xauusd short setupXauusd has a very strong resistance at 2340. Last Friday during ny session it tried to touch 2340 several times but failed to do so and the price was consolidating between 2330 and 2336 which is a no trade zone.
Enter sell position @ 2330 after retesting with tps given on chart and sl 2340 or according to your risk.

intermediate trend is up but now trading in sidewayI've set up my TradingView chart for Crude Oil (WTI) in the 1-hour timeframe to understand the current market conditions and potential trading opportunities clearly.
1. Price Levels:
- Right now, the price of crude oil is around $78.217.
- I’ve marked key resistance levels at $80.278 and $79.988. These are the areas where I expect the price might face some selling pressure.
- On the downside, support levels are at $77.557 and $77.550, which could act as a floor if the price drops.
2. Trendlines:
- I’ve drawn a couple of diagonal trendlines that form a channel, showing the range within which the price has been bouncing around.
- These trendlines intersect at several points, which might signal potential breakouts or breakdowns.
3. Volume:
- The volume bars at the bottom are crucial. They show how much crude oil is being traded during each hour.
- Notice the spikes in volume during significant price moves—these often indicate strong market activity and can hint at future price directions.
4. Candlestick Patterns:
- I use candlestick patterns to track price action. Recently, the price has been consolidating around the $78.217 level, which suggests that the market is gathering momentum for a big move.
5. Supply and Demand Zones:
- The shaded areas highlight important supply and demand zones. These zones are where there has been significant buying or selling interest in the past.
- They help me identify potential reversal points and set my stop-loss and take-profit levels more accurately.
6. Support and Resistance Boxes:
- I’ve also drawn boxes around the main support and resistance levels to make them stand out.
- The upper box around $80.278 is a strong resistance zone, while the lower box near $77.550 is a key support area.
This setup helps me keep track of critical price levels and market behavior, making it easier to plan my trades. I rely heavily on these visual cues and patterns to anticipate where the market might head next.

USOIL longUSOIL Trading Analysis and Strategy
Entry Price (EP): $77.85
Reason: Through the latest market trend analysis of USOIL, we can see the overall market trend from the 1day, 4hour, and 1hour charts. The 1day chart shows the market's overall trend, and the 4hour chart confirms the trading trend. The 1hour chart presents a short term short entry, stop loss, and take profit signals. We will wait for the reversal signal on the 1hour chart. Based on RSI Divergence data, the entry price is determined to be $77.85.
Stop Loss (SL): $76.62
Reason: Stop losses are calculated using ATR data,providing a margin of safety to limit potential losses if the market moves against the position.
Target Price (TP): $79.03
Reason: The take profit target is set based on ATR data analysis and market trend prediction, aiming to obtain potential profits from expected price changes.
Profit Potential in: $1.18 (11.80usd/lot)
Please note that Forex trading involves risks and the analysis provided is based on the information available. Market conditions can change rapidly, so it is important to stay current and consider implementing risk management strategies. It is crucial to monitor the market closely and adjust your trading strategy accordingly.

CHART BREAKDOWN XAUUSD: Key Levels, Targets and Thoughts!Brief Description🖊️:
The chart provides insights into critical market levels, emphasizing an essential supply zone (low-risk sell zone) spanning from 2354 to 2357. Additionally, two medium-risk buy zones between 2318 to 2315 and 2299.5 to 2298, respectively, are highlighted.
Things I Have Seen👀:
Important Supply Zone🟢: Identified between 2354 and 2357, serving as a low-risk sell.
Important Demand Zone🟢: Identified between 2299.5 and 2298, serving as a low-risk buy.
Medium-Risk Buy Zone🟠: Noted between 2318 and 2315, suggesting another area with moderate risk for potential buying positions.
Bullish Targets📈:
2304: Possible retracement area.
2318: Possible retracement area.
2330: Possible retracement area.
2334: Possible retracement area.
2342: Significant supply zone.
2355: Significant supply zone.
Bearish Targets📉:
2334: Possible retracement area.
2330: Possible retracement area.
2318: Essential Demand Zone
2299.5: Essential Demand Zone
Ultimate Target: 2287- Laying Low Liquidity
What's Important Now❗
Currently, the crucial approach is to wait and observe the price action at this level. We need to assess how the market reacts before considering any decisive moves. Stay observant and responsive to real-time developments in the market.

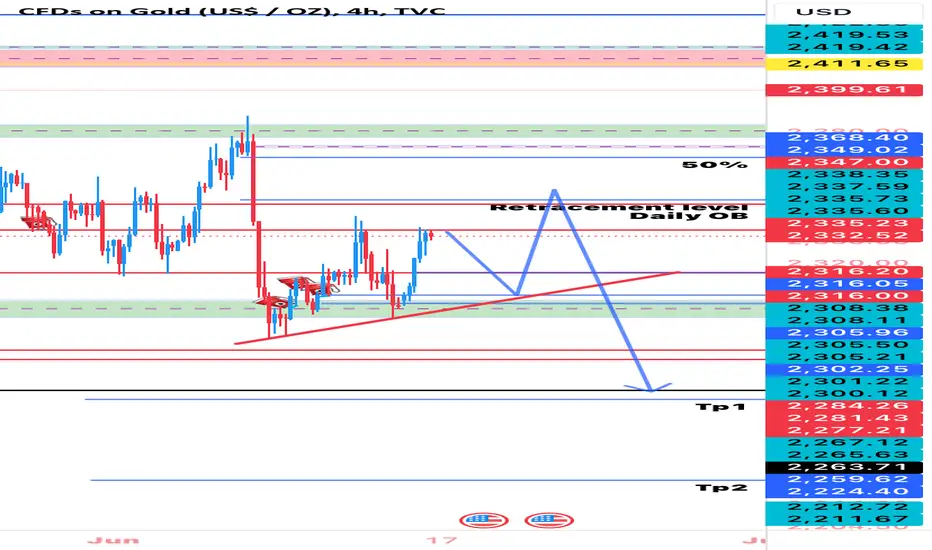
Long sell comingGold will retrace to the line of the trend downside and then bounce from there to upside long reaching retracement area and daily OB as shown on the chart .
GOLDgold is currently trading at wave 4. that shoud rally for wave 5 of high degree 3. However I'm looking at this to atleast trade into the blue box.
