Dollar I Daily CLS I Model 1 I KL OB I Target TRCandleYo Market Warriors ⚔️
It's risky, re-entry, but scared money makes no money.
if you’ve been riding with me, you already know:
🎯My system is 100% mechanical. No emotions. No trend lines. No subjective guessing. Just precision, structure, and sniper entries.
🧠 What’s CLS?
It’s the real smart mon
Market indices

One last squeeze and NAS100 could explode into the next rallyThe NAS100 is currently coiling within a tight consolidation range, showing signs of tension building up. After a strong push upward, price has been moving sideways in a narrowing structure. This build-up around the high, a compression of buyers and sellers in a low-volatility squeeze could be an in

NSDQ100 Bullish breakout retest?Donald Trump escalated trade tensions again, threatening a 35% tariff on Canadian goods shortly after reopening trade talks, and floated doubling global tariffs to 20%. This reinforces his aggressive protectionist stance and puts renewed pressure on allies like Canada and Vietnam, the latter blindsi

NAS100 Setup Locked In — Ride the Drop from the Order Block!Hey Guys,
I'm planning a sell trade on the NAS100 index from a designated order block. Once price reaches the sell zone, the position will be activated.
📍 Trade Details:
- 🟢 Entry Level: 22,869
- 🔴 Stop Loss: 22,930
- 🎯 TP1 – First Target: 22,839
- 🎯 TP2 – Second Target: 22,794
- 🎯 TP3 – Final

Us30 h4 next move Rejection near BoS
2. Break below support zone
3. Lower high formation
4. Bearish continuation towards 43,250

SPX500 Bearish Below 6246 – Eyes 6223 and 6195SPX500 Analysis
SPX500 stays under bearish pressure below 6246, targeting 6223 and possibly 6195 if the decline continues.
Recent tariff escalation by President Trump is adding weight to downside momentum across indices.
Pivot: 6246
Support: 6223, 6195, 6143
Resistance: 6268, 6291

20% in 60 daysSince the 90's we have seen many times where the broader market (SPX) has seen a pretty significant pull back, more than 10% and then a rally. Almost every time the market rose more than 20% in 60 days or less has been a good place to take profits. Clearly everything is super bullish right now, and

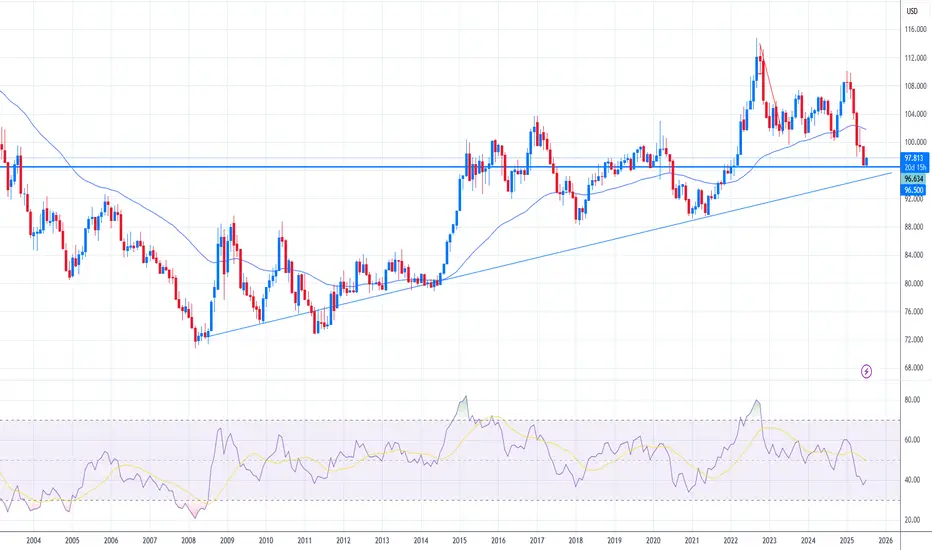
DXY Tests Key Support – What’s Next for the Dollar?
The U.S. Dollar Index (DXY), which tracks the dollar’s performance against a basket of major currencies, recently broke below its 50-month moving average based on the monthly chart —a significant technical signal. After this drop, the index is now bouncing off a key support zone near 96.50.
This a
#Nifty directions and levels for July 11th:Good morning, Friends! 🌞
Here are the market directions and levels for July 11th:
There have been no major changes in the global market. It has been maintaining a moderately bearish sentiment, and our local market is also showing a moderately bearish tone. Gift Nifty is supporting this view by ind

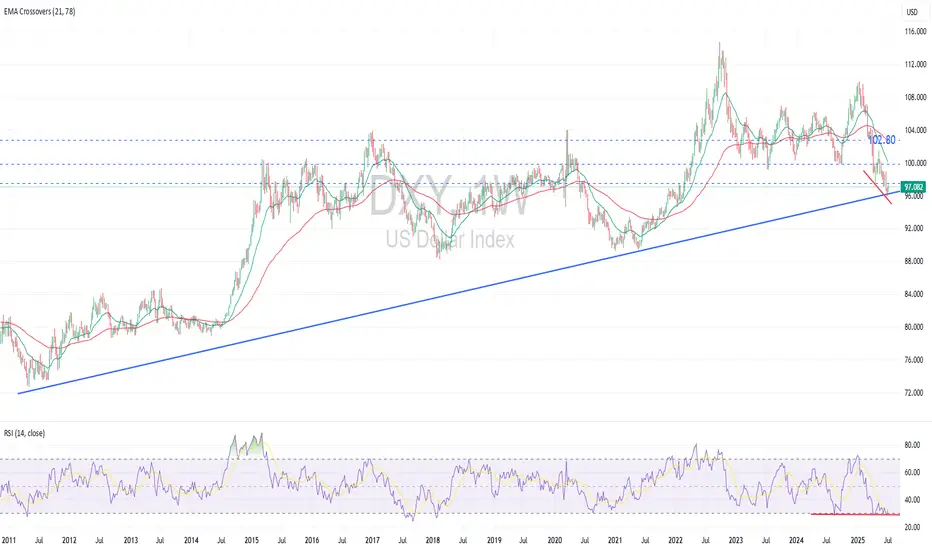
DXY may rebound significantly soonDXY Likely to Rebound Significantly Soon
Technical Perspective:
DXY recently broke below its previous low, forming a lower low, with both EMAs signaling a downtrend. However, the price has now reached a 14-year-old long-term ascending trendline support , which reflects the strength and effe
See all popular ideas