SPX500 IndexPair : SPX500 Index
Description :
Completed " 123 " Impulsive Waves
Demand Zone
Bullish Channel as an Corrective Pattern in Short Time Frame
Break of Structure
Fibonacci Level - 50.00% / 61.80%
Market indices

Good closing by Nifty just above mid-channel resistance. Nifty saw a good closing today above mid channel resistance but could not hold on to higher levels as it found the resistance at 22502 to hot to cross. 22502 was today's high and might act as a resistance again tomorrow. If this level is crossed and we get a closing above it the next resistance levels will be at 22587 and 22658. Above 22658 bull have potential to take full control of the market and in such a scenario we can see Nifty climbing to the highs of 22730 and 22801 in the coming week or weeks. On the lower side, today's low of 22345 is a good support followed by Mother line support of 50 Hours EMA at 22235. Below 22235 Nifty becomes week and we might again see the levels of 22055, 21937 and 21815. Below 21815 closing Bears take total control of the market. Nifty is interestingly placed with shadow of the candle being neutral and it was a Doji candle that we saw today emphasizing the tussle between bulls and bears or shall we call it a tussle between FIIs and DIIs + Retail investors?

BANKNIFTY BUY BANKNIFTY GO FOR LONG
Trade reason :
1)Day time strong uptrend & travel with Channel pattern
2)Strong Level Bottom Support - 47000 level
3)1 Hr time frame Makes HH . Entry confirmation
Entry - 48100
Target 1 -49000
Target 2 - Channel Top . New Highs Possible
Stop - 47300
Thank you ... Happy trading

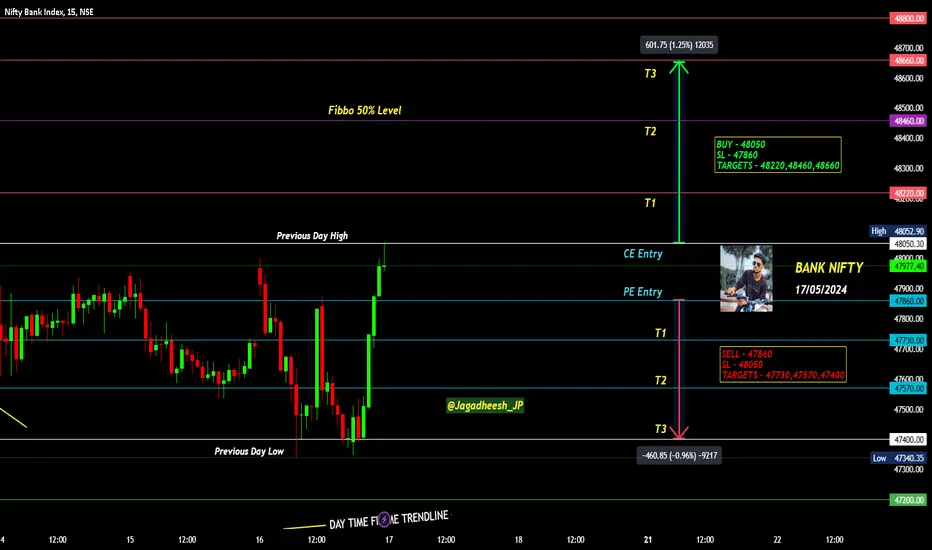
BANK NIFTY INTRADAY LEVELS FOR 17 MAY 2024BUY ABOVE - 48050
SL - 47860
TARGETS - 48220,48460,48660
SELL BELOW - 47860
SL - 48050
TARGETS - 47730,47570,47400
NO TRADE ZONE - 47860 to 48050
Previous Day High - 48050
Previous Day Low - 47400
Based on price action major support & resistance's are here, the red lines acts as resistances, the green lines acts as supports. If the price breaks the support/resistance, it will move to the next support/resistance line. White lines indicates previous day high & low, high acts as a resistance & low acts as a support for next day.
Trendlines are also significant to price action. If the price is above/below the trendlines, can expect an UP/DOWN with aggressive move.
Please NOTE: this levels are for intraday trading only.
Disclaimer - All information on this page is for educational purposes only,
we are not SEBI Registered, Please consult a SEBI registered financial advisor for your financial matters before investing And taking any decision. We are not responsible for any profit/loss you made.
Request your support and engagement by liking and commenting & follow to provide encouragement
HAPPY TRADING 👍
This analysis and strategy looks good!Dow Jones (US30) has reacted off the pivot and could potentially drop to the 1st support.
Pivot: 39,993.29
1st Support: 39,637.89
1st Resistance: 40,530.41

VIX TrajectoriesFor the VIX we are in load up zone, whether for speculation or hedging.
I've mentioned before I think 12-12.50s come with bounces to 18-19 until we get the next rate reduction that pushes us towards sub $12, that's been my bias, next leg down could be it but i assign the following:
85% probability $12 holds we go to $17/$18
10% we dip to $10-$11
5% something in the middle.

Will it continue to rise? Maybe I'll tell you the answerOn the chart, the bearish trend is expected to reach 5280 and 5266 if the price remains below the pivot point of 5300. However, if a break above 5,300 is confirmed by a 4-hour candle close above that level, it could target higher levels 5311, 5328 and then 5345.
Key level:
Pivot line :5300
Bullish line :5311, 5328, 5345
Bearish line :5280, 5266, 5220

A correction to 420-450, then up to 647I´m expecting NAS to fall to 430-460 level and after a rejection will reach 647 (not sure if today). If you decide to enter, wait for rejection, do not FOMO. I will try to update this idea when-if entry conditions are met. Not quaranted here. WIsh you a good luck.

DOLLAR BULLISH???!!!!! Dollar retested from the Day Trendline1.According to my view dollar reached its Target and retested from Day Trendline Liquidity and the Support Zone.
2.If its broke the Resistance and upper Trendline then it'll reach the major resistance zone.
3.If Dollar broke the current support zone then it'll reach the next support around 103.000.
4.Day 200 EMA retested well.

DXY----Bearish Before Trend is Making Lower low and Lower High and there is Divergence Came In H1
there is Completion of ABCD pattern Now Trend is Making Higher and higher low and Trend take Retracement from Fib 0.6 level .There is completion of ABCD pattern


DXY is weakening after soft CPI dataHey Traders, in today's trading session we are monitoring DXY for a selling opportunity around 105.100 zone, DXY is trading in a downtrend and currently is in a correction phase in which it approaching the trend at 105.100 support and resistance area.
Fundamentally the recent CPI data was quiet soft and didn't exceed 0.3.
Trade safe, Joe.

US 30 short - scalp trade We've taken the both the buyside and the sellside of the range so let's see where the market wants to go from here.
Taken a short scalp from 39929 before we ran the highs, trapped the bulls and went for the HTF sellside.
Entry 39929
TP 39915
SL 39937
Noted the FVG gap (red box) so watch how we react from here for the end of the trading session
Don't CHASE the market and HURT yourself. Let it comes to you and let it SHOW YOU ITS HAND.
Hope you guys had a nice week and enjoyed it to the fullest. Hope you guys had a good trading week as well and whatever your bottom line for the week...next week is a new week so KEEP IT UP. RISK MANAGEMENT IS THE WAY TO GO
Stay safe and never risk more than 1-5% of your capital per trade. The following analysis is merely a price action based analysis and does not constitute financial advice in any form.

NDX | IT SECTOR MAY FLY ???Another indicator on if things go well with the breakout, we may see good momentum in Indian IT Sector. Although until that happens, the price can always reverse. So a little patience might pay well.

Predicted Closing for Nifty 50 spot price. If today's high doesn't change 22490.80078 then the close Price for today: 22431.5628297807 predicted.

DAX may threaten breakout pointIntraday Update: After hitting the 127% extension this week, the German DAX may be at risk of testing the breakout point at 18568 which traders will be watching for a close above/below for the week.

NIFTY INTRADAY LEVELS FOR 17 MAY 2024BUY ABOVE - 22420
SL - 22350
TARGETS - 22470,22510,22550
SELL BELOW - 22350
SL - 22300
TARGETS - 22300,22230,22160
NO TRADE ZONE - 22350 to 22420
Previous Day High - 22420
Previous Day Low - 22060
Based on price action major support & resistance's are here, the red lines acts as resistances, the green lines acts as supports. If the price breaks the support/resistance, it will move to the next support/resistance line. White lines indicates previous day high & low, high acts as a resistance & low acts as a support for next day.
Trendlines are also significant to price action. If the price is above/below the trendlines, can expect an UP/DOWN with aggressive move.
Please NOTE: this levels are for intraday trading only.
Disclaimer - All information on this page is for educational purposes only,
we are not SEBI Registered, Please consult a SEBI registered financial advisor for your financial matters before investing And taking any decision. We are not responsible for any profit/loss you made.
Request your support and engagement by liking and commenting & follow to provide encouragement
HAPPY TRADING 👍

#NIFTY Intraday Support and Resistance Levels -17/05/2024Nifty will be gap up opening in today's session. After opening nifty sustain above 22420 level and then possible upside rally up to 22540 level in today's session. in case nifty trades below 22370 level then the downside target can go up to the 22250 level.

US30 Correction into MOONJust read the bearish divergence as temporary, backed by the US Federal Reserve's careful management of interest rates, US30 to the MOOOOOOOOON!
COVID 4 year bull flag to the infinite upside USA USA USA USA
LOVE,
dysonring2050

Potential bearish drop?Dow Jones (US30) has reacted off the pivot and could potentially drop to the 1st support.
Pivot: 39,993.29
1st Support: 39,637.89
1st Resistance: 40,530.41
Risk Warning:
Trading Forex and CFDs carries a high level of risk to your capital and you should only trade with money you can afford to lose. Trading Forex and CFDs may not be suitable for all investors, so please ensure that you fully understand the risks involved and seek independent advice if necessary.
Disclaimer:
The above opinions given constitute general market commentary, and do not constitute the opinion or advice of IC Markets or any form of personal or investment advice.
Any opinions, news, research, analyses, prices, other information, or links to third-party sites contained on this website are provided on an "as-is" basis, are intended only to be informative, is not an advice nor a recommendation, nor research, or a record of our trading prices, or an offer of, or solicitation for a transaction in any financial instrument and thus should not be treated as such. The information provided does not involve any specific investment objectives, financial situation and needs of any specific person who may receive it. Please be aware, that past performance is not a reliable indicator of future performance and/or results. Past Performance or Forward-looking scenarios based upon the reasonable beliefs of the third-party provider are not a guarantee of future performance. Actual results may differ materially from those anticipated in forward-looking or past performance statements. IC Markets makes no representation or warranty and assumes no liability as to the accuracy or completeness of the information provided, nor any loss arising from any investment based on a recommendation, forecast or any information supplied by any third-party.


BANKNIFTY Trading Plan: May 17th, 2024 - Optimizing Entry and Ex
Market Outlook: This plan outlines potential trading strategies for BANKNIFTY on May 17th, focusing on optimal entry and exit points based on various opening scenarios.
Trading Strategies:
Gap Up Opening:
Entry: If BANKNIFTY opens above 48050 and finds support at 47976, consider a long trade.
Target 1: 48127 (potential sideways movement after initial rise).
Target 2: A breakout above 48127 might propel prices towards 48333-48438.
Profit Taking: Book profits within the 48333-48438 range, as this may indicate resistance. Consider entering a short trade here.
Contingency: If support at 47976 weakens, expect a retracement.
Support Levels: Look for a buying opportunity at 47817-47673. Utilize a stop-loss (SL) order at 47600 to manage risk.
Flat Opening:
Entry: Initiate a long trade with support at 47817.
Initial Target: Aim for the initial range of 48024-48127.
Further Movement: Prices exceeding 48150 could reach 48333-48438.
Short Recommendation: No short positions are recommended for this scenario.
Gap Down Opening:
Entry: If BANKNIFTY opens below 47800, identify a buying opportunity near 47700.
Stop-Loss (SL): Place a stop-loss order at 47672 to manage risk.
Target: Look for price recovery towards 47976-48024-48127.
Conclusion:
This plan prioritizes buying opportunities across different opening scenarios. Leverage support levels to manage risk and consider profit-taking when prices reach potential resistance zones. Remember, this is a guide, and market conditions can change rapidly. Adapt your strategy based on your risk tolerance and real-time market analysis.
Disclaimer: This information is for educational purposes only and should not be considered financial advice. Please consult with a qualified financial professional before making any investment decisions. Always consider your personal financial goals and conduct thorough analysis before executing trades.

2024-05-16 - a daily price action after hour update - dax/Good Evening and I hope you are well.
overall market comment
Bulls rallied to another ath where many of them took profits and bears began shorting after a lower high. The selling on bigger volume into the close is a sell signal going into tomorrow. Bulls have to break out of the formed bear channels to make bears doubt the highs might be in. Since tomorrow is Opex, everyone is max bullish and VIX is at the lows, we could be in for a surprise tomorrow.
dax
comment: Bear trend from before the open, after Globex made a new ath 19006. Since it’s the end of the week, the open, low and high prices of the week are important to watch. I always mark them on my charts when they occur.
current market cycle: trading range - bulls broke 19000 but no follow through, if we close this week below 18900, we got a higher high but inside a trading range and odds favor that we trade down to 18000 again.
key levels: 18738 - 19006
bull case: Bulls began to take profits and today’s selling was without any stop which makes me believe that big institutions are off-loading their positions while they can. Low of the week was 18738 and that should be bulls last hope for tomorrow. If they can not hold that level, we probably trade down to 18600 and below that is 18400.
bear case: Bears created a sell signal on the daily chart going into tomorrow. The weekly and monthly charts now show big tails above and if we can close below 18900, that would be a second rejection of that level on the weekly chart. Last time we made a new ath we sold off for 1280 points so that is my base assumption for the next weeks.
short term: Bearish - But can see a retest of the highs if bulls break strongly above the 1h 20ema tomorrow. 18738 must hold or we could crash down.
medium-long term: My long term outlook stays bearish and I expect at least a -20% correction in 2024. Medium term is 17100 while I think we can touch the big bull trend line starting 2022-10 around 16700 in 2024. —unchanged
trade of the day: EU open could not get a close above the 15m 20ema and had many tails above bars. Could have sold anywhere with stop new ath.
