Potential outside week and bearish potential for TLXEntry conditions:
(i) lower share price for ASX:TLX below the level of the potential outside week noted on 2nd June (i.e.: below the level of $24.91).
Stop loss for the trade would be:
(i) above the high of the outside week on 5th June (i.e.: above $27.40), should the trade activate.
Important note for the trade:
- Observe market reaction at two key areas illustrated in the chart above, should the trade activate ($24.79 and $24.47), which could act as support against the short trade.

Rare Earth battle shifts gearsMP is flying after hours after the DoD pledged a $1bn of support. Lynas doesn’t have the same upside potential but looks like it’s ready to complete the bull flag pattern. A very strong looking chart, not financial advice but I like what I see here.
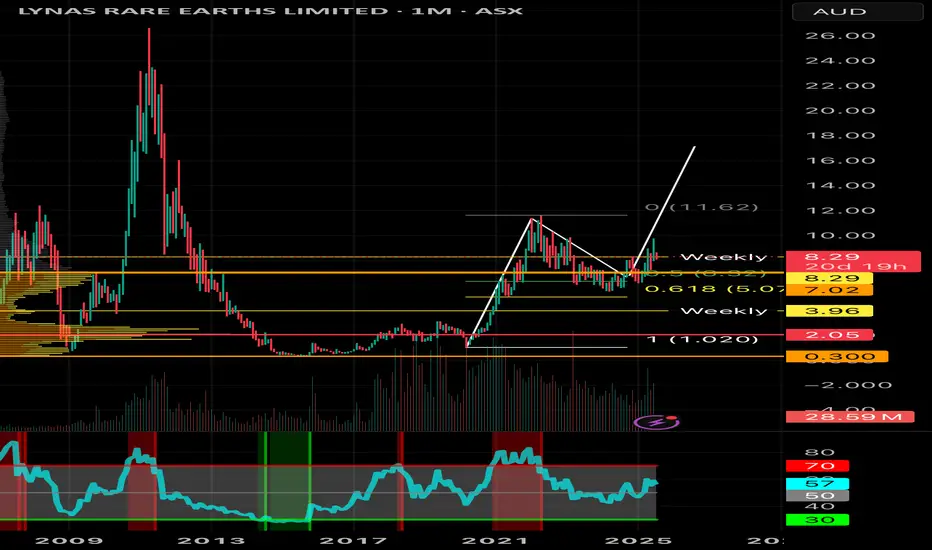
Going into Wave 4 for a predicted shallow retracement Going into Wave 4 for a predicted shallow retracement before wave 5 extending to 0.618 past wave 3 top (@$5.18)

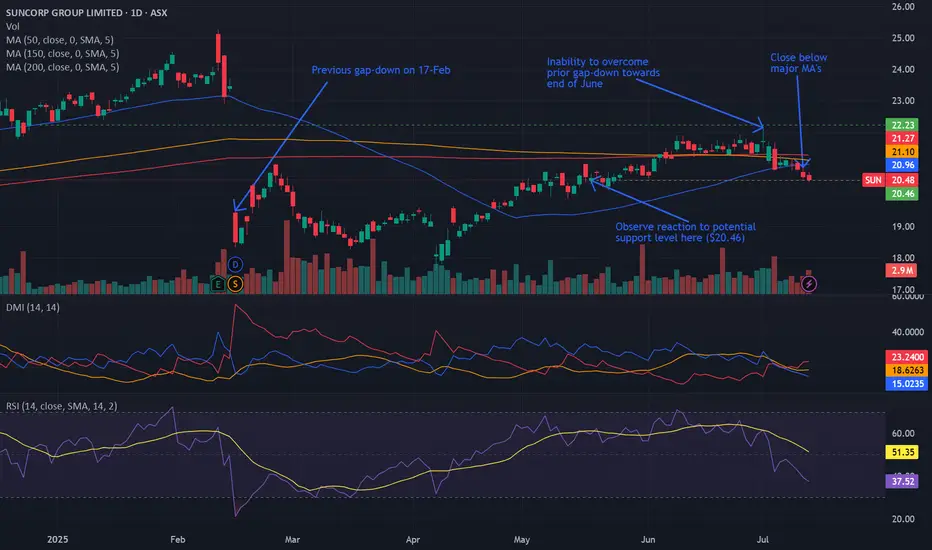
Bearish potential detected for SUNEntry conditions:
(i) lower share price for ASX:SUN along with swing of DMI indicator towards bearishness and RSI downwards, and
(ii) observing market reaction around the share price of $20.46 (open of 19th May).
Stop loss for the trade would be:
(i) above the potential prior resistance of $21.36 from the open of 5th June, or
(i) above the high of the recent swing high once the trade is activated (currently $22.14 from the high of 1st July), depending on risk tolerance.
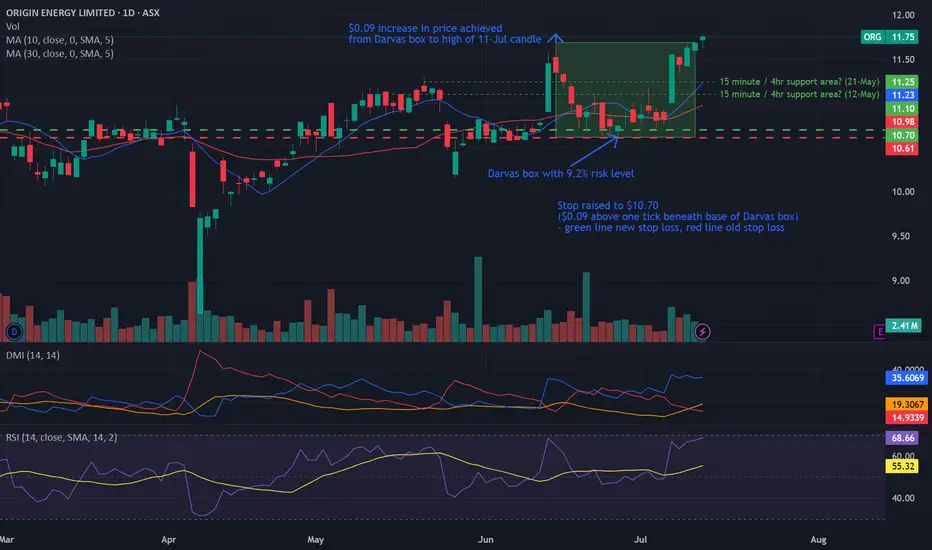
Bullish potential detected for ORGEntry conditions:
(i) breach of the upper confines of the Darvas box formation for ASX:ORG
- i.e.: above high of $11.69 of 16th June (most conservative entry), and
(ii) swing up of indicators such as DMI/RSI.
Stop loss for the trade (based upon the Darvas box formation) would be:
(i) below the support level from the low of 26th June (i.e.: below $10.62).
How to Use TradingView Alerts to Catch Momentum Shifts Here’s a quick video on setting alerts in TradingView.
I use alerts for stocks I’m interested in but want to give more time to set up. Instead of using a basic price alert, I prefer setting alerts on MACD crossovers to signal when momentum is shifting back in my favor. As a rule of thumb, the deeper the crossover, the better the value and potential momentum. Crossovers below the MACD zero line are particularly useful, especially for stocks that had strong momentum and were making new highs before pulling back.
This approach helps confirm that the stock has had time to build a solid base before I enter. TradingView will then send me an email alert or play a chime if I have it open, letting me track multiple stocks and setups without constantly checking charts. It’s also great for monitoring take-profit and stop-loss levels.
You can apply the same strategy with nearly any indicator on TradingView to time your entries and exits with more confidence.

Ramelius Resources (ASX: RMS) –A Tactical Re-Entry Zone?🟡 Gold-Linked Opportunity: Ramelius Resources (ASX: RMS) – A Tactical Re-Entry Zone?
Context: Ramelius Resources, a mid-tier Aussie gold producer, is showing signs of technical exhaustion after a strong rally from its 2024 lows. With gold prices consolidating and RMS pulling back to a key support zone, this could be a tactical opportunity for shareholders and swing traders alike.
📊 Technical Snapshot:
Current Price: $2.47
Trendline Support: The long-term ascending trendline remains intact, offering a potential re-entry zone for bulls.
Risk-Reward Setup: Defined green/red zones highlight a favorable R:R ratio for those targeting a rebound toward $2.80–$3.00.
🪙 Gold Correlation Insight:
The inset chart shows gold (XAU/USD) stabilizing after a volatile June. If gold resumes its uptrend, RMS could follow suit, given its strong correlation with bullion prices.
🧠 Psychological Angle:
After a 40%+ rally from the $1.78 low, some profit-taking is natural. But this pullback may shake out weak hands before a continuation move.
Watch for sentiment shifts around gold and broader risk appetite—these could be catalysts for RMS’s next leg.
#RMS #Gold #ASX #MJTrading #Forex #Trading #Investment

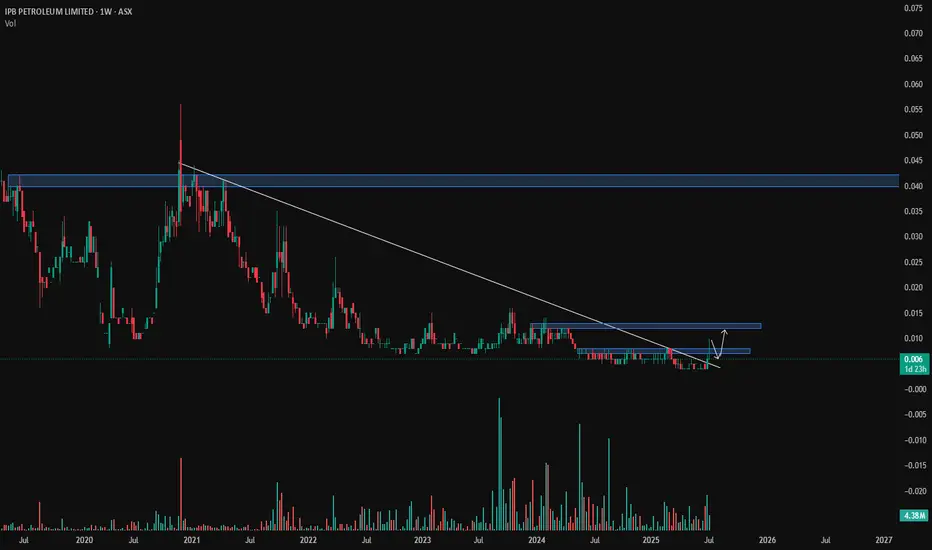
IPB - volume breakout LONGBroken out of 2 year trend on volume now looking to backtest area.
Awaiting news
AMP(ASX) Monthly ChartDoubling up on my prior post,
The quarterly and the monthly chart both have the same 2618 pattern present
If today closes where it is we will have the same bullish pattern on 2x timeframes both with bullish hammer patterns present

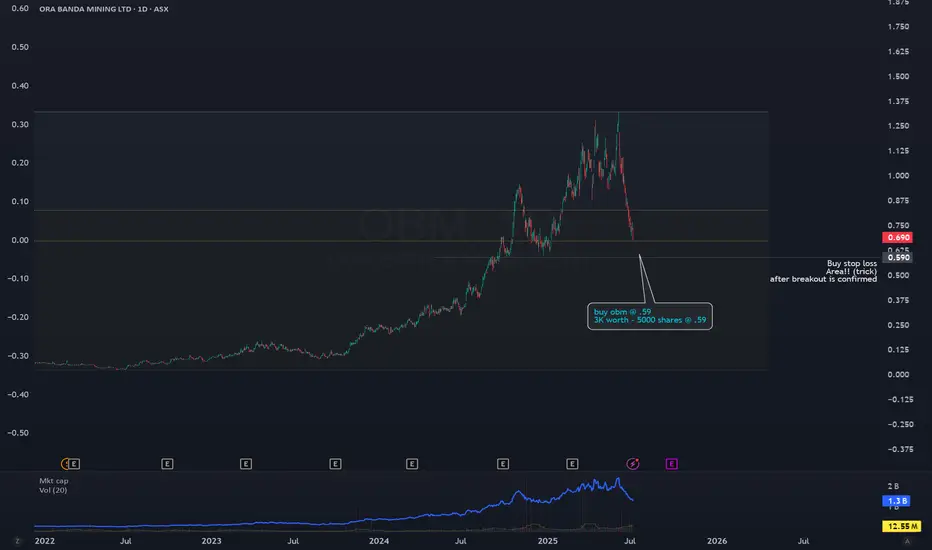
buying a pull backOBM explorer has had a nice run and now has pulled
back which gives us the opportunity to make an entry
.59 looks supportive and I will buy some there.
Currently price holding at 50% fibonacci level
which means it could bounce from this area.
Potential outside week and bullish potential for CNIEntry conditions:
(i) higher share price for ASX:CNI above the level of the potential outside week noted on 4th July (i.e.: above the level of $1.795).
Stop loss for the trade would be:
(i) below the low of the outside week on 30th June (i.e.: below $1.655), should the trade activate.

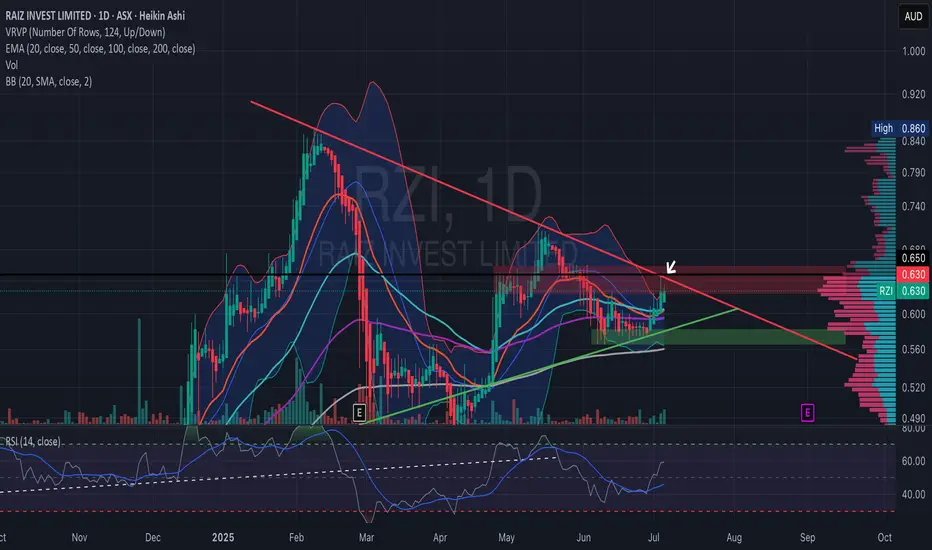
RZI Bullish BreakoutThe price is currently testing resistance around 0.63, after rising from 0.575. The volume profile indicates high activity around 0.58-0.62, showing strong interest.
The EMAs reflect a bullish shift, with the 20 EMA approaching a crossover above the 50 EMA.
After a period of squeeze inside the triangle, the bands are beginning to open.
The RSI is neutral to bullish, trending upward around 50. Overall, the chart suggests a potential breakout. No clear over-bought yet, there is room to run if bulls stay in control.
Key Scenarios
Bullish Breakout: A daily close above the red trendline + A$0.63–0.65 resistance zone would confirm.
First target: A$0.70–0.72 (next volume-profile “valley” and previous swing highs)
Secondary: A$0.80+ (upper Bollinger band confluence from the Feb top)
False Break / Rejection:
Look for a swift pullback into the green ascending line (~A$0.60) or the broader support box around A$0.57–0.58.
Watch EMAs for signs of rolling over (20 EMA crossing back below 50 EMA would turn neutral-to-bearish).
Bullish potential detected for TLCEntry conditions:
(i) higher share price for ASX:TLC along with swing up of the DMI indicators and swing up of the RSI indicator, and
(ii) observation of market reaction at the support/resistance level at $5.31 (from the open of 12th May).
Stop loss for the trade would be, dependent of risk tolerance (once the trade is activated):
(i) below the support level from the open of 21st November (i.e.: below $5.05), or
(ii) below the recent swing low of 3rd June (i.e.: below $4.96).

Potential outside week and bullish potential for CXOEntry conditions:
(i) higher share price for ASX:CXO above the level of the potential outside week noted on 27th June (i.e.: above the level of $0.1025).
Stop loss for the trade would be:
(i) below the low of the outside week on 20th June (i.e.: below $0.083), should the trade activate.

Potential outside week and bullish potential for PRNEntry conditions:
(i) higher share price for ASX:PRN above the level of the potential outside week noted on 2nd May (i.e.: above the level of $1.38).
Stop loss for the trade would be:
(i) below the low of the outside week on 28th April (i.e.: below $1.29), should the trade activate.

Trade Idea: WES.ASX – VCP Breakout Play (Buy Setup)🔹 Entry:
✅ Bought @ $85.45
📍 VCP-style setup with tight consolidation above 21EMA/50MA
📈 Early signs of breakout with volume confirmation
🔹 Stop Loss:
🚨 Initial Stop @ $81.56 (Below supertrend support)
⚖️ Risk defined at ~4.6% from entry
🔹 Target Zones:
🎯 T1: $89.30 (1R)
🎯 T2: $91.80–92.50 (2R zone & prior resistance extension)
🔹 Technical Notes:
• Strong uptrend intact
• Supertrend, 21EMA, and 50MA all stacked bullish
• Recent consolidation near highs = strength
• Clean structure with volume dry-up prior to breakout
• RSI holding above 50, MACD positive crossover
🔹 Trade Management Plan:
• Take partial profits at +1R (~$89.30)
• Move stop to breakeven after 1R achieved
• Trail remainder using short-term moving average or price structure
🧠 Context:
WES shows strong leadership within ASX discretionary retail. This breakout could signal the next leg higher if volume expands and price holds above $85.60–86.00.
🔔 Watching for breakout continuation above $86.50 with strength.
DISCLAIMER : The content and materials featured are for your information and education only and are not attended to address your particular personal requirements. The information does not constitute financial advice or recommendation and should not be considered as such. Risk Management is Your Shield! Always prioritise risk management. It’s your best defence against losses.

FMG long setups buy now target to break previous top!!Hey people,
FMG has completed a running flat, all buy setups are now viable, purchase when entry critierias are met

STP SHPRT M,EDIUM LONGER TERM LIKELY STARTING POINTHey people,
Weekly setup, buys, likely beginning of impulse to the upside

Proteomics International Laboratories LtdProteomics International Laboratories Ltd receives approval for the world first patent for a proprietary blood test innovation for early detection of endometriosis, as the stock price reaches the control point and the bottom of the descending channel.

Proteomics International Laboratories LtdProteomics International Laboratories Ltd receives approval for the world first patent for a proprietary blood test innovation for early detection of endometriosis, as the stock price reaches the control point and the bottom of the descending channel.

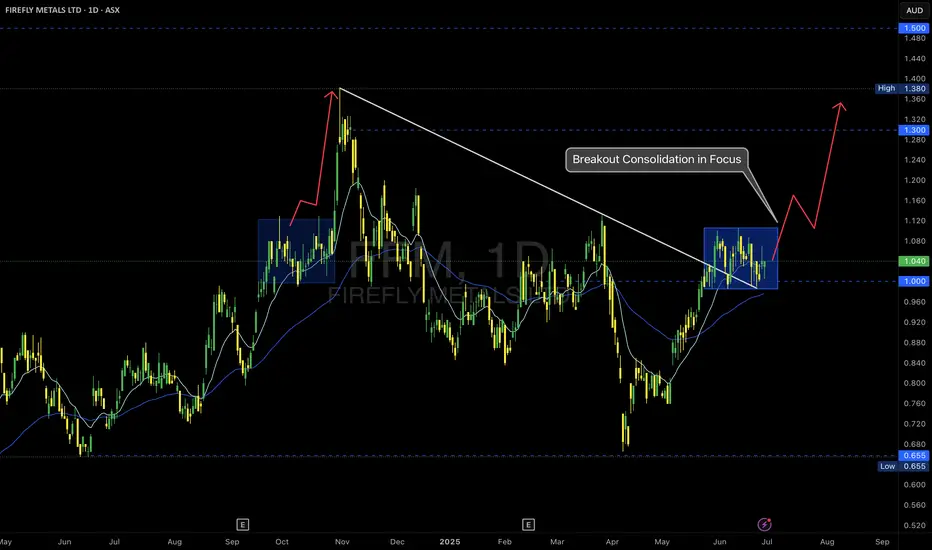
FFM -- ASX – Breakout Consolidation in Focus
📝 Description
Firefly Metals is setting up a classic breakout continuation scenario after reclaiming the $1.00 psychological level and breaking the long-term trendline resistance.
🔹 Key Observations:
• Trendline Break: The descending trendline from the prior high was decisively breached, signaling a structural shift.
• Accumulation Zone: Price has consolidated in a tight range above $1.00, forming a bullish flag or box accumulation.
• EMA Cluster Support: Both the 15 and 60 EMAs are aligned below the consolidation, providing dynamic support.
🔹 Potential Scenarios:
✅ Bullish Continuation:
A clean breakout above the top of the blue box could trigger a momentum rally toward $1.30 and ultimately the $1.38–$1.50 resistance levels.
✅ Deeper Pullback:
If price loses the $1.00 support decisively, a retracement to retest the breakout base is possible.
Trade Plan:
I am monitoring for a confirmed breakout candle with volume expansion to validate the continuation thesis.
• Entry trigger above the range high ($1.10 area)
• Stops below recent swing low / $1.00 level
• First target: $1.30 resistance
As always, risk management first—no breakout, no trade.
#MJTrading
#FFM #FireflyMetals #ASXTrading #BreakoutSetup #TechnicalAnalysis #PriceAction #TradingPlan #ChartOfTheDay #AustralianStocks #MomentumTrading #MJTrading
Bearish potential detected for AGLEntry conditions:
(i) breach of the lower confines of the Darvas box formation for ASX:AGL
- i.e.: below low of $9.84 of 7th April, and
(ii) swing increased bearishness of indicators such as DMI/RSI along with a test of prior level of support of $10.02 from 11th March.
Stop loss for the trade (based upon the Darvas box formation) would be:
(i) above the high of 10th April (i.e.: above $10.89), or
(ii) above the prior support level from the open of 10th January (i.e.: above $11.15), depending on risk tolerance.
