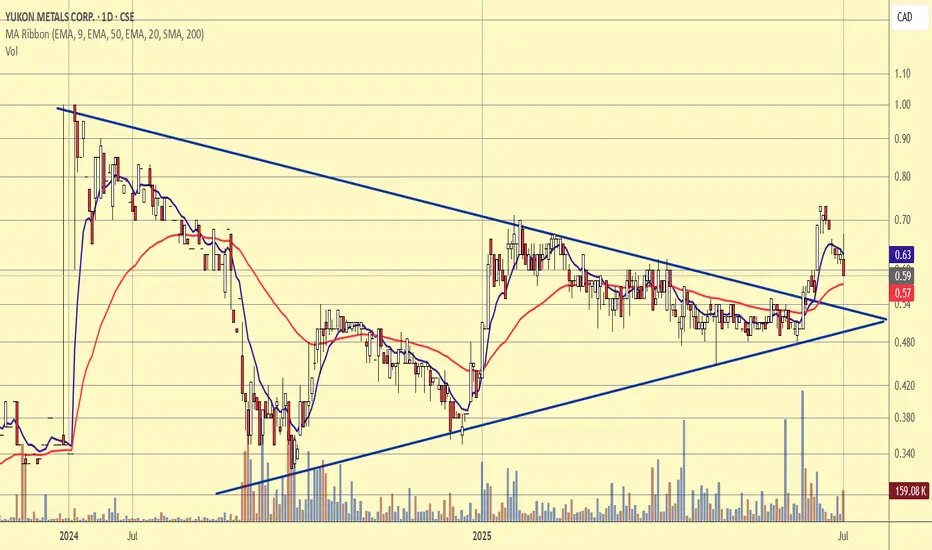
Ascending Triangle With Breakout Incoming?📈 Ascending Triangle formation (bullish)
🔥 MACD crossover above signal line, bullish momentum gaining
✅ RSI at 61, showing strength but not overbought
📊 Watching for volume confirmation on breakout
Plan: Wait for daily close or strong intraday breakout above 160. If it confirms, this could be a strong swing setup. Watching closely!

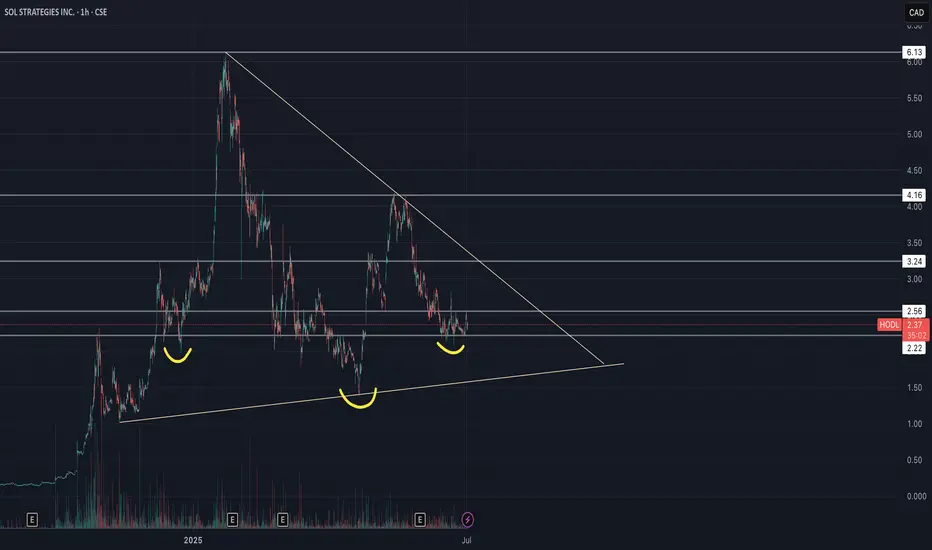
Sol Strategies Inc (HODL) - Inverse H&S🚀 SOL Strategies (HODL) – Public Market Gateway to Solana Yield
SOL Strategies (CSE: HODL) is a publicly traded company laser-focused on the Solana ecosystem. With nearly 395,000 SOL held (most of it staked) and over 3.7 million SOL delegated to their validators, they generate consistent income through staking rewards and validator commissions.
Their business model is simple:
📌 Accumulate SOL → Stake it → Run institutional-grade validators → Earn yield
📌 Expand through partnerships (3iQ, Neptune, BitGo, Pudgy Penguins)
📌 Hold strategic Solana ecosystem tokens like JTO and jitoSOL
📌 Operate with SOC 2-certified infrastructure and pursue a Nasdaq listing
SOL Strategies is not just holding crypto – they are building core infrastructure for Solana, giving equity investors direct exposure to staking economics in one of the fastest-growing blockchain networks.
📊 For traders: HODL stock offers a pure-play vehicle for Solana exposure, with an income-generating twist.
⚠️ Always do your own investment research and make your own decisions before investing.
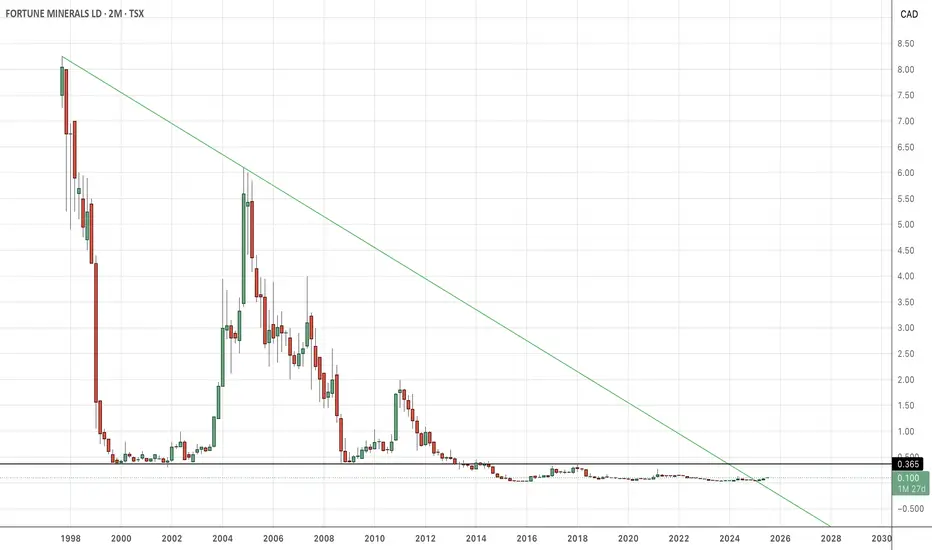
Fortune MineralsAnd here she is in log.
With OBV rising, the $.25USD pivot is in the headlights, but that's just the first step. We have a higher swing high on the dailies, but that does not make FT bullish. You need a higher-swing-high on the weeklies or a longer timeframe. So, the pump to $.25 is the pump before the pump. It's kind of like the dip behind the dip, but in reverse.
I'll see you at $2.
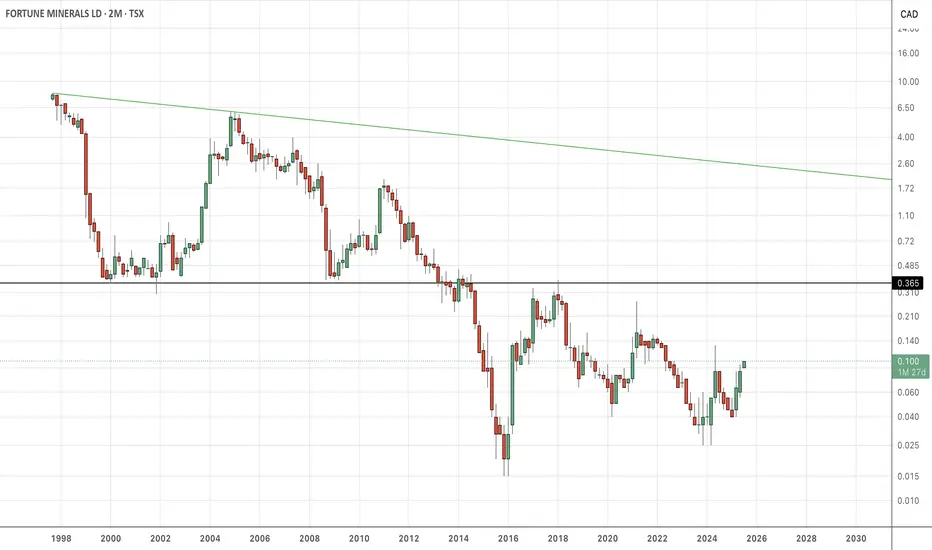
FortuneHere's the linear overhead in the rear-view mirror. The old rules no longer apply. New rules are no resistance until a twenty-five cent pivot, but really no resistance until it hits the Log overhead at $2. You think it's not going to go for $2? Watch.
BBD.B Update idea after splitLONG LONG LONG ! Company have a very good future. The company sold the part that produced the trains. And she concentrated all her attention on the production of business jets. Technically, the company's shares look very cool. We tried to hide the technical specifications behind the split, but I have an old graph in my head.)))

Long Kraken Robotics PNG.V as Wave 5 unfoldsHere triangle is going to end its formation very soon and a break to the upside is expected to unfold the green wave 5.
Triangle is a type of correction that always precedes the final movement in the larger trend.
If assume that wave 5 will be the same length (as waves 1 and 3 are equal in length), the price will go above 6 CAD.

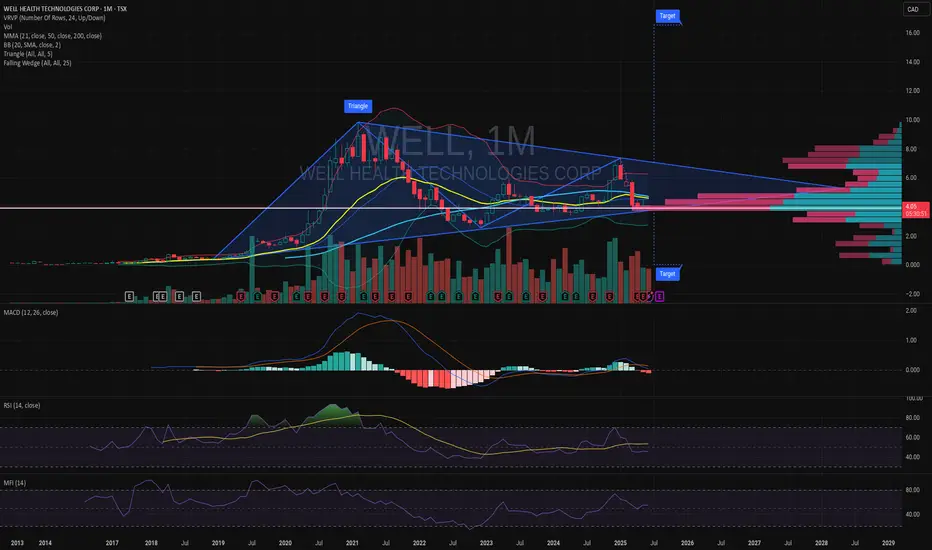
$WELL I like Well I think they have growth Potential.So I like the NYSE:WELL health, as a service I believe there is a need for this in Canada.
So depending on their growth model and expansion I hope to see this grow in value.
I have some of this.
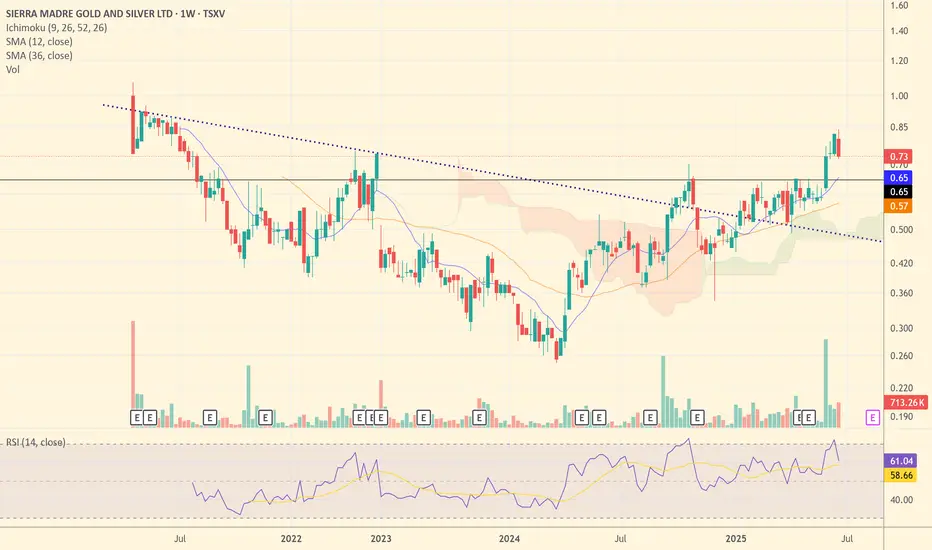
SM: Poised for Silver Alpha? - A Producer's Growth StorySierra Madre Gold and Silver (TSXV: SM) is shaping up to be a prime candidate for significant upside in a rising silver market. Having recently transitioned to commercial production and achieved positive cash flow in Q1 2025, SM has moved past the riskiest development hurdles and is now firmly in the "Production & Growth" phase of the Lassonde Curve.
Why SM Stands Out for Potential Upside:
- Operational Momentum: In Q1 2025, SM achieved positive cash flow with sales of 165,000 ounces of silver equivalent (AgEq), a critical milestone that validates the Guitarra project's viability.
- Improving Cost Structure: All-in Sustaining Costs (AISC) have been brought down to approximately $29/ounce AgEq. This efficiency directly translates to expanded margins as silver prices climb.
- Exponential Leverage to Silver Price: At a $40/ounce silver price scenario, SM's margin would jump to over $11/ounce AgEq. This significant increase in profitability is a powerful catalyst for share price appreciation, generating robust free cash flow for reinvestment.
- Clear Growth Catalysts: The company has ambitious plans to optimize operations, implement new flotation systems, and expand mill capacity to 1,200-1,500 tonnes per day. This could boost annual production to 2.5-3 million ounces of silver, creating substantial organic growth.
- Supportive Environment: A observed positive shift in the Mexican regulatory environment towards mining further enhances investment appeal.
Technical Analysis Snapshot:
SM's chart shows promising technical signs. After a period of consolidation (akin to a "valley" in the Lassonde Curve), the stock has recently experienced a breakout above a long-term downtrend line, signaling a potential shift from bearish to bullish sentiment. Volume accompanying this breakout is crucial for conviction. The stock appears to be establishing new support levels, indicating a potential accumulation phase. Investors should monitor for sustained trading above key moving averages and continued volume confirmation as indicators of a strengthening trend.
Risk-Reward Profile:
- Risk Profile: Medium to High (as a new, smaller producer with expansion execution risks)
- Potential Return at $40 Ag: Very High (due to dramatic profitability increase and accelerated growth)
Conclusion:
Sierra Madre Gold and Silver is well-positioned to capitalize on a bullish silver market. Its proven production, cost efficiency, and clear expansion roadmap make it a compelling candidate for significant price appreciation as silver prices head towards $40/ounce. For investors seeking "alpha" with a calculated approach to risk, SM offers a compelling growth story.
Patent PricingA small stock with a market value of about $6 million has managed to get its patent rights for more than double that price.
Tp1,Tp2

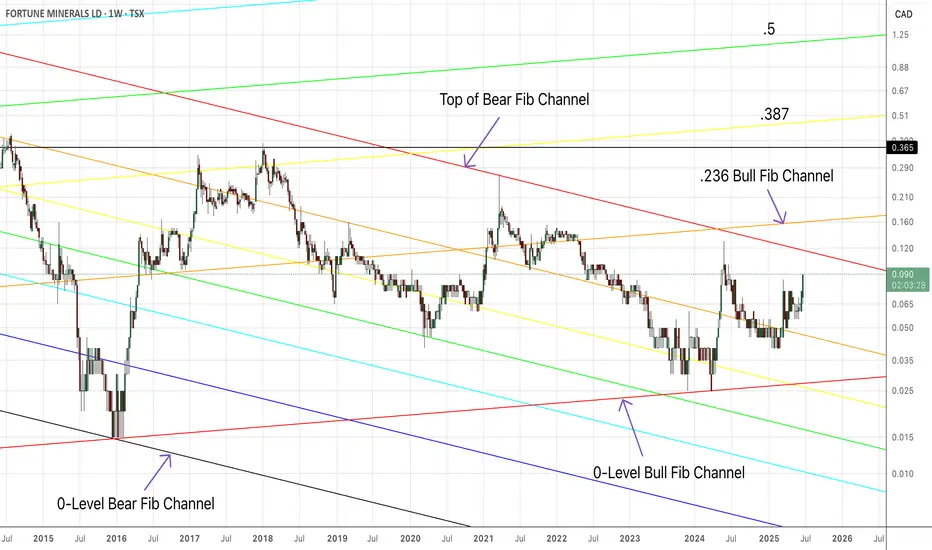
Fortune MineralsHi guys,
I want to show the technical landscape that FT price finds itself in. I talk a lot about this fib and that fib, but I hope this clarifies things. As I've said before, above the .236 bull fib, it's bullish. That is the major threshold where new market participants come into the picture, and real volume enters. Down below the .236 bull fib is high-risk, high reward zone. So, consider yourself early to the party.

FLT - Long Term VisionOne of my favourite stocks. Looking at this, I am taking a 3-5 year outlook. It seems the company has been on a mission to grow and generate income. I wouldn't be surprised to see a Government contract get signed. (US or Canada) Would love to see them on the TSX. Eventual long term vision is a $10 stock while I attempt to accumulate shares at each of my targets. Would love to hear other opinions on this. This is my NVDA/Amazon over the next 20 years.

Silver X Mining: Grinding it outThis stock is still resting, and I think waiting for Silver to make it's move to $50 first. Until then, this will continue to grind sideways to lower. There's a lot to clear first.

Mineros will flyHere could be a nice entry point. Gold continues to rise as it possibly in the mid of wave 3 of Cycle III.
Fundamentally, the company is hugely undervalued compared to other gold producers which possibly might be attributed to Colombia. Good management execution and recent interest from semi-big houses are nice and supportive.

Lion One Metals, Just in production 4000 oz/quarter SOLID 2.00Lion One Metals, Just in production 4000 oz/quarter SOLID 2.00
Solid target from 0.3 to 2 !

FTThe price is above the moving averages, and the moving averages are all stacked bullish. The situation is a royal flush from a technical perspective. You have these long-standing overheads, with the key linear overhead having already been breached. In Log, we still have the 1-level "bear fib" to clear and then land on top of. Once that lifts off, we run into the .236 "bull Fib" (which I have hidden for simplicity). After we clear the .236 bull fib, it means we are truly bullish in FT for the first time in the chart history. Then come's the $.38CAN level, and higher. It in the states here, I'm looking for $2.
This is the first time the price has come to be supported by the moving averages. First time in chart history. The Bollinger Bands are widening. The OBV is near record high levels. All hell is about to break lose.

ERNERGY FUELS TAKE OFFhello, fine ? Me yes, Tahnks god, for the emperor.
Commodities is the next bullrun.
Energy will rise, energy is absolute.
BIG H&S inverted. Target 57 dollars and more. x7 to here.
When enter ? When white line is break.
Look RSI indicator at the bottom. bullish confirmation when Monthly RSI is break

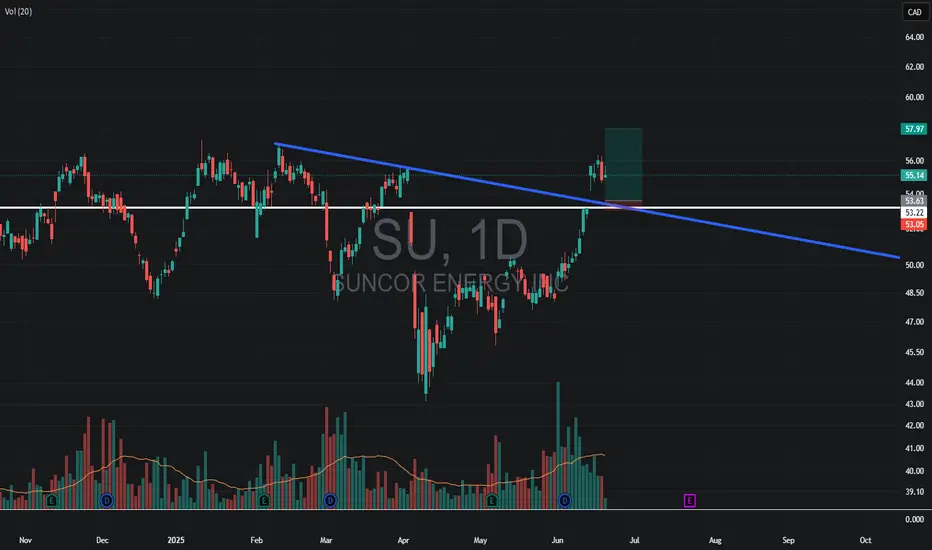
SU on WatchWatching for a pull back
Why:
Gap fill
The price to close the gap lines up with upper channel
Above average green volume on the uptrend
Zac will explode WHEN above 10 cents. If silver explodes above $40 dollars, Zac should explode above 10 cents. If so, 28 cents can be reached.

NDA 1.1 -0.8 BUY TRAGET - INVALIDATION 0/.65Correction in progress. Buy targets 1.1 - 0.8. INVALIDAITON if close weekly below 0.65
TP target : 3.9 5.6 8.4
Gael, for Yahia

***Technical Analysis of the GOLDEN NUGGET TMX Group Limited (X)Fundamental and Technical Analysis of TMX Group Limited (X) 🚀
Fundamental Analysis 🚀
TMX Group Limited, the operator of the Toronto and Montréal stock exchanges, is a key player in the Canadian financial sector. Its role in managing equity markets and derivatives trading positions it strategically, supported by steady growth and a diversified range of services.
Recent financial reports highlight increasing trading volumes, especially in derivatives, reflecting growing investor interest. The company continues to show strong organic growth, with rising revenues and an expansion of its business, particularly through its VettaFi division.
Technical Analysis 🚀
The technical chart for TMX Group reveals a solid upward trend, with a current price of 56.16 CAD and sustained growth momentum. Technical indicators show a positive outlook, with upward-moving averages and increasing trading volume.
- Target Sell Price: 63 CAD – This level represents a realistic target based on historical trends and growth projections. A breakout above this point could signal further appreciation.
- Key Support: Previous support levels have demonstrated strong demand, potentially offering buying opportunities in case of a temporary pullback.
Conclusion 🚀
TMX Group Limited presents strong fundamentals and technical indicators. With a 63 CAD target sell price, investors can monitor market signals to optimize their strategy. Revenue growth and business expansion reinforce confidence in the stock’s bullish potential.
If you want to refine this analysis or explore other scenarios, I'm here to dive deeper into key points! 🚀 Subscribe! TSXGanG
I hold a CCVM and MNC (Certificate of Competence to become a securities broker anywhere in Canada) and have been working as a trader for five years.
It’s a pleasure for me to help people optimize their trading strategies and make informed financial market decisions. Thank you for subscribe! 🚀

Fortune MineralsFT is primed to pamp back to $.25USD. Price is consolidating at the .786 "bear fib", and is being compressed under what I believe is a kind of inverse parabola. We shall see, but a return to 1-level bear fib, and $.25 is a fait accompli.
I hate to see guys bailing right as the party gets underway. You sell, and it pumps 16% the next day. That's how it's going to be.
