TLSA Catalyst Ranking and Market Update: June 2025Here's an updated/revised outlook for TSLA including all the primary
catalyst ranking and analyst ratings and overview of latest developments
🔋 1. EV Demand Growth
Strength: 9/10 → 9/10
Global electric vehicle adoption remains the dominant pillar. Tesla faces softer comp in Europe (–40.5% drop in May) wsj.com, but overall trend remains firmly upward. 🌍
🚗 2. Affordable Entry Level Model
Strength: 8.5/10 → 8.5/10
Tesla still on track to launch a < $25K EV in first half of 2025. Any delays or execution issues could pressure sentiment.
⚡ 3. Battery Cost & Margin Improvement
Strength: 8/10 → 8/10
Margins saw slight relief Q1, driven by cost cuts f, but macro headwinds persist.
🤖 4. Autonomy & Robotaxi Rollout
Strength: 7.5/10 → 8.5/10
Robotaxi debuted in Austin in June, sparking a ~10% one-day stock surge. Benchmark raised its target to $475/buy on the rollout—strong tailwind.
🚩 5. Competition
Strength: 7/10 → 6.5/10
Rivals like Xiaomi’s new YU7 are gaining ground. Tesla must maintain differentiation.
📉 6. Trade Policies & Tariffs
Strength: 6.5/10 → 6.5/10
Still relevant due to Tesla’s global footprint, though less front-page than before.
💰 7. Incentives & Subsidies
Strength: 6/10 → 6/10
U.S. IRA tax credit policies remain supportive; evolving eligibility remains a swing factor.
🛢️ 8. Commodity Costs
Strength: 5.5/10 → 5.5/10
Raw-material swings affect margins. Inventory hedges help but not wholly mitigate.
📈 9. Fed & Interest Rates
Strength: 5/10 → 5/10
A higher-rate environment still limits valuation multiples for growth-tier companies.
🎭 10. Musk Profile & Governance
Strength: 4/10 → 5/10
Analysts (e.g., Bradley Tusk) warn of being “massively overvalued” tied to Musk’s persona. Musk’s renewed focus on Tesla vs. other ventures (DOGE, SpaceX) will be watched.
________________________________________
🚀 Refreshed Catalyst Rankings
Rank Driver Score
1 EV demand growth 9
2 Affordable model 8.5
3 Battery costs/margins 8
4 Autonomy/robotaxi execution 8.5
5 Competition 6.5
6 Trade & tariffs 6.5
7 Regulatory incentives 6
8 Commodities 5.5
9 Fed Rates 5
10 Musk reputation/governance 5
________________________________________
📊 Latest Analyst Ratings & Targets
• Benchmark / Mickey Legg: Buy, target $475 (from $350) — cites robotaxi safety-first rollout, automation upside
• Wedbush / Dan Ives: Outperform, target $500 — labels TSLA as an “embodied AI compounder”
• Morgan Stanley / Adam Jonas: Buy, target $410 — bullish on AI/self driving positioning
• Cantor Fitzgerald / Andres Sheppard: Overweight, target $355 — optimism rooted in robotaxi and FSD rollout
• UBS / multiple: Sell, target $215–225 — skeptical on demand and valuations
Consensus snapshot (FactSet):
• Mean price target ≈ $311–$312
• Mean rating between Hold–Buy (~2.7/5)
________________________________________
🗞️ Recent Headlines
• “Tesla completes first fully autonomous Model Y delivery ahead of schedule”
• “Tesla robotaxis launch in Austin” boosting momentum
• “EU Tesla sales slump” May registrations down 40.5%
• “Tesla fires longtime insider as Europe slump deepens”
________________________________________
🔍 Summary Outlook
Tesla shares are navigating a volatile interplay of strong tech promise and unfolding execution risks:
• Overweight view (Legg, Ives): Robotaxi rollout and AI thrust fuel upside. Automation transition seen as transformative.
• Bullish base (Jonas, Sheppard): AI, FSD rollout, affordable model support core thesis.
• Skeptical view (UBS, Tusk): Slumping deliveries in Europe/China, heavy valuation, Musk's external focus seen as emotional dampener.
Upcoming triggers to watch:
1. Q2 delivery and production results (mid July).
2. Robotaxi rollout execution/regulatory clearance.
3. Margin trajectory as costs evolve.
4. FSD reliability and expansion in new markets.
________________________________________
✅ What This Means for You
• Bull case: Robotaxi + AI momentum may drive TSLA back toward targets in the $475–500 range.
• Bear case: Weak deliveries, macro and competition pressures could cap shares or trigger pullback toward prior support ($330–350).
• Neutral: Watch near-term delivery and autonomy news to shape next move.

WC: 23.59 Target: 1800-2400 MOASS: 47k-100K: Waves of MomentumYes I still believe the 20 week cycle theory is still valid...lets get that out the way
Volatile stocks like GME are driven by two things mainly: SENTIMENT and the OPTIONS CHAIN
So what I plan to focus on from here on out is MOMENTUM
What I have been focused on behind the scenes is a better way to determine WHEN momentum is picking up so that I can strategically layer in and out with the goal of growing my position over time
I've developed a system that I will be using on GME and all stocks from this point on
Every chart for me starts with understanding the general macro Elliott Wave structure which includes drawing a main macro fib
That main macro fib gives me main longer term targets for the trade..remember each fib is a target for me but im primarily focused on the 0.618, 1.00 and 1.618 fib extensions..so focusing on the chart since the move from last year the next MAJOR FIB TARGET for me is the 0.618 at appox the 56 level
Institutional Trading houses are forward looking and develop a trading thesis for the year that they execute and manage...this process resets every year
So with that in mind I want to understand 2 things each trading year: Whats the VWAP for the year? and what level is everyone at in relation to where they were (aka whats the Volume Point of Control (VPOC))?
Why? Because those tell us where EVERYONE is in relation to VWAP...the direction price moves away from VWAP tells us what the major players intentions are..and i want to FOLLOW THE MONEY
But in order for price to move away from VWAP..MOMENTUM has to BUILD and SUSTAIN
There are many ways to measure momentum on a chart but the way that works best for me is to focus on the RATE OF CHANGE (ROC) of PRICE & VOLUME
As mentioned last week Ive developed and tuned a custom indicator to help me intimately understand ROC
Im focusing on four time frames: Yearly, 3 Month, 3 Week and 3 Day
Alignment= same timeframe color and position in relation to zero line
Alignment = Strength= look to BUY
Not in alignment= Weakness= look to SELL
NOTE: This view is what you will primarily see posted going forward as this is what im using on ALL stocks to trade in and out
Cant wait to see how this chart looks by year end :)
GOOD TRADING TO YOU ALL!!!

CRCL | Long | Strong Institutional | (June 30, 2025)CRCL | Long | Strong Institutional & Regulatory Tailwinds | (June 30, 2025)
1️⃣ Insight Summary:
Circle (CRCL) recently pulled back after a massive IPO surge but is showing a strong bounce from key technical levels. With new stablecoin regulations coming and big partnerships, this could be setting up for another move higher.
2️⃣ Trade Parameters:
Bias: Long
Entry: Around $180 (supported by value area low, VWAP, and Fibonacci levels)
Stop Loss: $148 (Golden Fibonacci zone and recent key support)
TP1: $225
TP2: $265
Final Target: $378
3️⃣ Key Notes:
✅ CRCL was listed at $31 on June 5 and exploded nearly 700% to highs around $248 before pulling back ~24% on profit-taking and macro rate pressures.
✅ Major fundamental drivers include the GENIUS Act for stablecoin clarity, and big institutional partnerships (Fiserv, PayPal, Mastercard, Shopify, Ripple).
✅ Technical dynamics also show heavy short interest (~45% of volume) and high borrowing costs, which could lead to a strong short squeeze.
❌ Main risks: High valuation concerns (Compass Point targets $205), heavy exposure to interest rate changes, and rising competition in the stablecoin space (USDT, Diem, etc.).
4️⃣ Follow-up Note:
I’ll continue monitoring price action near $225 and $265 for partial exits and updates if momentum accelerates or structure changes.
Please LIKE 👍, FOLLOW ✅, SHARE 🙌 and COMMENT ✍ if you enjoy this idea! Also share your ideas and charts in the comments section below! This is best way to keep it relevant, support us, keep the content here free and allow the idea to reach as many people as possible.
Disclaimer: This is not financial advice. Always conduct your own research. This content may include enhancements made using AI.

Tesla -> The all time high breakout!🚗Tesla ( NASDAQ:TSLA ) prepares a major breakout:
🔎Analysis summary:
Not long ago Tesla perfectly retested the major support trendline of the ascending triangle pattern. So far we witnessed a nice rejection of about +50%, following the overall uptrend. There is actually a quite high chance that Tesla will eventually create a new all time high breakout.
📝Levels to watch:
$400
🙏🏻#LONGTERMVISION
Philip - Swing Trader

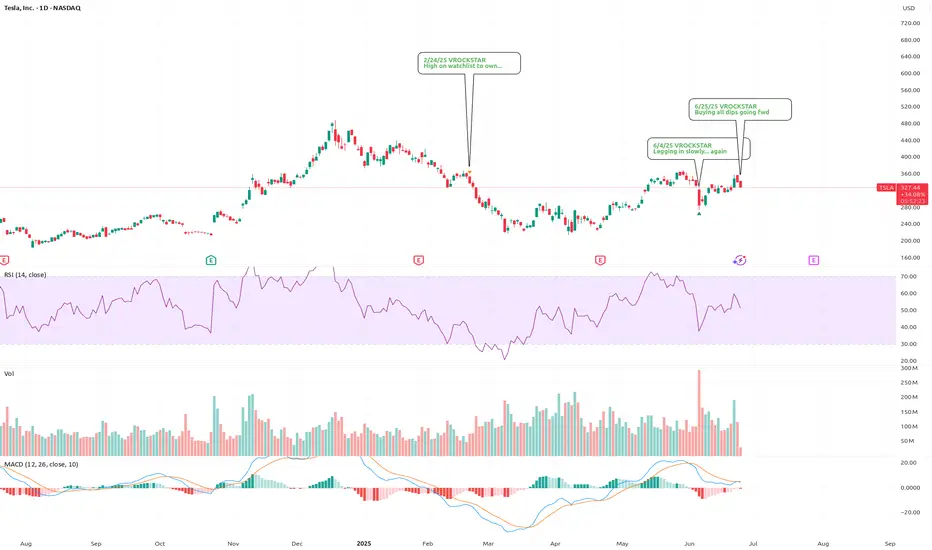
6/25/25 - $tsla - Buying all dips going fwd6/25/25 :: VROCKSTAR :: NASDAQ:TSLA
Buying all dips going fwd
- "successful robotaxi or not successful robotaxi"
- elon's clearly won the vision game
- scaling hardware (cars, infra, optimus, solar) is m-o-a-t
- so is a humanoid and robotaxi robotics company that doesn't burn cash worth a trilly in today's world if the upside is perhaps 5-10 tn in the coming decade (worst case) and your downside here is what? 30... 40... 50%? Is it more? unlikely.
- so "yes" we remain entering consumer recessy. yes "tsla" shares r not cheap. and that's for a reason.
- buy scarce paper.
- buying all dips here.
- i like the dec '27 deep ITM leaps. allows me to wrangle size with a bit more flexibility in the coming months.
- but this rocketship has yet to make any meaningful moves.
- $1,000/shr is the 2Y tgt.
V
MUSK on TRUMP's Bill | "outrageous, disgusting abomination"Elon Musk’s sided against the latest Trump-backed tax-and-spending package, in a plot twist between the recent partners turned enemies.
Musk called the legislation a “massive, outrageous, pork-filled Congressional spending bill” and a “disgusting abomination,” publicly shaming senators and representatives who backed it.
With such a strong opinion against it one may wonder, is this going to negatively affect Tesla?
Together with this strong reaction, the price has already been trading lower for the past few days.
The administration has defended it as the “One Big Beautiful Bill,” insisting it will stimulate growth, even though Elon Musk warned the bill would swell the U.S. budget deficit by roughly $2.3–2.5 trillion over the next decade, calling the added debt “crushingly unsustainable”.
When I first read this, it made me think of Tesla's long generated “green credits”, which in 2024 alone, brought in roughly $2.76 billion. “green credits” (officially, zero-emission or regulatory credits) work by building more clean vehicles than required and selling the excess allowances to other automakers that need them to comply with emissions mandates.
Now I'm no expert on US policy, and so I roped in GPT to help me explain how this new bill implicates TESLA's profit:
Under the Senate’s “big, beautiful” tax-and-spending bill, Tesla’s regulatory-credit business faces two assaults:
❗ Repeal of CAFE- and ZEV-mandates
The bill would eliminate penalties for automakers missing Corporate Average Fuel Economy targets and roll back zero-emission vehicle mandates that currently force legacy manufacturers to buy credits if they fall short. Remove those penalties and mandates, and there’s no structural need for credits—undercutting the very market that funds Tesla’s $2–3 billion-a-year credit-sales business
❗ End of consumer EV tax incentives
By phasing out the $7,500 new-EV credit (and the $4,000 used-EV credit) within months of enactment, the bill dampens U.S. EV demand overall. A smaller EV market means fewer opportunities for Tesla to leverage fleet-wide ZEV regulations against higher-emitting rivals—further squeezing credit prices and volume
Bottom line: Without CAFE/ZEV obligations and with EV purchase subsidies gone, Tesla’s “green-credit” line—a major profit driver in recent quarters—would likely collapse, removing a key buffer against manufacturing and pricing pressures.
This could be the beginning of a bear market for Tesla lasting throughout the rest of the Trump administration.
________________________
NASDAQ:TSLA

NATURAL GAS - Who can Predict this wild beast?Natural gas got demolished today, down over 8%.
The one headline we saw hitting the tape that is having some partial influence:
"Vessel Arrives at LNG Canada to Load First Cargo, Strengthening Global Supply Outlook – LNG Recap"
Today, we did hedge our core long UNG position with a short dated $56 put on EQT.
We are already green on that trade and looking for $56 level to come into play.
Natural gas volatility sure trades in a world of its own which is why it is key to size accordingly.

6/30/25 - $qubt - short... AGAIN. lol6/30/25 :: VROCKSTAR :: NASDAQ:QUBT
short... AGAIN. lol
- it's pretty simple
- 1/ the recent "dilute me harder" gap on June 23rd gets filled
- 2/ the CFO leaves, gets paid a pile of shares on the way out (lol)
- 3/ no product
- 4/ index inclusion means... real money will underweight this hardcore
- 5/ and it remains the gift that keeps on giving
i love donuts
V


High probability bullish setup #lcidMultiple confluences are suggesting a potential bullish reversal:
A- Price is forming lower highs, while MACD is showing higher lows → bullish divergence
B- MACD crossover is forming, indicating strengthening momentum
C- Bollinger Bands are narrowing, suggesting a potential breakout
D- Support level is holding, confirmed by increased volume, indicating buyer interest
NASDAQ:LCID
Disclaimer: This is not financial advice. The information provided is for educational and informational purposes only. Trading stocks and other financial instruments involves significant risk and may not be suitable for all investors. Always do your own research and consult with a licensed financial advisor before making any trading decisions. Past performance is not indicative of future results.

3M is skyrocketing againAfter a period of sideways trading, 3M has clearly shown where its resistance levels are—and this is dynamite for traders. If the price breaks above the current resistance, we could be in for a very interesting rally, especially if it also surpasses the previous all-time high at 165.
This offers a great opportunity to enter a position in 3M with the potential for a 10% or greater profit in just a few weeks, while keeping your stop loss at 2-3%.
This trade can be done with minimal risk. To learn more about the strategy, follow ;)

Trend reversal imminentIf we surpass 1.96, significant upside is possible. Future growth will help facilitate this."
Volume is also positive.

6/30/25 - $googl - Catching my eye again...6/30/25 :: VROCKSTAR :: NASDAQ:GOOGL
Catching my eye again...
- while i don't typically enjoy having multiple positions on/ and that i incubate, NASDAQ:GOOGL is catching my eye again
- made the quick scoop on the ridiculous NASDAQ:AAPL testimony (see chart) on may 7th for a nice trade but i was back out of it in the days ahead as it recovered the entirety of the drop
- but now the more i'm using gemini (and it's the best model on the market) but ALSO understanding how the TPUs the co has been building allow for massively cheaper inference... i'm beginning to wonder, if the market understands this advantage of serving up compute across it's portfolio of products
- with fcf yields (in '26) nearly 4%... double digit growth, "no" it's not NASDAQ:NVDA , but it's also a bit more de-risked as a platform play
- what worries is when i chart GOOGL/QQQ (google on it's nasdaq pair), it's basically been FLAT for the last 15 years. so you've been better off owning nasdaq only (lower risk, same return)
- but with that being said, i like the inflection i'm noticing on the application of compute across the company
- and for all of you saying "yeah the culture is rotten"... perhaps you're right - i think that's well known (so again where's your edge/ isn't that "in" the price?). consider how the application of compute here may be replacing this cost structure faster than it can erode. a dollar saved is a dollar earned.
- and then you have the upside of sundar being fired, he may be a product guy, but the low T and lack of solid communication definitely as a net negative. can't say the same for many of these other co's. so that's a bump if/when that happens. and if doesn't (and it's not necessarily expected)... i think stock does just fine.
- i'd be looking to size up if/when we get a bit of a mkt shakeup- garden variety pullback
- but for now i'm content to use some ITM leverage for '27 leaps and put this thing as a low single digit position in my PnL
V

BBAI Round 2Big Bear AI is a military based AI company aimed at increasing productivity and efficiency for military endeavours in the USA.
Although this company is currently un-profitiable, it does seem to be providing a nice technical setup for a potential squeeze here after a previous breakout of the lower range volume profile.
I would like to take a long trade here as we break $4.20 and pump it up to approx $7.
Stoploss set to 3.70 in case this is a failed rally.

Time to buy? Too much negative press. Buy in Fear- Updated 25/6Apple has recently faced significant negative press, leading to fear and critical perceptions among investors. This situation highlights a common investment principle: buy in times of fear and sell in times of greed. As a result, I have taken a considerable long position on Apple, which I have since increased since my orginal post.
The flag pattern on the stock chart is nearly complete, indicating that a price movement is imminent. I have set my stop loss at $191, while I anticipate that a positive breakout could push the stock price above $223, representing potential gains of over 10%. There is also further upside potential for the price to exceed >$230. My target sell price for a full exit from Apple is now 275 USD, which would yield a return of 35%, although I do not expect this target to be reached until September or later. For shorter-term returns, I am targeting prices above $223.
I believe Apple is a strong long-term hold, regardless of current market fluctuations. The company has a mature and extensive ecosystem, making it a brand I would be reluctant to bet against. If you already own Apple products, you likely understand how unlikely it is that you would switch to another brand.
A close above $201.12 today would confirm a positive breakout.

Is MSTR overvalued?Pros of Investing in MSTR
Massive Bitcoin Reserves
-Owns ~582,000 BTC (~2–3% of total supply), making it a levered proxy to Bitcoin. Any BTC rally strongly benefits MSTR.
Aggressive Treasury Strategy
-The company continuously issues equity, preferreds, and convertible bonds to buy more Bitcoin. This "flywheel" can compound Bitcoin exposure rapidly.
Strong Momentum & Index Inclusion
-Added to Nasdaq‑100, which boosts trading volumes and visibility. Momentum is supported by Bitcoin's surge.
High Analyst Targets
-Some bullish forecasts set ambitious targets—median around ~$550, with upside to $1,000+ if Bitcoin soars.
Cons & Risks
Extreme Volatility Tied to Bitcoin
-MSTR isn’t a business stock—it’s highly leveraged to Bitcoin’s price moves, showing wild price swings.
Leverage & Debt Repayment Risk
-Reliance on convertible bonds and preferred stock introduces liquidity risk if BTC price falls, potentially triggering a “death spiral”.
Accounting & Tax Exposure
-New FASB rules may force MSTR to pay corporate alternative minimum tax on unrealized gains, potentially running into billions by 2026.
Minimal Software Business
-MSTR’s original BI software arm is now overshadowed by Bitcoin holdings. The market values it mainly as a crypto vehicle—not a tech company.
High Valuation Premium
-Market cap is ~2× its BTC holdings, a steep premium relying on perpetual BTC appreciation and investor sentiment.
-Disclaimer: This analysis is for informational and educational purposes only and does not constitute financial advice, investment recommendation, or an offer to buy or sell any securities. Stock prices, valuations, and performance metrics are subject to change and may be outdated. Always conduct your own due diligence and consult with a licensed financial advisor before making investment decisions. The information presented may contain inaccuracies and should not be solely relied upon for financial decisions. I am not personally liable for your own losses, this is not financial advise.

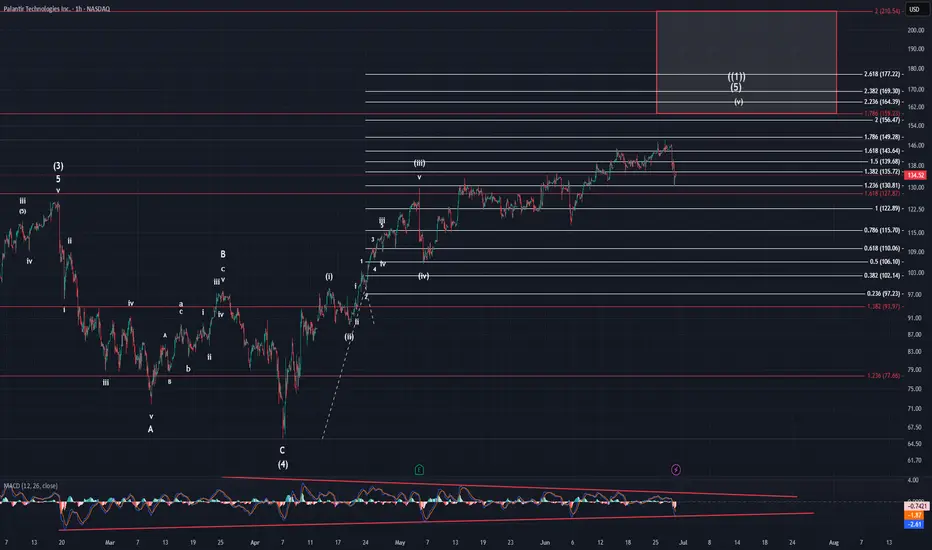
PalantirOn Friday Palantir dropped pretty hard causing MACD to drop all the way to our bottom trend line. It created overlap with the pattern which brings a further rise to the target box into question. On thing I can say about this pattern with certainty, is it is very sloppy. It in no way appears as an impulsive pattern due to the choppy overlapping nature of it. This is what leads me to believe it is an ED.
If it is an ED that leaves us with two possibilities. It is either within its wave 4, which would explain the overlap, or it just finished (v) of (5) of ((1)). We need more price action to determine which count prevails. A drop below $117.22 and that is a huge warning that the upside is done. Below $105.32 and that confirms it for me.
To raise higher again breaching our ATH shows that the ED is not yet done and we're most likely rising to the $160 area. Don't forget, when an ED finished, it moves towards the place of origin in a strong move.
PLTR: Encoded Wave Replication IAs bullish wave gets mature on the way up, it draws distinctive tops in a way that warns of bullish exhaustion ahead because to some extent topologically highs indicate a registered rejection of moving further in a local scope (some period).
Scalable Recursive Patterns
If we pay attention to building blocks on smaller scale
Those patterns replicate in bigger scale for example
If the pattern really carries the identified encoding, I'd pay attention to how price retraces within fibonacci channel which is adjusted to the direction of fractal cycle in a clean version.

Velocity Market Conditions Explained.There are 6 primary upside Market Conditions. Currently the stock market is in a Velocity Market Condition where price and runs are controlled by retail investors, retail swing traders, retail day traders and the huge group of Small Funds Managers using VWAP ORDERS to buy shares of stock with an automated systematic buy order trigger when the volume in that stock starts to rise. The more volume in a stock the faster the VWAP order will trigger.
You task is to study Dark Pool hidden and quiet accumulation bottoming formations to be ready for the Velocity Market Condition that always follows.
Price is a primary indicator.
Volume is a primary Indicator.
These are the most important indicators in your trading charting software tools.
The next most important indicator is Large lot versus Small lot indicators which are NOT based on volume but more complex formulations.
HFTs use algorithms, AI, social media discussions etc.
To ride the Velocity wave upward, you must enter the stock before the run upward.
Learning to read charts as easily takes practice and experience.
The benefit is the ability to forecast with a very high degree of accuracy what that stock will due in terms of rising profits, over the next few days or longer.
Candlesticks have many new candle patterns that have just developed in the past couple of years. The stock market is evolving at a fast pace and the internal market structure that you can't see is only visible in the candlesticks, large lot vs small lot indicators, and other semi professional to professional level tools for analyzing stocks.
The stock market is changing and becoming far more tiered with more off exchange transactions. Learn to read charts so that you can trade with higher confidence and higher revenues.

Navitas Semiconductor Corporation (NVTS) .Stock Almost completed Wave 1 and wave 2
Ww are in Start of W3 , The Motive powerful wave that I expected to reach between 26.50 $ & 27.50 $ .
After that a small correction will be to Around 16$ - 20$ depending on Aggressive Sellers at that point .
Last 5th wave will end of 1st Wave at around 36.50$ to 40.00$ ( open Distribution Zone ) .
The whole Harmonic pattern is called after Updates [ ] .
Highly recommended for Buying.

AAPL triangle breakout pattern (bullish bias in this case).📈 Chart Pattern Observed:
This is a symmetrical triangle breakout pattern (bullish bias in this case).
Price has broken out or is near breakout above the descending trendline.
Ichimoku cloud thinning and flattening indicates potential bullish momentum building up.
---
🎯 Target Levels Based on Chart:
1. First Target Point:
Price Level: Around $225.00 USD
This is the initial breakout target, often calculated by measuring the widest part of the triangle and projecting upward from the breakout point.
2. Second (Final) Target Point:
Price Level: Around $250.00 USD
This is a more extended target if bullish momentum continues strongly and volume confirms the move.
---
🔍 Additional Notes:
Current Price Zone: Around $202–$206 USD
Stop-Loss Idea: Below the recent swing low or lower trendline, around $195–$197 USD
Entry Idea: On confirmed breakout and retest, above $206.50–$208.00 USD
Would you like help with a trade plan including entry/SL/TP levels based on risk-reward?

it's a time for RRX (Recro Pharma)? Current trend: The recent sharp price increase (around 5.25 USD) with strong volume support indicates robust demand. The upward arrow on the chart suggests a continuation of this movement.
Resistance level: The nearest resistance is in the 6.50-7.00 USD range, where the price previously faced challenges. Breaking this level with high volume could pave the way to 7.50 USD.
Moving averages: If the blue line (likely the 50-day moving average) holds as support and the yellow trend line remains upward, a bullish scenario is plausible.
Technical indicators: Assuming RSI does not yet indicate overbought conditions (further oscillator analysis is needed), momentum could support an upward move.
Target of 7.50 USD: The 7.50 USD level is a realistic short-term target, approximately 42% above the current price, assuming positive market sentiment persists.
Potential Target 7.50 USD

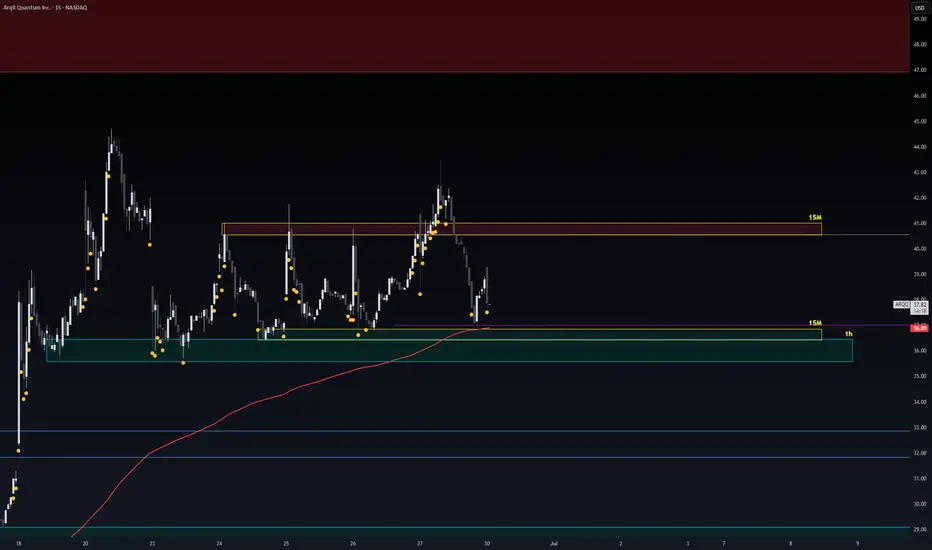
Scalp ARQQ Safe EntryZone Part-4Quantum stocks in free money Ranging Zone.
15M Zone Green is buy.
15M Zone Red is sell.
Note: 1- Potentional of Strong Buying Zone:
We have two scenarios must happen at The Mentioned Zone:
Scenarios One: strong buying volume with reversal Candle.
Scenarios Two: Fake Break-Out of The Buying Zone.
Both indicate buyers stepping in strongly. NEVER Join in unless one showed up.
2- How to Buy Stock:
On 15M TF when Marubozu Candle show up which indicate strong buyers stepping-in.
Buy on 0.5 Fibo Level of the Marubozu Candle, because price will always and always re-test the
PLEASE Note: its more dangerous now wait for buying power to show up already gained over 40% profit from ranging movement the resistance and supports getting weaker now