Alphabet - The textbook break and retest!📧Alphabet ( NASDAQ:GOOGL ) will head much higher:
🔎Analysis summary:
If we look at the chart of Alphabet we can basically only see green lines. And despite the recent correction of about -30%, Alphabet remains in a very bullish market. Looking at the recent all time high break and retest, there is a chance that we will see new all time highs soon.
📝Levels to watch:
$200
🙏🏻#LONGTERMVISION
Philip - Swing Trader

Tesla Bullish Breakout Setup: Entry at $295.54 Targeting $488.87Entry Point (Buy Zone): Around $295.54
Stop Loss: Between $272.94 – $295.54 (lower purple support zone)
Target (TP): $488.87
Current Price: $315.33 (as of the latest candle)
📈 Strategy Summary:
Setup Type: Long (Buy)
Risk-Reward Setup:
Reward: ~$193.33 per share (from $295.54 to $488.87)
Risk: ~$22.60 per share (from $295.54 to $272.94)
Reward:Risk Ratio ≈ 8.6:1 — a high potential payoff if the trade works out.
📊 Technical Context:
Support Zone: Price recently bounced off the support region (marked in purple).
Moving Averages:
Red Line (Short-Term MA): Price just crossed back above.
Blue Line (Long-Term MA): Price reclaimed this level — bullish signal.
Price Action: After a corrective phase, a possible reversal is forming at support, confirming bullish interest.
✅ Bullish Signals:
Bounce from support zone with a strong bullish candle.
Price closing above the 200-day MA (bullish trend resumption).
High reward-to-risk trade setup with clear stop loss.
⚠️ Considerations:
Confirmation with volume or a second bullish candle would add confidence.
Watch for earnings or macro events that could disrupt the trend.
Tight stop is essential to avoid drawdowns if the setup fails.
🔚 Conclusion
This is a well-structured long setup with a high potential reward. If price maintains above the entry zone and breaks recent highs, a push toward the $488.87 target is plausible.

AMD Stable Channel Up targets $168.Advanced Micro Devices (AMD) has been trading within a Channel Up since the April 08 market bottom. With the 4H MA50 (blue trend-line) as its Support since April 30, the pattern has shown incredible consistency, with the past two pull-backs almost touching the 0.382 Fibonacci retracement level.
As a result, given also the fact that the 4H RSI is supported by the Higher Lows trend-line, we view the current bounce as a solid buy opportunity for the short-term. We are targeting $168, which is the -0.5 Fibonacci extension, the level that the previous Higher High reached.
-------------------------------------------------------------------------------
** Please LIKE 👍, FOLLOW ✅, SHARE 🙌 and COMMENT ✍ if you enjoy this idea! Also share your ideas and charts in the comments section below! This is best way to keep it relevant, support us, keep the content here free and allow the idea to reach as many people as possible. **
-------------------------------------------------------------------------------
💸💸💸💸💸💸
👇 👇 👇 👇 👇 👇

Adobe - A gigantic triangle breakout! 🔋Adobe ( NASDAQ:ADBE ) will break the triangle:
🔎Analysis summary:
Yes, for the past five years Adobe has been overall consolidating. But this consolidation was governed by a strong symmetrical triangle pattern. Thus following the underlying uptrend, there is already a higher chance that we will see a bullish breakout, followed by a strong rally.
📝Levels to watch:
$400, $700
🙏🏻#LONGTERMVISION
Philip - Swing Trader

7/3/25 - $bmnr - Imagine not selling $100k/ETH7/3/25 :: VROCKSTAR :: AMEX:BMNR
Imagine not selling $100k/ETH
- somehow your eth bag is worth more than BTC per token
- and you're convinced it's going higher
- anyone who's not using this liquidity to get light literally deserves what's coming, 100%.
V

Ulta consolidation. Wait for breakULTA is in a consolidation phase post-Q1 2025 earnings, trading between $421.79 (support) and $465.48 (resistance). To identify a breakout:
Price Levels: Watch for a daily/weekly close above $465.48 (bullish, targeting $480–$510) or below $421.79 (bearish, targeting $367.76–$338).
Moving Averages: Monitor the 200-day MA ($442.22, ~40-week MA) for support; a break above $465.48 (50-day MA) is bullish, below $442.22 is bearish.
RSI: Look for RSI >60 (bullish) or <50 (bearish) to confirm momentum.
MACD: A strengthening bullish crossover above $465.48 or bearish crossover below $421.79 signals direction.
Volume: Confirm breakouts with volume >1.5M shares.
Patterns: An inverse head and shoulders breakout above $465.48 is bullish; a head and shoulders breakdown below $315 is bearish.
Fibonacci: Watch $400.45 (50% retracement) for bearish targets, $448.66 (23.6%) for bullish.
ATR: Expect ±$10.98 daily moves; set alerts at $469.25 (bullish) and $447.29 (bearish).
On TradingView, set a custom layout with these indicators, disable “Auto (Fits Data to Screen),” and save to persist zoom. Set alerts at $465.48, $421.79, and $442.22. In your Trading 212 ISA, ULTA’s gains are UK tax-free, but monitor USD conversion fees.

VST trendlinestill within the channel but broke below 9 sma, staying long as long as it stays within the channel, exit / short of it breaks the lower line.
NFA

Infection year 2025; rounded bottoming formation.- Infection year 2025; rounded bottoming formation.
- business is improving starting 2025

Direct Access Trading SystemsDirect Access Trading Systems
Direct access trading systems (DATS) offer traders a direct line to financial markets. By bypassing traditional brokerage routes, DATS enable swift, precise trading, essential for strategies reliant on speed and accuracy. This FXOpen article delves into the workings, benefits, and considerations of DATS, providing valuable insights for both seasoned and aspiring traders navigating the fast-paced world of modern trading.
Understanding Direct Access Trading Systems
Direct access trading systems (DATS) revolutionise how traders interact with financial markets, typically in the realm of stock trading. Unlike traditional brokerage platforms, these systems offer direct market access trading, a method allowing traders to place orders directly into the market's electronic order book. Such immediate access is crucial for those who require precision and speed in their trading decisions.
Traditionally, orders placed through brokers are processed internally before reaching the market, potentially causing delays. However, brokers with direct market access provide a conduit for traders to bypass these intermediate steps. These systems typically appeal to day traders and other short-term investors who value the ability to respond swiftly to market movements.
Usually, direct access brokers list Level 2 quotes, where bid and ask prices alongside order sizes are given for the asset, providing an additional layer of valuable information. By offering a more direct link to financial markets, these systems may provide an enhanced trading experience that aligns with the needs of active traders.
Selecting the best direct access broker for day trading involves considering several key factors. Traders look for platforms that offer high reliability and uptime, as any downtime can significantly impact outcomes. Speed of order execution is crucial in capturing market opportunities. Additionally, traders assess the fee and commission structure to ensure it aligns with their trading volume and strategy.
How Direct Access Trading Systems Work
DATS offer a sophisticated network that connects traders directly to financial markets. These systems use specialised software platforms, helping traders make efficient and swift operations:
- Order Entry: Traders use the DATS platform to enter their orders. These platforms are equipped with various order types, such as market, limit, or stop orders, giving traders flexibility in how they execute trades.
- Order Routing: After order placement, DATS route these orders directly to the market instead of through a broker. The process often involves Electronic Communication Networks (ECNs), which play a critical role. ECNs are automated systems that match buy and sell orders for assets, eliminating the need for intermediaries like traditional stock exchanges. They also provide a venue for trading outside traditional hours, offering greater liquidity and potential efficiency.
- Execution: Orders are executed via these ECNs or other market venues. The rapid execution capability is a defining feature of DATS, enabling traders to capitalise on fleeting market opportunities.
- Feedback and Reporting: Following execution, the system promptly provides feedback. Traders receive immediate trade confirmations, including execution price and time, essential in maintaining transparency and control over trading activities.
Through this streamlined process, DATS offer a high-efficiency trading environment. Such a setup is particularly advantageous for strategies that require quick decision-making and execution, such as day trading or scalping.
Advantages of Direct Access Trading Systems
DATS offer several compelling advantages over traditional brokerage platforms, particularly for those who engage in frequent trading. These benefits cater to the needs of active traders seeking efficiency and control in their strategies.
- Speed of Execution: DATS enable traders to execute orders almost instantaneously. Rapid processing is crucial in fast-paced markets where prices can fluctuate within seconds.
- Enhanced Control: Traders have greater control over their orders, including the timing, price, and order type. This level of control is especially crucial in volatile market conditions.
- Access to Real-Time Market Data: DATS provide real-time data, allowing traders to make informed decisions based on the latest market movements.
- Lower Transaction Costs: By eliminating the middleman, DATS often result in lower transaction costs, a significant advantage for high-volume traders.
- Customisation and Flexibility: Many direct access trading platforms come with advanced charting and analysis tools. These tools can be customised to fit individual strategies and preferences.
- Direct Market Interaction: Traders can interact directly with market liquidity providers, potentially leading to better pricing and execution quality.
Risks and Considerations
While these systems offer several advantages, they also come with inherent risks and considerations:
- Increased Complexity: DATS are typically more complex than traditional brokerage platforms. They require a sophisticated understanding of market dynamics and trading strategies, making them better suited for experienced traders. The complexity also extends to the technological infrastructure needed to use these systems, which may involve higher setup and maintenance costs.
- Higher Costs: Using DATS may be more expensive than traditional online brokers. The costs go beyond technology requirements; for example, the price of direct access trading systems and the commissions for trades can be higher. This aspect makes it vital for traders to evaluate the cost-benefit ratio of using DATS compared to other trading methods.
- Stricter Trading Rules: Direct market access often comes with more stringent rules. This could include tighter regulations around repeat dealing, deal rejections if trading outside normal market sizes, and potential penalty fees for inactive accounts.
The Bottom Line
In summary, direct access trading systems may enhance efficiency, offering speed, control, and direct market insights. However, they require a careful approach due to their complexity and cost.
This article represents the opinion of the Companies operating under the FXOpen brand only. It is not to be construed as an offer, solicitation, or recommendation with respect to products and services provided by the Companies operating under the FXOpen brand, nor is it to be considered financial advice.

$NVDA - $270 PT in BULL ChannelThe stock is currently bouncing off of the lower channel line of the rising Bull Channel. Price action has created a Cup and Handle. The projected Price Objective sits at around $270. Remember, the height of the cup is the project target which from current stock price extends to around $270.

MUSK on TRUMP's Bill | "outrageous, disgusting abomination"Elon Musk’s sided against the latest Trump-backed tax-and-spending package, in a plot twist between the recent partners turned enemies.
Musk called the legislation a “massive, outrageous, pork-filled Congressional spending bill” and a “disgusting abomination,” publicly shaming senators and representatives who backed it.
With such a strong opinion against it one may wonder, is this going to negatively affect Tesla?
Together with this strong reaction, the price has already been trading lower for the past few days.
The administration has defended it as the “One Big Beautiful Bill,” insisting it will stimulate growth, even though Elon Musk warned the bill would swell the U.S. budget deficit by roughly $2.3–2.5 trillion over the next decade, calling the added debt “crushingly unsustainable”.
When I first read this, it made me think of Tesla's long generated “green credits”, which in 2024 alone, brought in roughly $2.76 billion. “green credits” (officially, zero-emission or regulatory credits) work by building more clean vehicles than required and selling the excess allowances to other automakers that need them to comply with emissions mandates.
Now I'm no expert on US policy, and so I roped in GPT to help me explain how this new bill implicates TESLA's profit:
Under the Senate’s “big, beautiful” tax-and-spending bill, Tesla’s regulatory-credit business faces two assaults:
❗ Repeal of CAFE- and ZEV-mandates
The bill would eliminate penalties for automakers missing Corporate Average Fuel Economy targets and roll back zero-emission vehicle mandates that currently force legacy manufacturers to buy credits if they fall short. Remove those penalties and mandates, and there’s no structural need for credits—undercutting the very market that funds Tesla’s $2–3 billion-a-year credit-sales business
❗ End of consumer EV tax incentives
By phasing out the $7,500 new-EV credit (and the $4,000 used-EV credit) within months of enactment, the bill dampens U.S. EV demand overall. A smaller EV market means fewer opportunities for Tesla to leverage fleet-wide ZEV regulations against higher-emitting rivals—further squeezing credit prices and volume
Bottom line: Without CAFE/ZEV obligations and with EV purchase subsidies gone, Tesla’s “green-credit” line—a major profit driver in recent quarters—would likely collapse, removing a key buffer against manufacturing and pricing pressures.
This could be the beginning of a bear market for Tesla lasting throughout the rest of the Trump administration.
________________________
NASDAQ:TSLA

BULL | Robinhood Copy TradeWebull Corporation displays explosive momentum after breaking through former resistance levels, positioning itself for a potential run to higher targets. The stock mirrors Robinhood's exceptional performance, suggesting investors may view it as a strong fintech play-along opportunity.
Key Technical Signals:
Decisive breakout from extended consolidation base
Former resistance now acting as new support
Parabolic price acceleration with strong volume
Clear pathway toward upper resistance zone around $21-24
Trading Opportunity:
The breakout setup suggests continued upside potential as the stock follows the projected bullish path. Market sentiment around fintech stocks remains elevated, providing fundamental tailwinds.
Risk Management:
Overextended RSI levels indicate possible short-term pullback
Profit-taking likely near psychological resistance levels
Stop-loss below the green support zone to protect against reversal
The comparison to Robinhood's success adds conviction to the bullish thesis, but traders should remain disciplined given the stock's parabolic nature and manage position sizes accordingly.

Yes AAPL has been trash. Yes AAPL will short term pumpThere is no world in which you can look at this aapl/spy chart and not identify that this isn't a GREAT risk/reward entry. You're telling me AAPL won't at least retest the 200 DMA this year?? You're telling me it's not worth it for a leap long as it's sitting at range lows??
Easiest money play I've seen in a minute.

WOW $4 to $74 Big 1,655% in just 2 daysGet ready for new power runners to emerge from this AMEX:BMNR move

ServiceNow Is Up Some 55% Since April. What Might Happen Next?ServiceNow NYSE:NOW has risen nearly 55% in the past three months as the AI-focused business-management firm and member of the S&P 500 SP:SPX gained ground ahead of and following its well-received Q1 earnings. With Q2 earnings due out later this month, what does the stock's fundamental and technical analysis say now?
Let's take a look:
ServiceNow's Fundamental Analysis
For those unfamiliar with NOW, the company sells an AI-powered platform that links clients' workers and devices to a firm's work processes and data. This helps increase productivity, improve efficiency and maximize business outcomes.
ServiceNow's cloud-based platform helps businesses digitize workflows, manage client relationships and reimagine customer experience.
The company said on Wednesday that it will report Q2 results on July 23, which could be a key date for the stock. After all, NOW rose 15.5% on heavy volume the day after management released Q1 earnings on April 23 after the bell.
As for Q2, the Street is looking for NOW to post $3.57 of adjusted earnings per share on $3.12 billion of revenue. That would compare well to the $3.13 in adjusted EPS and $2.6 billion of revenue that ServiceNow reported in the same quarter last year.
Perhaps most importantly, NOW had $10.3 billion of performance obligations as of Q1's end. That was good for 22% year-over-year growth, which bodes well for the company's future.
That said, 24 of the 35 sell-side analysts that I found who cover NOW have lowered their Q2 earnings estimates since the quarter began, while only 11 have raised their outlooks. That's typically bearish.
ServiceNow's Technical Analysis
Now let's check out NOW's chart going back to January and running through earlier this week:
image]https://www.tradingview.com/x/T9PMI1X8/
Readers will see that ServiceNow hit an $1,198.09 all-time intraday high in late January, then went into what appears to be a fairly standard "cup-with-handle" pattern from there. That's generally considered a bullish set-up.
Another bullish consideration is the so-called "golden cross" that the stock saw in late June. That's when ServiceNow's 50-day Simple Moving Average (or "SMA," marked with a blue line) crossed above the stock's 200-day SMA (denoted with a red line) at the chart's right.
Lastly, the bulls might point to a still-unfilled gap that NOW has from late January. Stocks don't always fill in such gaps, but historically, most eventually do.
However, let's now look at the other side of the coin -- the potentially bearish signals that the above chart is showing.
First, the "handle" part of NOW's "cup-with-handle" pattern has flattened out somewhat and really is rather shallow. Some technicians feel that the deeper the handle, the stronger the rally that follows. So, some might see ServiceNow's shallower handle in this pattern as not especially bullish.
Meanwhile, NOW's Relative Strength Index (the gray line at the chart's top) is neutral, but appears to be weakening.
Similarly, the stock's daily Moving Average Convergence Divergence indicator (or "MACD," marked with black and gold lines and blue bars at the chart's bottom) looks slightly bearish here.
The histogram of the ServiceNow's 9-day Exponential Moving Average (or "EMA," denoted by blue field) is below zero and has been since late May. This can typically be seen as bearish.
On top of that, the stock's 12-day EMA (the black line) and its 26-day EMA (the gold line) appear to be wrestling for the upper hand, although they both remain in positive territory.
The bulls will be rooting for the 12-day EMA to win out, while the bears will be cheering for the 26-day EMA.
Add it all up and ServiceNow looks like it's well-positioned to go ... somewhere. The question is where.
The stock's upside pivot stands at $1,046 in the chart above, having been created by the cup-with-handle pattern. That's somewhat below the $1,052.77 that ServiceNow was trading at intraday Thursday, but the stock hasn't yet held that level.
NOW's downside pivot would be its 200-day SMA (around $969 in the chart above). Losing that support line would likely force portfolio managers who are invested in the name to reduce their long-side exposure.
(Moomoo Technologies Inc. Markets Commentator Stephen “Sarge” Guilfoyle had no position in NOW at the time of writing this column.)
This article discusses technical analysis, other approaches, including fundamental analysis, may offer very different views. The examples provided are for illustrative purposes only and are not intended to be reflective of the results you can expect to achieve. Specific security charts used are for illustrative purposes only and are not a recommendation, offer to sell, or a solicitation of an offer to buy any security. Past investment performance does not indicate or guarantee future success. Returns will vary, and all investments carry risks, including loss of principal. This content is also not a research report and is not intended to serve as the basis for any investment decision. The information contained in this article does not purport to be a complete description of the securities, markets, or developments referred to in this material. Moomoo and its affiliates make no representation or warranty as to the article's adequacy, completeness, accuracy or timeliness for any particular purpose of the above content. Furthermore, there is no guarantee that any statements, estimates, price targets, opinions or forecasts provided herein will prove to be correct.
Moomoo is a financial information and trading app offered by Moomoo Technologies Inc. In the U.S., investment products and services on Moomoo are offered by Moomoo Financial Inc., Member FINRA/SIPC.
TradingView is an independent third party not affiliated with Moomoo Financial Inc., Moomoo Technologies Inc., or its affiliates. Moomoo Financial Inc. and its affiliates do not endorse, represent or warrant the completeness and accuracy of the data and information available on the TradingView platform and are not responsible for any services provided by the third-party platform.

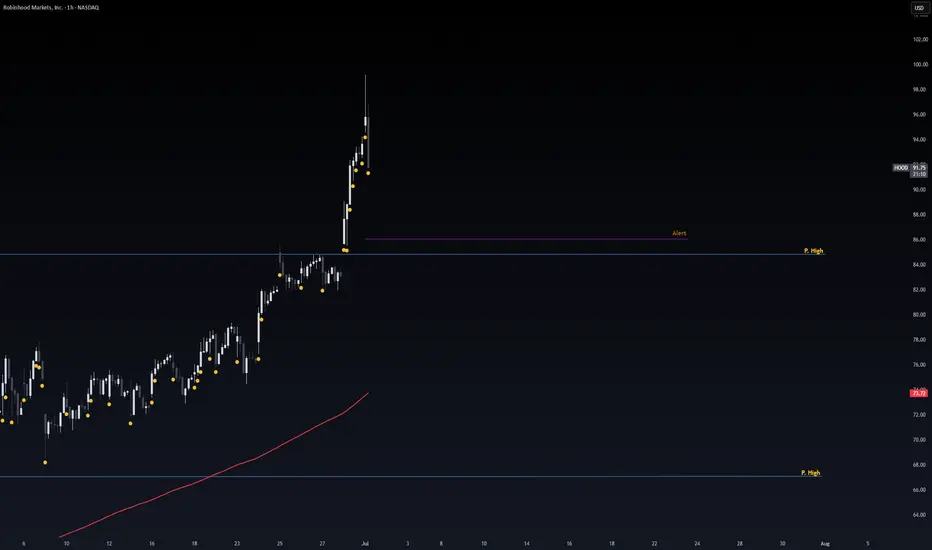
Safe Entry Zone HOODP.High (Previous High) Act as good support level.
Waiting for Buying Power to Stepin at P.High Line.
Note: 1- Potentional of Strong Buying Zone:
We have two scenarios must happen at The Mentioned Zone:
Scenarios One: strong buying volume with reversal Candle.
Scenarios Two: Fake Break-Out of The Buying Zone.
Both indicate buyers stepping in strongly. NEVER Join in unless one showed up.
2- How to Buy Stock:
On 1H TF when Marubozu/PinBar Candle show up which indicate strong buyers stepping-in.
Buy on 0.5 Fibo Level of the Marubozu Candle, because price will always and always re-test the imbalance.
Blow off top?This is looking like the final leg up of Wave 5. I initiated a short position with a tight stop loss just above all time highs. This entire move looks extremely overextended and Duo Lingo is extremely overvalued.
Not financial advice, do what’s best for you.

AMD: Wave DimensionsProjection via Historic Wave Dimensions
Fractal Wave Marker with settings: core period of 60 and 1 Phi Scaling on1h TF AMD chart
From point of 3rd degree wave's reference:
If resistance curve is violated:
Mapping a cycle:

$CRM Long Setup – Coiling at Support with Breakout PotentialSalesforce ( NYSE:CRM ) is consolidating just below the Ichimoku Cloud and building a base around the $265–$270 zone. The MACD is showing early bullish crossover signals with momentum starting to shift, and the price action suggests a coiled spring setup. After multiple tests of the $265 area and a failure to break lower, bulls may now have the upper hand.
The current setup offers a favorable 2.22 risk/reward ratio:
Entry: $269.90
Stop: $257.61 (below recent range lows)
Target: $297.23 (recent swing high + pivot zone)
A clean breakout above $275 could trigger a sharp move into the $290–$300 range. This is a measured, low-volatility breakout setup with a 2–3 week swing timeframe. Risk is tight, and the structure looks healthy if buyers step in above resistance.
Let me know if you’re long here or waiting for confirmation on volume.

$TSLA Time to Fade or..?NASDAQ:TSLA (like NASDAQ:GOOG ) is standing out to me as bullish, yet, corrective Elliot Waves a higher degree series of ABCs appear to be underway.
A final wave C appears to be underway which would take price too all time highs in an expanded flat correction pattern. My count could be wrong and the interference could be from the increase it sentiment volatility connected to the US headlines lately and Trump posting on socials. Things may get back to normal after the summer and a clearer pattern may emerge.
Price is struggling to get past the weekly pivot point bullishly or the weekly 200EMS bearishly and is trapped within that range.
For now long term target is the R2 daily pivot at $693 as the higher probability is continued upside
Safe trading

$OSCR long PT: $30-60 range- Undervalued Healthtech company growing revenue double digits.
- PEG < 1

NFLX: pullback is an opportunity for bulls into its earning.Buy an At-the-Money (ATM) Call with an expiration at least 60-90 days out to give the trade time to work. For an entry around $1,280, you could buy the $1,280 strike call.
Sell an Out-of-the-Money (OTM) Call with the same expiration to reduce your cost, for instance, the $1,340 strike call.
Price Target: The initial profit target is a retest of the high near $1,340, where the spread would reach its maximum value.
Stop Loss Level: A decisive daily close below the current support shelf at $1,240 would signal that this pullback is something more sinister. We would exit gracefully and preserve our capital.

Tesla - This bullish break and retest!Tesla - NASDAQ:TSLA - confirmed the bullish reversal:
(click chart above to see the in depth analysis👆🏻)
Tesla recently created a very bullish break and retest. Therefore together with the monthly bullish price action, the recent rally was totally expected. But despite the short term volatility, Tesla remains bullish, is heading higher and will soon create new highs.
Levels to watch: $400
Keep your long term vision!
Philip (BasicTrading)
