Adaptive Z-Score Oscillator [QuantAlgo]🟢 Overview
The Adaptive Z-Score Oscillator transforms price action into statistical significance measurements by calculating how many standard deviations the current price deviates from its moving average baseline, then dynamically adjusting threshold levels based on historical distribution patterns. Unlike traditional oscillators that rely on fixed overbought/oversold levels, this indicator employs percentile-based adaptive thresholds that automatically calibrate to changing market volatility regimes and statistical characteristics. By offering both adaptive and fixed threshold modes alongside multiple moving average types and customizable smoothing, the indicator provides traders and investors with a robust framework for identifying extreme price deviations, mean reversion opportunities, and underlying trend conditions through the visualization of price behavior within a statistical distribution context.
🟢 How It Works
The indicator begins by establishing a dynamic baseline using a user-selected moving average type applied to closing prices over the specified length period, then calculates the standard deviation to measure price dispersion:
basis = ma(close, length, maType)
stdev = ta.stdev(close, length)
The core Z-Score calculation quantifies how many standard deviations the current price sits above or below the moving average basis, creating a normalized oscillator that facilitates cross-asset and cross-timeframe comparisons:
zScore = stdev != 0 ? (close - basis) / stdev : 0
smoothedZ = ma(zScore, smooth, maType)
The adaptive threshold mechanism employs percentile calculations over a historical lookback period to determine statistically significant extreme zones. Rather than using fixed levels like ±2.0, the indicator identifies where a specified percentage of historical Z-Score readings have fallen, automatically adjusting to market regime changes:
upperThreshold = adaptive ? ta.percentile_linear_interpolation(smoothedZ, percentilePeriod, upperPercentile) : fixedUpper
lowerThreshold = adaptive ? ta.percentile_linear_interpolation(smoothedZ, percentilePeriod, lowerPercentile) : fixedLower
The visualization architecture creates a four-tier coloring system that distinguishes between extreme conditions (beyond the adaptive thresholds) and moderate conditions (between the midpoint and threshold levels), providing visual gradation of statistical significance through opacity variations and immediate recognition of distribution extremes.
🟢 How to Use This Indicator
▶ Overbought and Oversold Identification:
The indicator identifies potential overbought conditions when the smoothed Z-Score crosses above the upper threshold, indicating that price has deviated to a statistically extreme level above its mean. Conversely, oversold conditions emerge when the Z-Score crosses below the lower threshold, signaling statistically significant downward deviation. In adaptive mode (default), these thresholds automatically adjust to the asset's historical behavior, i.e., during high volatility periods, the thresholds expand to accommodate wider price swings, while during low volatility regimes, they contract to capture smaller deviations as significant. This dynamic calibration reduce false signals that plague fixed-level oscillators when market character shifts between volatile and ranging conditions.
▶ Mean Reversion Trading Applications:
The Z-Score framework excels at identifying mean reversion opportunities by highlighting when price has stretched too far from its statistical equilibrium. When the oscillator reaches extreme bearish levels (below the lower threshold with deep red coloring), it suggests price has become statistically oversold and may snap back toward the mean, presenting potential long entry opportunities for mean reversion traders. Symmetrically, extreme bullish readings (above the upper threshold with bright green coloring) indicate potential short opportunities or long exit points as price becomes statistically overbought. The moderate zones (lighter colors between midpoint and threshold) serve as early warning areas where traders can prepare for potential reversals, while exits from extreme zones (crossing back inside the thresholds) often provide confirmation that mean reversion is underway.
▶ Trend and Distribution Analysis:
Beyond discrete overbought/oversold signals, the histogram's color pattern and shape reveal the underlying trend structure and distribution characteristics. Sustained periods where the Z-Score oscillates primarily in positive territory (green bars) indicate a bullish trend where price consistently trades above its moving average baseline, even if not reaching extreme levels. Conversely, predominant negative readings (red bars) suggest bearish trend conditions. The distribution shape itself provides insight into market behavior, e.g., a narrow, centered distribution clustering near zero indicates tight ranging conditions with price respecting the mean, while a wide distribution with frequent extreme readings reveals volatile trending or choppy conditions. Asymmetric distributions skewed heavily toward one side demonstrate persistent directional bias, whereas balanced distributions suggest equilibrium between bulls and bears.
▶ Built-in Alerts:
Seven alert conditions enable automated monitoring of statistical extremes and trend transitions. Enter Overbought and Enter Oversold alerts trigger when the Z-Score crosses into extreme zones, providing early warnings of potential reversal setups. Exit Overbought and Exit Oversold alerts signal when price begins reverting from extremes, offering confirmation that mean reversion has initiated. Zero Cross Up and Zero Cross Down alerts identify transitions through the neutral line, indicating shifts between above-mean and below-mean price action that can signal trend changes. The Extreme Zone Entry alert fires on any extreme threshold penetration regardless of direction, allowing unified monitoring of both overbought and oversold opportunities.
▶ Color Customization:
Six visual themes (Classic, Aqua, Cosmic, Ember, Neon, plus Custom) accommodate different chart backgrounds and aesthetic preferences, ensuring optimal contrast and readability across trading platforms. The bar transparency control (0-90%) allows fine-tuning of visual prominence, with minimal transparency creating bold, attention-grabbing bars for primary analysis, while higher transparency values produce subtle background context when using the oscillator alongside other indicators. The extreme and moderate zone coloring system uses automatic opacity variation to create instant visual hierarchy, with darkest colors highlight the most statistically significant deviations demanding immediate attention, while lighter shades mark developing conditions that warrant monitoring but may not yet justify action. Optional candle coloring extends the Z-Score color scheme directly to the price candles on the main chart, enabling traders to instantly recognize statistical extremes and trend conditions without needing to reference the oscillator panel, creating a unified visual experience where both price action and statistical analysis share the same color language.
Centered Oscillators

ZLSMA AO Session Strategy by kernchentradingStrategy Logic
Trend Filter:
The ZLSMA is used to determine the prevailing short-term direction. Long signals are only considered when price is above the ZLSMA, while short signals are only considered when price is below it.
Momentum Confirmation:
The Awesome Oscillator is used to detect momentum shifts. Entries occur only when a multi-period sequence of rising or falling AO values is present, indicating the start of a new impulse.
Entries:
Long: Positive momentum in the AO combined with price trading above the ZLSMA
Short: Negative momentum in the AO combined with price trading below the ZLSMA
Only one position per direction is held at any time.
Exits:
Positions are closed when momentum weakens according to the AO or when a predefined pip threshold is reached.
Trading Hours:
The strategy uses a time filter and trades only during specified hours to avoid periods of low liquidity.
Parameters
ZLSMA length and offset
Position size (volume)
Timeframe and Notes:
I trade Gold using this strategy on the 5-minute and 15-minute charts. In flat, sideways market conditions, the ZLSMA has weaknesses. In such cases, it can be helpful to use an additional trend strength indicator (e.g., TSI). In general, the greater the distance between price and the ZLSMA, the more reliable the signal tends to be.

ADX Trend IndicatorThe Average Directional Index (ADX) is commonly known in English as the "Trend Strength Indicator" or "ADX Trend Strength Indicator".It measures the strength of a trend (regardless of direction: up or down), not the direction itself. Traders often call it a "trending ADX" or simply "ADX for trend" when focusing on its role in identifying strong trending markets (typically when ADX > 25).Quick Overview in English:ADX > 25 — Strong trend (good for trend-following strategies).
ADX < 20 — Weak or no trend (ranging/sideways market; avoid trend trades).
It combines with +DI (positive directional indicator) and -DI (negative directional indicator) to also show trend direction.

BK AK-IED💥 Introducing BK AK-IED — Volatility Ignition / Expansion / Detonation 💥
A pressure-to-release weapon system for traders who want timing, not noise.
Markets don’t move clean because they “feel like it.” They load, they ignite, and then they detonate into expansion. BK AK-IED is built to expose that sequence in real time—so you stop trading randomness and start trading regime shifts.
⚔️ What BK AK-IED is
BK AK-IED is a 3-speed VWMA energy oscillator that blends price movement + volume into a single pressure readout:
Fast (5) = ignition energy (range-driven)
Medium (21) = core pressure engine
Slow (55) = structural volatility backdrop
It’s not a “direction oracle.” It’s an energy meter that tells you when the market is coiling, when it’s waking up, and when it’s breaking out with force.
🧠 Core Weapon Systems
✅ Dynamic Scaling
Keeps the oscillator readable across symbols (no ridiculous y-axis blowouts).
✅ Volatility State Bar (Bottom Strip) — Your War Room
🟨 CONTRACTION = VWMA convergence / coil / pressure loading
🟩 EXPANSION = energy spike begins
🟥 BREAKOUT = expansion without contraction (release phase)
⬜ NEUTRAL = dead zone, don’t force it
✅ Breakout Peak Icons (Crown markers)
Crowns print only when there’s true breakout energy and the move hits major peak territory versus recent extremes. Translation:
tighten risk, scale-out, stop getting greedy. These are exhaustion warnings—not automatic reversals.
Timeframe-adaptive peak filtering is built in:
< 1H: stricter peak requirement
≥ 1H: more realistic swing threshold
🧭 How to use it (execution, not opinions)
1) 🟨 Contraction = don’t bleed.
This is the chop factory. You wait. You map levels. You stalk.
2) 🟩 Expansion = prepare.
Start aligning with structure: trend framework, VWAP, key levels, HTF bias.
3) 🟥 Breakout = engage.
This is where moves pay. Trade the direction your structure supports and manage risk like a professional.
4) 👑 Peak during breakout = harvest / protect.
Scale. Tighten stops. Don’t turn winners into donations.
🧱 Inputs that matter (what you’re actually tuning)
Amplitude Multiplier = how aggressive the energy read is
VWMA Spread Contraction Threshold = how tight “coil” must be to count
Scale Lookback = how far back the dynamic scaling references
Peak Thresholds = how selective peaks are (auto-switches based on timeframe)
The “AK” in the name is an acknowledgment of my mentor A.K. His standards (patience, precision, clarity, and emotional control) are a major reason I build tools with structure instead of hype.
And above all: all praise to Gd — the true source of wisdom, restraint, and right timing.
👑 King Solomon Lens — ZENITH Discipline
Solomon didn’t build greatness by impulse. He built it by measure, order, and restraint.
When the Temple was built, the stones were prepared away from the site—so the structure went up with precision, not chaos. That is the market lesson: the decisive moment is loud, but the preparation is silent. If you only show up for the noise, you will always arrive late.
BK AK-IED is that Solomon blueprint on a chart:
🟨 Contraction is the quarry.
The market is cutting the stones in silence. This is where the undisciplined burn money “doing something.” The wise do the opposite: they reduce noise, define levels, and wait.
🟩 Expansion is the line being set.
Pressure starts to move. This is where you bring structure online—bias, levels, risk plan. Not excitement.
🟥 Breakout is the placement.
The stone drops into position. This is the only phase where aggression is righteous—because it’s backed by a real shift, not hope.
👑 Peak icons are ZENITH—crown-of-the-move logic.
Zenith is where force and momentum reach their highest point before decay begins. The crown is not “celebrate and add.” The crown is govern yourself: harvest, tighten, protect. Solomon’s edge wasn’t prediction—it was rule over the self. That’s what separates profit from punishment.
This is what wisdom looks like in trading: not guessing the future—governing your exposure when the present is telling you the truth. And may Gd bless your restraint as much as your entries, because restraint is where survival becomes power.
✅ Final
BK AK-IED is your volatility weapon for market warfare:
Load → Ignite → Detonate.
Use it with structure. Use it with discipline. And give praise to Gd for every protected loss, every clean entry, and every moment you didn’t force a trade. 🙏

ADX Coloreado por AO + DI DifferenceKey ComponentsADX line: Measures overall trend strength (non-directional).
+DI line: Strength of upward movement.
-DI line: Strength of downward movement.
Trend direction is determined by which DI line is dominant:+DI > -DI: Bullish trend (upward pressure).
-DI > +DI: Bearish trend (downward pressure).
Crossovers between +DI and -DI can signal potential trend changes, but they are most reliable when ADX confirms sufficient strength.ADX Trend Strength Levels (Common Interpretations)ADX Value
Trend Strength
Recommendation
0–20
Weak or no trend (ranging/sideways market)
Avoid trend-following strategies; consider range-bound or oscillator-based trades.
20–25
Emerging or moderate trend (gray zone)
Monitor for confirmation; potential start of trend.
25–50
Strong trend
Ideal for trend-following strategies (e.g., moving averages, breakouts).
50–75
Very strong trend
High momentum; good for riding trends, but watch for exhaustion.
75–100
Extremely strong trend (rare)
Often overextended; risk of reversal or correction.
Rising ADX: Trend is strengthening.
Falling ADX: Trend is weakening (even if still high).
Volume DI Diff + ADX Coloreado por AOInterpretationIf +DI > -DI (positive DI+ - DI- difference) → Upward trend pressure (bullish signal).
If -DI > +DI (negative DI+ - DI- difference) → Downward trend pressure (bearish signal).
Crossovers between +DI and -DI generate buy/sell signals, often filtered by ADX for reliability.
This setup is widely used in technical analysis to identify trending markets and avoid whipsaws in ranging conditions. It's part of the broader Average Directional Movement System (ADX/DMI).
Key ComponentsADX line: Measures overall trend strength (non-directional).
+DI line: Strength of upward movement.
-DI line: Strength of downward movement.
Trend direction is determined by which DI line is dominant:+DI > -DI: Bullish trend (upward pressure).
-DI > +DI: Bearish trend (downward pressure).
Crossovers between +DI and -DI can signal potential trend changes, but they are most reliable when ADX confirms sufficient strength.ADX Trend Strength Levels (Common Interpretations)ADX Value
Trend Strength
Recommendation
0–20
Weak or no trend (ranging/sideways market)
Avoid trend-following strategies; consider range-bound or oscillator-based trades.
20–25
Emerging or moderate trend (gray zone)
Monitor for confirmation; potential start of trend.
25–50
Strong trend
Ideal for trend-following strategies (e.g., moving averages, breakouts).
50–75
Very strong trend
High momentum; good for riding trends, but watch for exhaustion.
75–100
Extremely strong trend (rare)
Often overextended; risk of reversal or correction.
Rising ADX: Trend is strengthening.
Falling ADX: Trend is weakening (even if still high).
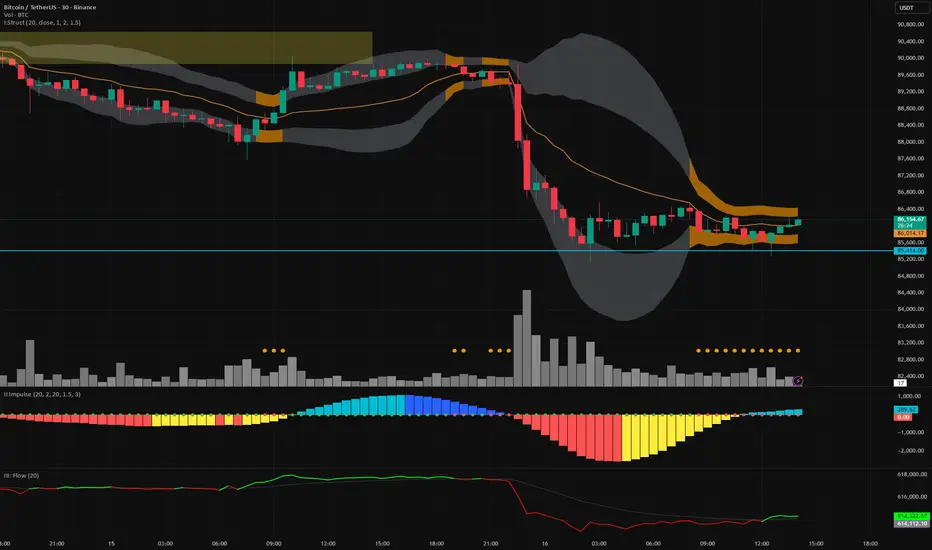
Vector Trinity indicator II: [Bottom: TTM Squeeze]**1. Introduction: The Engine of the System**
This indicator is **Part 2** of the "Vector Trinity" trading system. While Part I (Structure) defines *where* the price is, **Part II (Impulse)** defines *when* the move will happen and *how strong* it is.
It represents the **Time Dimension** of the system, focusing on momentum ignition and energy release.
* **I: Structure:** Spatial boundaries.
* **II: Impulse:** **Momentum velocity & Squeeze timing (Current Indicator).**
* **III: Flow:** Capital validation.
**2. Core Logic: Linear Regression Momentum**
Unlike standard momentum indicators (like MACD) which are based on Moving Averages and often lag significantly, **Vector Trinity II** utilizes **Linear Regression** on price deviations.
* **Math:** It calculates the distance between the price and the mean, then runs a linear regression to determine the angle of attack.
* **Benefit:** This provides a near-instantaneous reading of market "Velocity" and "Acceleration," reducing lag and allowing traders to see the turn before price fully commits.
**3. The "Squeeze" Mechanics (The Dots)**
The central line features dots that indicate the volatility state of the market:
* **🔴 Red Dot (Squeeze ON):** The Bollinger Bands have moved inside the Keltner Channels. Volatility is critically low. The market is storing energy like a compressed spring. **Action:** Wait. Do not trade yet.
* **🟢 Green Dot (Squeeze Fired):** The Bands have popped out of the Channels. The energy is releasing. **Action:** This is the "Ignition" signal. Look at the histogram color for direction.
**4. The 4-Color Momentum System**
The histogram bars are color-coded to tell the full story of the trend's lifecycle, not just direction:
* **Bullish Territory (Above 0):**
* **🟦 Cyan (Light Blue):** **Bullish Acceleration.** Buyers are aggressive. Momentum is increasing. (Best for entry).
* **🔷 Blue (Dark Blue):** **Bullish Deceleration.** Buyers are tired. Momentum is fading. (Prepare to take profit).
* **Bearish Territory (Below 0):**
* **🟥 Red:** **Bearish Acceleration.** Sellers are aggressive. Momentum is increasing. (Best for shorting).
* **🟨 Yellow:** **Bearish Deceleration.** Sellers are exhausted. Momentum is recovering towards zero. (Warning: Trend potential reversal).
**5. How to Use**
* **Step 1:** Look for **Red Dots** on the zero line. This identifies a high-potential setup building up.
* **Step 2:** Wait for the **First Green Dot**. This is the "Squeeze Fired" signal.
* **Step 3:** Confirm with the **Histogram Color**.
* If Green Dot + **Cyan Bar** = Long Signal.
* If Green Dot + **Red Bar** = Short Signal.
* **Advanced:** Use the **Yellow Bars** as an early warning to exit short positions before price actually reverses.
**Settings:**
* **Length:** 20 (Standard calculation period).
* **BB/KC Mult:** 2.0 / 1.5 (Standard ratios to define the Squeeze).
* **Smoothing:** Enabled (Default 3) to reduce noise and provide clearer color transitions.
---
### **中文说明**
**1. 简介:系统的核心引擎**
本指标是“矢量三位一体”交易系统的 **第二部分**。如果说第一部分 (Structure) 定义了价格*在哪里*,那么 **第二部分 (Impulse)** 则定义了行情*何时*启动以及力度*有多强*。
它代表了系统的 **时间维度**,专注于动能的点火与能量释放。
* **I: Structure 结构:** 空间边界。
* **II: Impulse 脉冲:** **动能速度与挤压时机(本指标)。**
* **III: Flow 流向:** 资金验证。
**2. 核心逻辑:线性回归动能**
传统的动能指标(如 MACD)通常基于移动平均线,存在显著的滞后性。**Vector Trinity II** 采用了基于价格偏离度的 **Linear Regression (线性回归)** 算法。
* **数学原理:** 它计算价格与均值的距离,并通过回归分析确定攻击的角度。
* **优势:** 这提供了几乎零滞后的市场“速度”与“加速度”读数,允许交易者在价格完全反转之前看到动能的拐点。
**3. “挤压”机制 (圆点信号)**
0轴上的圆点指示了市场的波动率状态:
* **🔴 红点 (Squeeze ON):** 布林带完全进入了肯特纳通道内部。波动率极低。市场像被压缩的弹簧一样在积蓄能量。**操作:** 等待,不要急于进场。
* **🟢 绿点 (Squeeze Fired):** 布林带扩张冲出通道。能量开始释放。**操作:** 这是“点火”信号。观察柱状图颜色以确定方向。
**4. 四色动能战术系统**
柱状图通过四种颜色讲述了趋势完整的生命周期,而不仅仅是涨跌:
* **多头区域 (0轴上方):**
* **🟦 青色 (Cyan):** **多头加速。** 买盘积极,动能增强。(最佳进场期)
* **🔷 蓝色 (Blue):** **多头减速。** 买盘疲惫,动能衰减。(准备止盈)
* **空头区域 (0轴下方):**
* **🟥 红色 (Red):** **空头加速。** 卖盘积极,动能增强。(最佳做空期)
* **🟨 黄色 (Yellow):** **空头减速。** 卖盘力竭,动能向0轴修复。(警告:趋势可能反转/抄底信号)
**5. 使用方法**
* **第一步:** 寻找0轴上的 **红点**。这标志着一个高爆发潜力的机会正在酝酿。
* **第二步:** 等待 **第一个绿点** 出现。这是“挤压释放/点火”的信号。
* **第三步:** 结合 **柱状图颜色** 确认。
* 绿点 + **青色柱** = 做多信号。
* 绿点 + **红色柱** = 做空信号。
* **进阶用法:** 利用 **黄色柱** 作为空单止盈的先行指标,往往在价格反弹之前,动能就已经变黄了。
**参数设置:**
* **Length (周期):** 20 (标准计算周期)。
* **BB/KC Mult (倍数):** 2.0 / 1.5 (定义挤压状态的标准比率)。
* **Smoothing (平滑):** 开启 (默认3) 以减少噪音,提供更平滑的颜色转换体验。
Kinetic RSI [Vel + Accel] + AlertsThe Problem with Standard RSI
Most traders use the Relative Strength Index (RSI) to see if a market is "Overbought" (above 70) or "Oversold" (below 30). The problem? A strong trend can stay overbought for days, burning short sellers, or an asset can stay oversold while price continues to crash. Standard RSI tells you where the price is, but it doesn't tell you how hard it is moving.
The Solution: Kinetic RSI
This script reimagines RSI by applying basic physics concepts: Velocity and Acceleration.
Instead of asking "Is RSI below 30?", this indicator asks: "Is RSI below 35 AND did it just make a violent, high-speed turn upwards?"
It filters out lazy, drifting price action and only signals when momentum is accelerating in a new direction.
How It Works (The Math)
Velocity: We calculate the speed of the RSI change (Current RSI - Previous RSI).
Acceleration: We calculate if that speed is increasing (Current Velocity - Previous Velocity).
The Trigger: A signal is only generated if the RSI is in an extreme zone (<35 or >65) AND it has high Velocity AND positive Acceleration.
How to Trade It
1. The "Kick" Signals (Background Highlights)
🟢 Green Background (Bullish Kick): The RSI was low, but buyers stepped in aggressively. The momentum is not just positive; it is accelerating upward. This is often a "V-Bottom" catch.
🔴 Red Background (Bearish Kick): The RSI was high, but sellers slammed the price down. Momentum is accelerating downward.
2. The Line Color
Lime Line: Velocity is positive (Momentum is rising).
Fuchsia Line: Velocity is negative (Momentum is falling).
Usage: If the background flashes Green (Buy Signal), but the line turns back to Fuchsia (Red) a few bars later, the move has failed—exit the trade.
Settings & Alerts
RSI Length: Standard 14 (Adjustable).
Velocity Threshold: Controls sensitivity.
Lower (e.g., 2-3): More signals, catches smaller reversals.
Higher (e.g., 5+): Fewer signals, catches only massive "shocks" to the price.
Alerts Included: You can set alerts for "Bullish Kick," "Bearish Kick," or "Any Kick" to get notified of volatility spikes.
Best Practices
Wait for the Close: This indicator measures the closing velocity. Always wait for the bar to close to confirm the background color signal.
Trend Filtering: This works best as a "Reversal" indicator. If the market is in a super-strong uptrend, ignore the Bearish (Red) signals and only take the Bullish (Green) dips.

ICT Immediate RebalanceThe ICT Concept, whereby as soon as it is created, the price makes a strong movement in its favor, requires two "Wicks" to coincide at the same level or for there to be an overlap of no more than 2 Pips, a function that this Indicator fulfills to detect them.

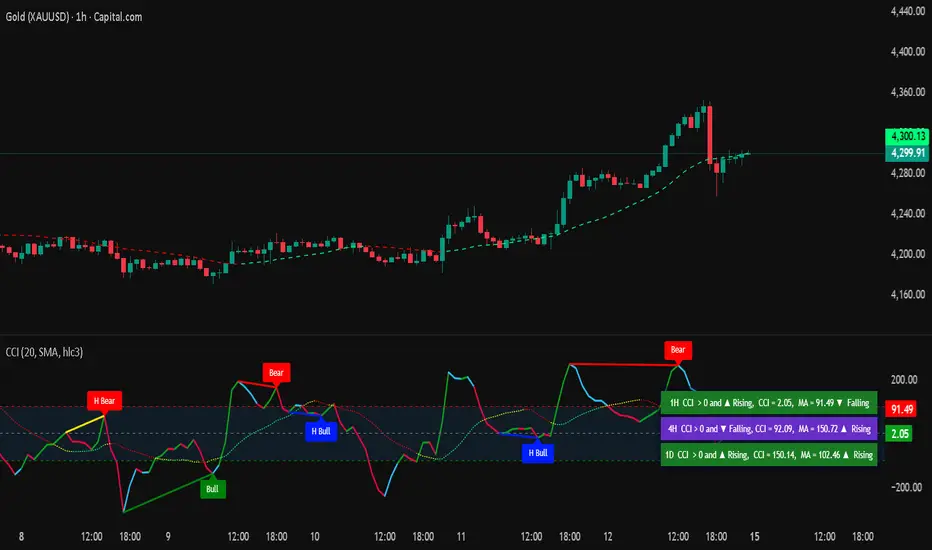
Commodity Channel IndexThe Commodity Channel Index (CCI) is a technical indicator that measures the strength of the momentum in the market, it is calculated using a Moving average (default 20 SMA, users can change the legth and the type of the MA from dashboard) using formula: cci = (src - ma) / (0.015 * ta.dev(src, ccilength)).
When CCI is under -100 that indicates a strong downtrend, and above +100 level a strong uptrend, above 0 level a bullish trend start and bellow 0 level bearish momentum.
Crossing back above -100 and bellow + 100 levels not means it is a reversal of the trend, could be just a pullback or a bounce before trend continuation.
The indicator display on the main chart a color coded moving average with the length and type selected by users for CCI calculation.
The CCI Moving average and the CCI lines in oscillator are both color coded :
1. CCI and MA both red = > Bearish trend
2. CCI and MA both green = > Bullish trend
3. MA color turn yellow or the CCI turn blue that means a possible consolidation will be next or trend change.
4 type of Divergences are detected by the script Bullish, Bearish, Hidden Bullish and Hidden bearish divergences, users can setup alarms for them, by default the divergences ae not displayed, users need to select them to be displayed on the oscillator.
A table displaying the vurrent timeframe and 2 higher timeframes of the stats of CCI and its MA.
There are 13 alerts that users can setup akarms:
Alert for Regular Bullish Divergence
Alert for Hidden Bullish Divergence
Alert for Regular Bearish Divergence
Alert for Hidden Bearish Divergence
Alert for CCI Back Above -100
Alert for CCI Back Bellow 100
Alert for CCI Extreme Overbought
Alert for CCI Extreme Oversold
Alert for trend change by CCI MA => Moving Average Color turned to yellow, that means sideways or possible trend change
Alert for CCI Crossing Above CCI MA
Alert for CCI Crossing Bellow CCI MA
Alert for cci Crossing Above 0
Alert for CCI Crossing Bellow 0
3SPC Three Candle Price Action Setup3SPC (Three Candle Price Action Setup) is an open-source indicator designed to detect
a simple and clearly defined three-candle price action pattern.
The logic is based on the following structure:
• The first two candles move in the same direction (bullish or bearish).
• The third candle interacts with the real bodies of both previous candles,
which may indicate a short-term liquidity sweep or price reaction.
• A bullish setup is confirmed when price holds above the open of the first candle.
• A bearish setup is confirmed when price holds below the open of the first candle.
This script does not use oscillators or lagging indicators.
It is intended as a visual aid for discretionary traders and should be used
together with market context, risk management and higher timeframe analysis.
The script is published as open-source for educational and transparency purposes.
UI Labels Translation:
- نمایش ستاپ صعودی: Show bullish setups
- نمایش ستاپ نزولی: Show bearish setups

VEGA (Velocity of Efficient Gain Adaptation)VEGA (Velocity of Efficient Gain Adaptation)
VEGA is a momentum oscillator that measures the velocity of an efficiency-weighted adaptive moving average. Unlike traditional momentum indicators that react uniformly to all price movements, VEGA intelligently adapts its sensitivity based on market conditions—responding quickly during trending periods and filtering noise during consolidation.
--------------------------------
What Makes VEGA Different
Efficiency-Driven Adaptation
At its core, VEGA uses the Efficiency Ratio (ER) to distinguish between trending and choppy markets. When price moves efficiently in one direction, VEGA's underlying adaptive MA speeds up to capture the move. When price chops sideways, it slows down to avoid whipsaws. This creates a momentum reading that's inherently cleaner than fixed-period alternatives.
Linear Regression Smoothed Source
VEGA offers an optional LinReg-smoothed price source that blends regular candles with linear regression values. This pre-smoothing reduces noise before it ever enters the calculation, resulting in a histogram that's easier to read without sacrificing responsiveness. The mix ratio lets you dial in exactly how much smoothing you want.
Z-Score Normalization with Dead Zone
Rather than arbitrary oscillator bounds, VEGA normalizes output as standard deviations from the mean. This gives statistically meaningful levels: readings above +2σ or below -2σ represent genuinely extreme momentum. The configurable dead zone (with Snap, Soft Fade, or None modes) filters out insignificant movements near zero, keeping you focused on signals that matter.
--------------------------------
How It Works
1. Source Preparation — Price is smoothed via a LinReg/regular candle blend
2. Efficiency Ratio — Measures directional movement vs total movement over the lookback period
3. Adaptive MA — Applies variable smoothing based on efficiency (fast during trends, slow during chop)
4. Velocity — Calculates the rate of change of the adaptive MA
5. Normalization — Converts to Z-Score (standard deviations) or ATR-normalized percentage
6. Dead Zone — Optionally filters near-zero values to reduce noise
--------------------------------
How To Read VEGA
Signal and Interpretation
Histogram above zero | Bullish momentum
Histogram below zero | Bearish momentum
Bright color | Momentum accelerating
Faded color | Momentum decelerating
Beyond ±1σ bands | Above-average momentum
Beyond ±2σ bands | Extreme momentum (potential reversal zone)
Zero line cross*| Momentum shift
--------------------------------
Key Settings
ER Length — Lookback for efficiency ratio calculation. Higher = smoother, slower adaptation.
Fast/Slow Smoothing — Controls the adaptive MA's responsiveness range. The MA blends between these based on efficiency.
LinReg Settings — Enable smoothed candles and adjust the blend ratio (0 = regular candles, 1 = full LinReg, 0.5 = 50/50 mix).
Z-Score Lookback — Period for calculating mean and standard deviation. Shorter = more reactive normalization.
Dead Zone Type — How to handle near-zero values:
Snap — Hard cutoff to zero
Soft Fade — Gradual reduction toward zero
None — No filtering
Dead Zone Threshold — Values within this Z-Score range are affected by the dead zone setting.
VEGA works on any timeframe and any market. For best results, adjust the ER Length and LinReg settings to match your trading style and the volatility characteristics of your instrument.

SB - RSI EW OscillatorAdd EW with RSI.
Makes sense take a call if RSI is above 50 and EW turns green and vice versa.


Take Profit XTake Profit X
Take Profit X solves the #1 problem in trading: knowing when to exit. Instead of guessing or using single indicators, it aggregates 8 technical signals to identify high-probability exit points through multi-confirmation consensus. This eliminates premature exits and emotional decision-making.
The indicator counts confirmations from your chosen technical tools:
Green dot = Multiple signals say "take profit on longs/exit shorts"
Red dot = Multiple signals say "take profit on shorts/exit longs"
Signals appear when you reach the minimum confirmations threshold you set.
Possible Settings:
Conservative (Swing Trading)
pine
Minimum Confirmations: 4
Use: RSI, MACD, CCI, Supertrend, Price Action
Disable: Stochastic, Bollinger Bands, EMA Cross
Look Back Bars: 10
Aggressive (Day Trading)
pine
Minimum Confirmations: 2
Use: All indicators ON
Look Back Bars: 3-5
RSI OB/OS: 75/25
Balanced (Most Markets)
pine
Minimum Confirmations: 3
Use: RSI, MACD, CCI, Supertrend
Price Action: ON
Look Back Bars: 5-7

Ultimate Adaptive RSIUltimate Adaptive RSI
RSI That Adapts to Any Market
This isn't your grandpa's RSI. It dynamically adjusts its sensitivity based on market conditions—smoother in trends, responsive in ranges.
Traditional RSI fails in strong trends and changing volatility. UA-RSI fixes both by adapting its sensitivity in real-time, giving you reliable signals whether the market is trending, ranging, or transitioning between regimes.
How It Adapts:
Smart Pre-Smoothing: Uses Efficiency Ratio to detect trend strength and automatically lengthens/shortens its smoothing window.
Dominant Cycle Detection: Matches its internal period to the market's actual rhythm.
Dynamic Bands: RMS-based overbought/oversold levels that expand/contract with volatility.
Smoothing Stack: ALMA pre-smoothing → Ultimate Smoother → Jurik filter creates the cleanest RSI you've ever seen.
Trade Signals:
Buy: RSI crosses above lower band or midline + price confirms
Sell: RSI crosses below upper band or midline + price confirms
Bands expand in high volatility → wait for deeper extremes
Bands contract in low volatility → take earlier signals
Signal line for crossover entries
Adaptive smoothing = fewer false signals in trends
Day trading: Use 1.0 band multiplier
Swing trading: Use 1.2-1.5 multiplier
Ranging markets: Lower multiplier to 0.8
Trending markets: Raise multiplier to 1.5+
Bands widen in volatility = wait for deeper extremes
Bands tighten in calm markets = take earlier signals
Never trade RSI alone - always wait for price confirmation

VixTrixVixTrix - Because markets move in both directions.
VixTrix was born from a fundamental limitation in traditional volatility indicators: they only measure downside panic, completely missing the greed-driven extremes that form market tops.
How It Works:
Dual-Component Analysis:
vixBear = Panic selling intensity (distance from recent highs)
vixBull = FOMO buying intensity (distance from recent lows)
Oscillator = vixBear - vixBull = Net fear/greed imbalance
When the oscillator is positive, fear dominates (potential bottom forming). When negative, greed dominates (potential top forming).
Professional-Grade Filtering:
The magic happens with the symmetric RMS (Root Mean Square) bands. Unlike fixed percentage bands or standard deviation, RMS:
Creates mathematically symmetric positive/negative thresholds
Naturally adapts to changing volatility regimes
Provides statistical significance to extremes
VixTrix also adds selectable MA smoothing for the RMS calculation:
WMA (default): Balanced – middle-ground approach
VWMA: Volume-weighted – filters low-volume noise
EMA: Responsive – catches quick reversals
SMA: Stable – for swing trading
HMA: Fast and smooth – ideal for day trading
Signals require triple confirmation:
Statistical Extreme: Oscillator beyond RMS band
Price Action Confirmation: Correct candle color (bullish for bottoms, bearish for tops)
Momentum Continuation: Oscillator still moving toward extreme (exhaustion)
This multi-filter approach reduces premature entries and false signals while maintaining early positioning at potential reversal points.
Why This Matters for Your Trading:
In bull markets, traditional fear indicators sit near zero, giving no warning of impending tops.
VixTrix identifies when greed becomes excessive – when FOMO buying reaches statistical extremes that often precede corrections.
In range-bound markets, VixTrix excels at identifying overreactions in both directions, providing high-probability mean reversion opportunities.
During crashes, it captures the panic selling with the same precision as VixFix, but with better timing through its momentum confirmation.
VixTrix spots continuations through:
"No Signal" = Healthy Trend – Oscillator stays between RMS bands (no exhaustion)
Failed Extremes – Touches band but no triple confirmation = trend likely continues
Hidden Divergence – Price makes higher low while oscillator makes shallower low = uptrend continues
Controlled Emotions – Oscillator negative but not extreme in uptrends (greed present but not excessive)
Key Insight: When VixTrix doesn't give a signal during a pullback, institutions aren't panicking – they're just pausing before resuming the trend.
Green columns = Bullish exhaustion (potential bottoms)
Red columns = Bearish exhaustion (potential tops)
Golden RMS bands = Dynamic thresholds adapting to current volatility
Background highlights = Active signal conditions
The Result: A professional-grade oscillator that works in all market conditions – trending up, trending down, or ranging – by measuring the complete emotional spectrum driving price action.

DeltaPulseDeltaPulse: Professional Cumulative Volume Delta Indicator
DeltaPulse is a free cumulative volume delta (CVD) indicator engineered for modern traders who demand precision, adaptability, and visual clarity. Unlike traditional CVD tools that often suffer from scaling issues, excessive noise, or poor responsiveness across timeframes, DeltaPulse delivers a streamlined, professional-grade solution that "just works" – providing actionable insights into buying and selling pressure with minimal setup.
This indicator accumulates the net difference between buying and selling volume (inferred from candle direction), normalizes it intelligently for consistent readability, and applies advanced smoothing to filter out market noise while preserving momentum signals. The result is a clean, momentum-colored line in a dedicated pane, enhanced by subtle visual cues that highlight key market dynamics.
Whether you're a day trader scalping intraday moves, a swing trader analyzing weekly trends, or an institutional analyst reviewing futures contracts, DeltaPulse adapts seamlessly to your workflow. It's designed to be your go-to tool for confirming trends, spotting divergences, and identifying order flow imbalances – all without the bloat of overcomplicated features.
Key Features
Intelligent Normalization for Universal Compatibility
Automatically adjusts scaling based on chart timeframe and symbol volume profile.
Intraday (1-5 min): Uses a 100-period volume average for responsive, lively signals.
Intraday (15+ min): 50-period average for balanced sensitivity.
Daily/Weekly+: 20-period average for clean, long-term perspective.
Ensures the indicator remains visually meaningful and non-flat on any asset – from low-volume penny stocks to high-liquidity indices like ES or NQ.
Advanced Smoothing Options
Six moving averages to match your trading style:
EMA - Quick reactions to recent delta shifts
SMA - Simple Moving Average - Stable, noise-resistant baseline
WMA - Weighted Moving Average - Emphasizes recent data with linear weighting
HMA - Hull Moving Average - Ultra-smooth yet lag-free – ideal for momentum trading
RMA - Running Moving Average (Wilder's) - Trend-following with minimal whipsaws
VWMA - Volume-Weighted Moving Average - Highlights high-volume delta moves
Lower values increase reactivity; higher values enhance smoothness.
Flexible Reset Mechanisms
Session Reset: Clears CVD at the first regular trading bar each day – perfect for intraday analysis.
Weekly Reset: Resets at the start of each new week – suited for swing and position trading.
No manual intervention required; the indicator handles resets reliably across all timeframes.
Background Shading:
Light green tint above zero; light red below.
Extreme highlights when smoothed CVD exceeds 90% of its 80-bar high/low – flags potential exhaustion or absorption zones.
How It Works
DeltaPulse calculates a simple yet effective volume delta on each bar:
Bullish Bar (close ≥ open): Adds full volume as positive delta.
Bearish Bar (close < open): Subtracts full volume as negative delta.
This raw delta accumulates into a running total (CVD), resetting based on your chosen mode. The total is then:
Normalized against a timeframe-adaptive volume average to ensure consistent scaling.
Smoothed using your selected MA type for noise reduction and trend clarity.
Plotted with momentum-based coloring and visual enhancements.
The output is a single, intuitive line that reveals the underlying battle between buyers and sellers – far more reliably than raw volume bars or basic oscillators.
Trading Applications
DeltaPulse shines in revealing order flow dynamics that price action alone often conceals. Here are proven ways to integrate it:
Trend Confirmation & Momentum Trading
Bullish Setup: Rising green line above zero confirms buyer control – enter longs on pullbacks to support.
Bearish Setup: Falling red line below zero signals seller dominance – short on rallies to resistance.
Zero Line Crosses as Reversal Signals
A crossover from negative to positive territory often marks a sentiment shift – use for entry triggers.
Combine with volume spikes or key levels for high-probability setups.
Enhancement: VWMA mode amplifies signals on high-volume breakouts.
Absorption & Exhaustion Zones
Watch for extreme background highlights: A spike to highs followed by reversal suggests large players absorbing supply.
Ideal for fade trades near overextended levels (e.g., after news events).
Avoid low-volume or illiquid symbols, as delta inference relies on reliable candle data.
Timeframe-Agnostic: Solves the common CVD pitfall of being "dead" on intraday charts or erratic on daily ones through smart, automatic normalization.
Lag-Free Responsiveness: The default HMA smoothing strikes a rare balance – smoother than EMA, faster than SMA – without the computational overhead of exotic filters.
Zero Clutter: No histograms, no extraneous plots, no overwhelming alerts. Just pure, distilled order flow intelligence.

Session Range Control [PointAlgo]Session Range Control (SRC)
The Session Range Control (SRC) indicator provides a structured view of intraday price behavior by tracking where the current price sits within the session’s high–low range and how today’s volatility compares to the Average Daily Range (ADR). It combines range analytics, momentum context, volatility interpretation, and visual cues to help traders understand session strength and shifts in intraday conditions.
Core Concept
Every trading session forms a unique high and low. SRC continuously reads these values and calculates the Position in Range, expressed on a scale from 0% to 100%:
0% → Price at Day Low
100% → Price at Day High
50% → Mid-range equilibrium
By normalizing price into a percentage, traders can quickly interpret where market pressure is concentrated during the session.
Trend Zones and Market State
SRC divides the range into logical zones to show the likely sentiment of the session:
1. Strong Uptrend Zone (Above Threshold)
When price consistently holds above the user-defined upper threshold (e.g., 60%), the indicator marks a Strong Uptrend.
This typically reflects:
Persistent intraday buying pressure
Price acceptance near the upper part of the range
Reduced likelihood of deep pullbacks
2. Strong Downtrend Zone (Below Threshold)
When price remains below the lower threshold (e.g., 40%), SRC signals a Strong Downtrend, indicating:
Dominant intraday selling
Consistent pressure keeping price near session lows
3. Bullish / Bearish Zones
Between the midline and strong thresholds, SRC displays softer trend zones:
Above 50% = Bullish Zone
Below 50% = Bearish Zone
These zones help classify whether price is trending, balanced, or drifting.
4. Neutral Territory
When price hovers around the mid-level without conviction, the indicator treats it as a neutral or undecided phase.
Signal Logic :
SRC includes built-in momentum shift signals based on range transitions:
Long Signal
Triggered when price crosses upward through 50%, often showing:
A shift from intraday weakness to strength
Buyers gaining control of the session
Short Signal
Triggered when price crosses downward through 50%, suggesting:
Loss of intraday strength
Sellers taking control
These signals help highlight potential turning points inside the session.
Extreme Levels :
SRC highlights the top and bottom 10% of the range:
> 90% = Extreme High (Overbought intraday condition)
< 10% = Extreme Low (Oversold intraday condition)
These conditions can be useful for identifying overextended movements or potential reaction zones.
ADR Comparison and Volatility Context :
The indicator also measures how today’s price range compares to the Average Daily Range (ADR):
Range Expanding: Today’s range is significantly larger than the ADR
Indicates heightened volatility
Often associated with trending or breakout environments
Range Compressing: Today’s range is much smaller
Suggests low volatility
Common before breakout phases
Characteristic of consolidation or balanced markets
This volatility context helps traders assess whether the session is behaving within normal boundaries or deviating significantly.
Dashboard Overview :
When enabled, the dashboard summarizes key intraday metrics in a structured table:
Trend status (Strong Uptrend, Strong Downtrend, Bullish, Bearish, Neutral)
Range position (%)
Signal status (Long Cross, Short Cross, Extreme High/Low, or None)
Day range calculation
Range vs ADR (%)
Day High / Day Low
Current price level
Simplified action label based on current conditions
This provides a quick reference system to interpret both trend and volatility at a glance without analyzing the full chart visually.
Visual Elements
SRC includes:
Colored dynamic plot for easy trend recognition
Horizontal reference lines at key levels (0%, 50%, 100%, strong-trend thresholds)
Background shading during extreme zone conditions
A separate ADR comparison plot
These visuals ensure the indicator remains intuitive regardless of chart style or timeframe.
Alerts
The script includes alert conditions for:
Long cross
Short cross
Strong trend detection
Extreme high / extreme low
These allow users to automate notifications during key market events without manually monitoring the chart.
Customization Options
Users can configure:
ADR length
Strong trend thresholds
Dashboard visibility
Dashboard position on chart
This makes SRC adaptable to different trading instruments and intraday styles.
Usage Notes
Works best on intraday timeframes where session boundaries are clearly defined.
Designed for analytical interpretation—trend bias, volatility phase, and range structure.
Can complement other tools such as moving averages, volume, or market structure analysis.
Disclaimer :
This indicator is intended for chart analysis and educational purposes only.
It does not generate financial, investment, or trading advice.
Users should validate signals with additional research and apply proper risk management.

Friday-Monday Pattern Backtest (Market Rebellion)Tests the "Friday-Monday Pattern" popularized by Tom Hougaard / Market Rebellion.
PATTERN LOGIC:
• When Friday's high is LOWER than Thursday's high (setup condition)
• Then Friday's low is often revisited on the following Monday
WHAT THIS INDICATOR SHOWS:
• Orange background highlights valid setup bars (Thu-Fri-Mon)
• Red horizontal line marks Friday's low (the target level)
• Green "SUCCESS" label = Monday hit Friday's low
• Red "FAIL" label = Monday did not reach Friday's low
• Stats table (top-right) shows total setups, successes, and success rate
USE THIS TO:
• Backtest the pattern on any daily chart (works best on indices, forex, futures)
• Verify the claimed "overwhelming" tendency statistically
• Identify which markets/timeframes show the highest success rate
CREDITS:
Pattern idea from Tom Hougaard / Market Rebellion: x.com
Indicator by BacktestBay for transparent pattern verification.
USAGE NOTES:
• Must be applied to DAILY charts
• Uses time_close("D") for accurate day-of-week detection on forex pairs
• No trading signals - purely for statistical backtesting

SCOTTGO Advanced MACD🌟 Custom MACD: Enhanced Visuals & Crossover Signals
This indicator is a highly customized version of the traditional Moving Average Convergence Divergence (MACD) oscillator, designed to provide clear, immediate visual confirmation of signal line crossovers and zero-line crossings.
Core Features:
MACD Crossover Shadow Fill: The area between the MACD line and the Signal line is filled with a customizable shadow. This instantly visualizes whether the MACD is above (bullish crossover) or below (bearish crossover) the Signal line.
Signal Crossover Markers (Arrows & Dots):
Crossover Dot: A small, configurable solid dot is plotted exactly at the point where the MACD and Signal lines intersect, providing pinpoint accuracy for the crossover event.
Crossover Arrows: Customizable up (green) and down (red) arrows are plotted using a small numerical offset from the crossover point, ensuring visibility without cluttering the indicator lines.
Zero-Line Crossing Markers: Distinct, small markers (circles/diamonds) are used to signal when the MACD line crosses the zero line, indicating a shift in momentum relative to the baseline.
Customizable MA Type: The user can select either Exponential Moving Average (EMA) or Simple Moving Average (SMA) for both the MACD oscillator calculation and the signal line calculation.
This indicator is ideal for traders who rely on MACD crossovers and require precise, configurable visual feedback directly on the chart.

Fractal Fade Pro IndicatorA revolutionary contrarian trading indicator that applies chaos theory, fractal mathematics, and market entropy to generate high-probability reverse signals. This indicator fades traditional technical signals, providing BUY signals when conventional indicators say SELL, and SELL signals when they say BUY.
Full Description:
Most traders follow the herd. QFCI does the opposite. It identifies when conventional technical analysis is about to fail by detecting mathematical patterns of exhaustion in market structure.
How It Works (Technical Overview):
The indicator combines three sophisticated mathematical approaches:
Fractal Dimension Analysis: Measures the "roughness" of price movements using fractal mathematics
Market Entropy Calculation: Quantifies the randomness and disorder in price returns using information theory
Phase Space Reconstruction: Analyzes price evolution in multi-dimensional state space from chaos theory
Signal Generation Process:
Step 1: Market Regime Detection
Chaotic Regime: High fractal complexity + rising entropy (avoid trading)
Trending Regime: Low fractal complexity + high phase space distance (fade breakouts)
Mean-Reverting Regime: Very low fractal complexity (fade extremes)
Step 2: Reverse Signal Logic
When traditional indicators would give:
BUY signal (breakout, oversold bounce, volatility spike) → QFCI shows SELL
SELL signal (breakdown, overbought rejection, volatility crash) → QFCI shows BUY
Step 3: Smart Signal Filtering
No consecutive same-direction signals
Adjustable minimum bars between signals
Multiple confirmation layers required
Unique Features:
1. Mathematical Innovation:
Original fractal dimension algorithm (not standard indicators)
Market entropy calculation from information theory
Phase space reconstruction from chaos theory
Multi-regime adaptive logic
2. Trading Psychology Advantage:
Contrarian by design - profits from market overreactions
Fades retail trader mistakes - enters when others are exiting
Reduces overtrading - strict signal frequency controls
3. Clean Visual Interface:
Only BUY/SELL labels - no chart clutter
Clear directional arrows - immediate signal recognition
Built-in alerts - never miss a trade
Recommended Settings:
Default (Balanced Approach):
Fractal Depth: 20
Entropy Period: 200
Min Bars Between Signals: 100
Aggressive Trading:
Fractal Depth: 10-15
Entropy Period: 100-150
Min Bars Between Signals: 50-75
Conservative Trading:
Fractal Depth: 30-40
Entropy Period: 300-400
Min Bars Between Signals: 150-200
Optimal Timeframes:
Primary: Daily, Weekly (best performance)
Secondary: 4-Hour, 12-Hour
Can work on: 1-Hour (with adjusted parameters)
How to Use:
For Beginners:
Apply indicator to chart
Use default settings
Wait for BUY/SELL labels
Enter on next candle open
Use 2:1 risk/reward ratio
Always use stop losses
For Advanced Traders:
Adjust parameters for your trading style
Combine with support/resistance levels
Use volume confirmation
Scale in/out of positions
Track performance by regime
Risk Management Guidelines:
Position Sizing:
Conservative: 1-2% risk per trade
Moderate: 2-3% risk per trade
Aggressive: 3-5% risk per trade (not recommended)
Stop Loss Placement:
BUY signals: Below recent swing low or -2x ATR
SELL signals: Above recent swing high or +2x ATR
Take Profit Targets:
Primary: 2x risk (minimum)
Secondary: Previous support/resistance
Tertiary: Trailing stops after 1.5x risk
IMPORTANT RISK DISCLOSURE
This indicator is for educational and informational purposes only. It is not financial advice. Past performance does not guarantee future results. Trading involves substantial risk of loss and is not suitable for every investor. The risk of loss in trading can be substantial. You should therefore carefully consider whether such trading is suitable for you in light of your financial condition.

CEF (Chaos Theory Regime Oscillator)Chaos Theory Regime Oscillator
This script is open to the community.
What is it?
The CEF (Chaos Entropy Fusion) Oscillator is a next-generation "Regime Analysis" tool designed to replace traditional, static momentum indicators like RSI or MACD. Unlike standard oscillators that only look at price changes, CEF analyzes the "character" of the market using concepts from Chaos Theory and Information Theory.
It combines advanced mathematical engines (Hurst Exponent, Entropy, VHF) to determine whether a price movement is a real trend or just random noise. It uses a novel "Adaptive Normalization" technique to solve scaling problems common in advanced indicators, ensuring the oscillator remains sensitive yet stable across all assets (Crypto, Forex, Stocks).
What It Promises:
Intelligent Filtering: Filters out false signals in sideways (volatile) markets using the Hurst Base to measure trend continuity.
Dynamic Adaptation: Automatically adapts to volatility. Thanks to trend memory, it doesn't get stuck at the top during uptrends or at the bottom during downtrends.
No Repainting: All signals are confirmed at the close of the bar. They don't repaint or disappear.
What It Doesn't Promise:
Magic Wand: It's a powerful analytical tool, not a crystal ball. It determines the regime, but risk management is up to the investor.
Late-Free Holy Grail: It deliberately uses advanced correction algorithms (WMA/SMA) to provide stability and filter out noise. Speed is sacrificed for accuracy.
Which Concepts Are Used for Which Purpose?
CEF is built on proven mathematical concepts while creating a unique "Fusion" mechanism. These are not used in their standard forms, but are remixed to create a consensus engine:
Hurst Exponent: Used to measure the "memory" of the time series. Tells the oscillator whether there is a probability of the trend continuing or reversing to the mean.
Vertical Horizontal Filter (VHF): Determines whether the market is in a trend phase or a congestion phase.
Shannon Entropy: Measures the "irregularity" or "unpredictability" of market data to adjust signal sensitivity.
Adaptive Normalization (Key Innovation): Instead of fixed limits, the oscillator dynamically scales itself based on recent historical performance, solving the "flat line" problem seen in other advanced scripts.
Original Methodology and Community Contribution
This algorithm is a custom synthesis of public domain mathematical theories. The author's unique contribution lies in the "Adaptive Normalization Logic" and the custom weighting of Chaos components to filter momentum.
Why Public Domain? Standard indicators (RSI, MACD) were developed for the markets of the 1970s. Modern markets require modern mathematics. This script is presented to the community to demonstrate how Regime Analysis can improve trading decisions compared to static tools.
What Problems Does It Solve?
Problem 1: The "Stagnant Market" Trap
CEF Solution: While the RSI gives false signals in a sideways market, CEF's Hurst/VHF filter suppresses the signal, essentially making the histogram "off" (or weak) during noise.
Problem 2: The "Overbought" Fallacy
CEF Solution: In a strong trend (Pump/Dump), traditional oscillators get stuck at 100 or 0. CEF uses "Trend Memory" to understand that an overbought price is not a reversal signal but a sign of trend strength, and keeps the signal green/red instead of reversing it prematurely. Problem 3: Visual Confusion
CEF Solution: Instead of multiple lines, it presents a single, color-coded histogram featuring only prominent "Smart Circles" at high-probability reversal points.
Automation Ready: Custom Alerts
CEF is designed for both manual trading and automation.
Smart Buy/Sell Circles: Visual signals that only appear when trend filters are aligned with momentum reversals.
Deviation Labels: Automatically detects and labels structural divergences between price and entropy.
Disclaimer: This indicator is for educational purposes only. Past performance does not guarantee future results. Always practice appropriate risk management.
