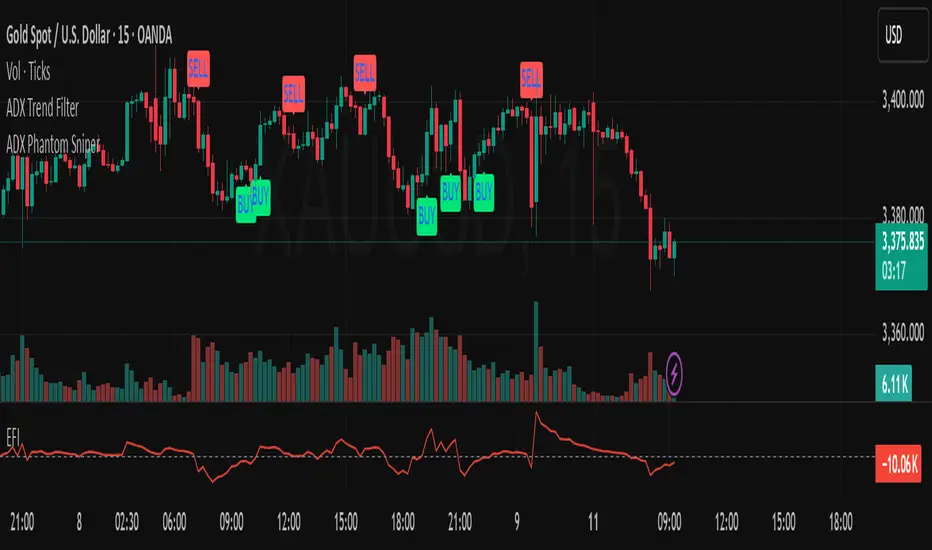
ADX Phantom SniperADX Phantom Sniper is a precision trend-following tool that combines three powerful forces:
1. ADX & DI Crossover Trigger – Detects strong directional moves only when the trend strength exceeds a defined threshold.
2. Multi-Timeframe (MTF) Confirmation – Executes on the current chart timeframe (e.g., M15) only if the higher timeframe (H1) confirms the same trend direction.
3. Force Index Momentum Filter – Filters entries based on bullish/bearish momentum to avoid weak signals.
Signal Logic:
BUY: EMA14 > EMA100, price above EMA14, +DI crosses above -DI, ADX > threshold, Stochastic crosses above signal line in the bullish zone (>50), MTF trend aligned, Force Index > 0 (optional).
SELL: EMA14 < EMA100, price below EMA14, -DI crosses above +DI, ADX > threshold, Stochastic crosses below signal line in the bearish zone (<50), MTF trend aligned, Force Index < 0 (optional).
Features:
Noise filtering with trend structure + higher timeframe alignment
On-chart BUY/SELL labels for easy signal spotting
Optional Force Index filter toggle
Adjustable ADX threshold, EMA lengths, Stochastic settings, and higher timeframe choice
Suitable for scalping and swing entries depending on timeframe
Recommended Setup:
Primary chart: M15
Higher timeframe confirmation: H1
Combine with your preferred risk management rules.
Disclaimer:
This tool is for educational purposes only and is not financial advice. Past performance does not guarantee future results. Use at your own risk.
Forceindex
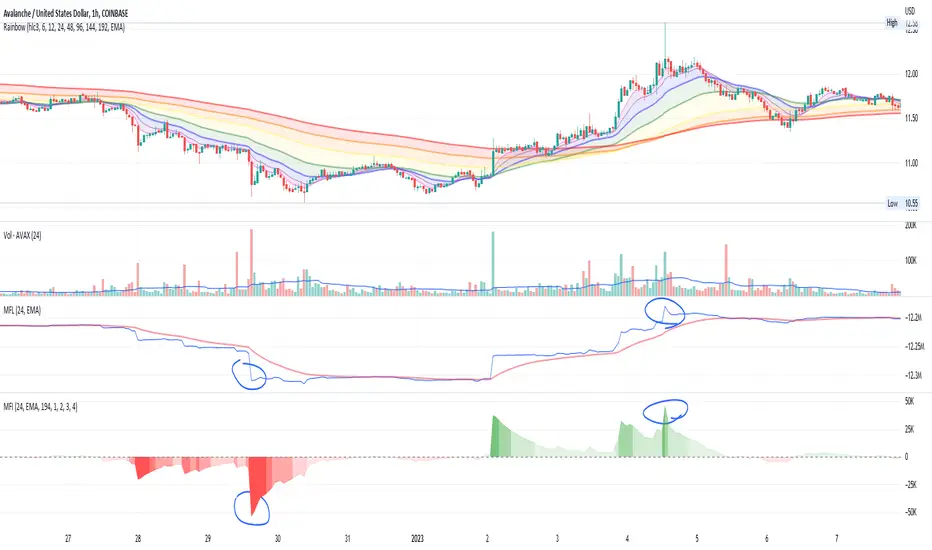
Money Flow IntensityThis indicator works very similarly to Elder's Force Index (EFI) and builds on top of what I have for the Money Flow Line (see my other scripts). It combines price movements with volume to create sort of "dollar flow" pressure up and down, looking for "smart money" ("big money") to make their move.
The indicator uses a lookback period to calculate a standard deviation of the movement intensity, then creates gradients to visualize how intense the movement is relative to other movements. This helps measure the pull away from the average more easily than with the Money Flow Line alone.
Much like with EFI, high intensity moves can indicate two things:
1. Strength and conviction in the current direction OR...
2. A reversal is coming soon
You can also watch for waning volume in the current direction, indicating that a trend is losing interest and may be due for a pullback.
There is no way to know, but combining this with price action and a trend indicator can help give you some good educated guesses about what could happen next. Combine with averaging in or out and managing risk appropriately. Good luck :)
[UPRIGHT Trading] Trend Direction Force Index (TDFI)The Trend Direction Force Index, TDFI or TDF Index, is a staple in the Forex community, but is excellent on most asset (i.e. stock) trading.
Developed by Pyotr Wojdyo for metastock trading platform originally, but now on several other.
The idea of the TDFI is that there is enough trend directional force to enter the trade.
How it works:
When the signal is above the high threshold, the trader can go long.
When the signal is below the low threshold, the trader can go short.
It's usually used as confirmation along with another indicator.
Features:
Fully customizable
Built-in color changing
Alerts!
If you like this, you will definitely like what else I've published.
Like, follow, support, etc.
Enjoy.
Cheers,
Mike
(UPRIGHT Trading)

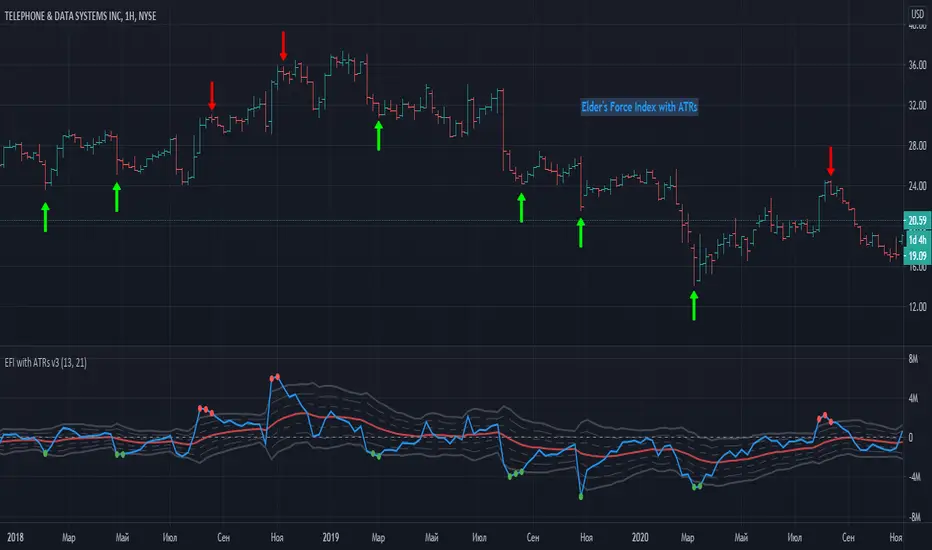
Elder Force Index With ATR ChannelsInspired by the new version of the "Force Index" announced by Dr. Alexander Elder a few years ago - "Elder Force Index With ATR Channels".
Unfortunately original version of script only works on MetaTrader platforms, so this is an attempt to
implement this great idea on TradingView too.
------------------------------------------------------------------------------------------------------------------------------------------------------------------------
Here is original script explanation by Dr. Elder himself
-------------------------------------------------------------------
Adding Average True Range (ATR) channels to Force Index had been suggested by Kerry Lovvorn.
Adding these channels turns Force Index into an excellent tool for identifying intermediate tops and bottoms.
Force Index with ATR channels does not catch all turns, but the ones it identifies deserve very serious attention.
Note: the word “true” in Average True Range refers to dealing with price gaps. Since there are no gaps in Force Index, here ATR is the same as the Average Range.
Whenever the Force Index rises above or falls below its 3-ATR channel, it signals that the ticker has reached an area of an unsustainable extreme.
That’s where rallies and declines become exhausted and prices tend to reverse. This is one of very few tools that are equally efficient in calling both top and bottom areas.
In our experience, these signals work especially well on the weekly charts.
Of course, users are welcome to experiment with them in any timeframe.
One possible option is to use the new Force Index with ATR Channels on your weekly charts and the original Force Index on your daily chart.
------------------------------------------------------------------------------------------------------------------------------------------------------------------------
- The Force Index is drawn in blue with a thick line.
- The Averaged Force is a solid red line.
- The upper and lower bands at 1 ATR are drawn in dotted lines.
- The upper and lower bands at 2 ATR use dashed lines.
- The upper and lower bands at 3 ATR are solid gray lines.
- Red dots placed above the plot when the EMA of Force Index rises above the 3-ATR channel.
- Green dots placed underneath the plot when that EMA declines below the 3-ATR channel.
***** Original script programmed to truncate values at the 4-ATR level to prevent any extreme value from flattening the rest of the plot -
- I'm not yet implemented this feature here - hopefully coming soon.
Force Index with Advanced Features [Quant_]This is the traditional Force Index indicator developed by Alexander Elder and described in his book "Trading For a Living" . As you probably know, the Force Index measures the amount of power used to move the price of an asset. The formula is pretty simple - the difference between the current and the previous close is multiplied by the volume of the current close. However, I wanted to add some additional features to the indicator, so that you have more control over it. Improvements include:
- Choose the length of the Force Index
- Choose the time frame of the FI (you can choose a smaller time frame and get a more detailed overview);
- Smoothing of the results through a Moving Average (Simple, Exponential, Weighted, Running or Hull);
- Choose the time frame of the smoothing MA for even greater control;
- Color changing depending on the increasing or decreasing smoothed Force Index;
I used to use Force Index for spotting divergences and exhaustions and it worked pretty well, but it does require some time until you get used to it. Bear in mind that you shouldn't jump against the trend on every divergence that occurs, but use it as a complementary indicator to your trading system. I am planning to add some additional features to this indicator to make it more robust, so stay tuned.
I hope you find this indicator useful. As usual, if you have any questions or suggestions on how to improve my indicators, please let me know. Thanks.

Force Index// 2020.7.30 version
// This indicator is for the second filter in Triple Screen Trading System
// force index will combine volume and price together to decide the power of price change
// force index = volume * (Change of Price)
// try to smooth the series of force index by ema force index
// Method to use this index
// This indicator is for the second filter in Triple Screen Trading System
// if Trend is bull, long when force index is below 0
// if Trend is bear, short when force index is above 0
// As for how to decide bullish market or bearish market, please check it according to the first filter of Triple Screen Trading System

Force IndexWhat is the force index ?
The force index is an oscillator used to confirm price breakout strengths and identify potential trends.
It was popularized by A. Elder.
How the force index is computed ?
Knowing that volume is the fuel of a price movement, reliable breakouts and trend continuation are more likely to occur on high volume breakouts. This is why the force index is computed with the intensity of the price movement, and it's volume , using the formula ema13((close(n) - close(n-1)) * volume ) .
How to use the force index
An important change in the force index indicate a strong momentum in the price action.
You can read more about the force index interpretation on Investopedia
Customization
You can display the indicator as an histogram, or as a line chart.
You can change EMA length, although it's recommended to keep it at default value.

Elder's Force Index with bollinger bandsThis scripts is usefull to identify possible top or bottoms of the markets.
Red BB : Sell
Green BB : Buy

Range Force Impulse The "Range Force Impulse" indicator combines 4 useful indicators into one, freeing up chart real-estate and giving the trader insight into trend health, bull/bear commitment, range and volatility all at a glance.
The indicator consists of the following:
Direction - True Range and Average True Range columns shown above and below 0 depending on direction of the period's price
-- TR (gray) shows the current period's trading volatility
-- ATR (Impulse colors, see below) shows an EMA of TR over a specified length
-- Can be used to determine stops and targets (Example: Stop loss at prev close - ATR, Target at 2x ATR)
Index - Alexander Elder's EMA of (change(close) * volume), shows crosses above 0 (green) and below 0 (red), and intermediate signals
-- Shows bull vs. bear interest/commitment/dominance
-- Elder recommends EMA length of 2 for daily chart buy/sell signals, and 13 for weekly chart bull/bear dominance & trend direction signals
-- Intermediate signals are shown above 0 when falling (salmon), or below 0 when rising (pale yellow)
System - Range columns are colored using Alexander Elder's censorship system (green: do not short, red: do not long, blue: is up to you)
-- Shows overall trend health (Macd histogram and EMA up/down changes)

yutas_TrendDirectionForceIndexVer2.0
Indicator with custom ForceIndex.
A sign is issued when the conditions are met.
This is still going to evolve.
ForceIndexをカスタムしたインジケーター。
条件を満たした場合にサインを出します。
これはまだ進化していく予定です。

Pulse Profits+ Study v2.0Here is the updated version of our Pulse Profits+ study based on the combination of the Chande Momentum Oscillator and Elder's Force Index . This version was updated to include stop-loss and improved signals
Red background highlights mark sell signals and green highlights represent buy signals. All signals are accompanied by corresponding alerts that can be tailored for the various automated trading platforms.
All indicators can be found on our website in the bio and come with their strategy equivalents
