Pepe (PEPE): Just Had Market Structure Break, Be Careful!We just had an MSB (market structure break) on PEPE coin, which might result in a bigger movement to lower zones here.
What we are going to look for here is a possible BOS (break of structure). on smaller timeframes, which would be an ideal entry for a short position here (up until our buy entry a

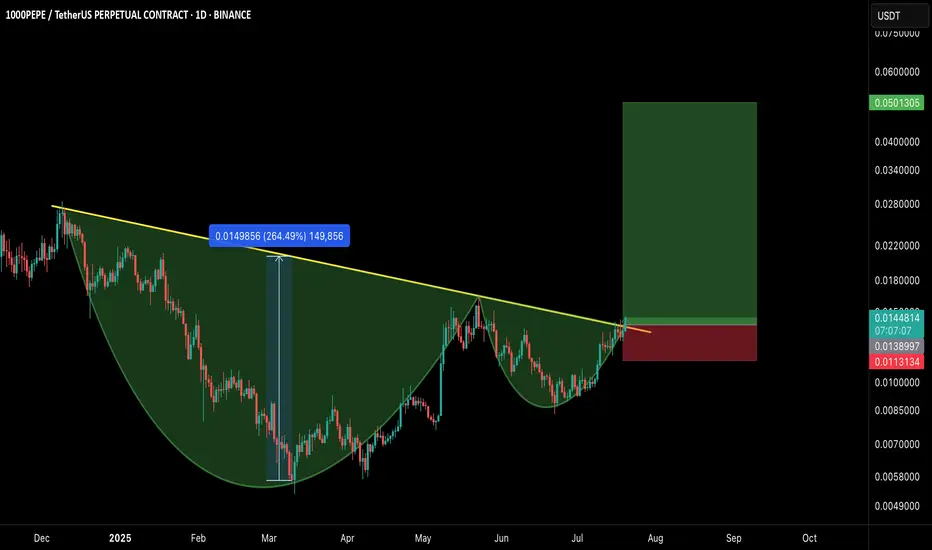
1000PEPE/USDT – CUP & HANDLE BREAKOUT!Hey Traders!
If you’re finding value in this analysis, smash that 👍 and hit Follow for high-accuracy trade setups that actually deliver!
A classic Cup and Handle formation just broke out with strong bullish confirmation, signaling the potential start of a massive trend reversal on the higher timef
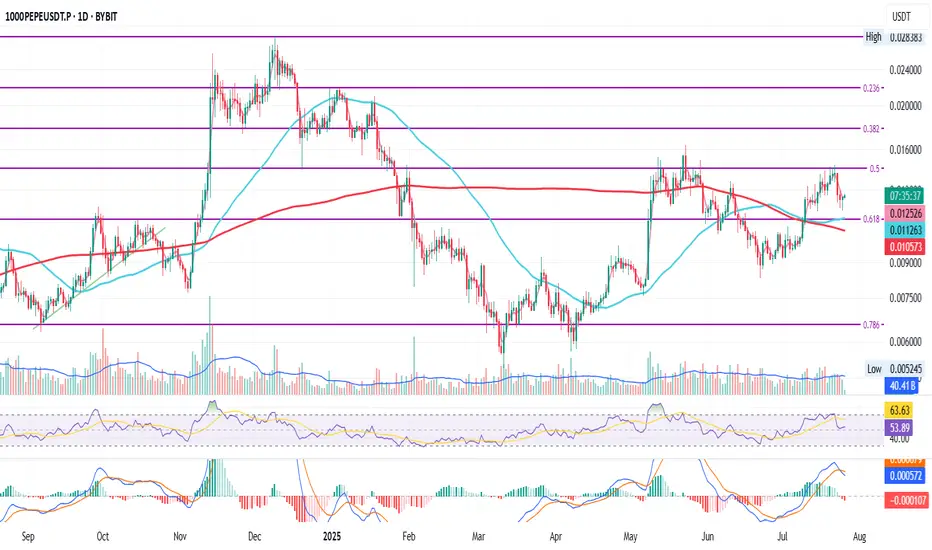
PEPE Daily Setup Holding Strong
This is PEPE on the daily
Price recently crossed above the 50MA which is currently resting on the 200MA after a golden cross
It was rejected at the 0.5 Fib but is now holding above the 0.618 Fib as well as the 50MA and 200MA
RSI is finding support at the mid level while MACD just turned bearish

1000PEPEUDST.P LONG1000PEPEUSDT.P has broken its trendline. Time for massive longs moves!
Entry Area
.010215
SL
5-10%
TP in fib areas:
-.0113737
-.0123232
-.0132727
-.0146245
Greedy target
-.0213191
#DYOR
#TYOR
#NOT A FINANCIAL ADVICE
USE LOW LEV & MARGIN ONLY!
HAPPY TRADING!


PEPE/USDT – Falling Wedge Breakout!Hey Traders — if you're into high-conviction setups with real momentum, this one’s for you.
CRYPTOCAP:PEPE has finally broken out from the falling wedge structure on the 4H chart after weeks of consolidation. This is a bullish reversal pattern that historically leads to explosive upside moves.
✅

Pepe (PEPE): Buyers Are Slowly AccumulatingPepe coin seems to accumulate currently where buyers are preparing to form a new local high. With that being said we do not see any strong rejection but near 0.022 area which we will be setting as a target for us (as long as price hold the area above EMA)
Swallow Academy

1000PEPE (PEPE): Good Risk/Reward Trades Can Be Taken | WaitPepe coin has shown us a good upward movement recently, and we are now at a pretty crucial zone. It does not matter if we see a breakout or breakdown; we are going to wait for a perfect sign in the form of a break, which would then give us either a 1:2 RR or 1:4 RR position that we can take.
Swallo

See all ideas
Summarizing what the indicators are suggesting.
Oscillators
Neutral
SellBuy
Strong sellStrong buy
Strong sellSellNeutralBuyStrong buy
Oscillators
Neutral
SellBuy
Strong sellStrong buy
Strong sellSellNeutralBuyStrong buy
Summary
Neutral
SellBuy
Strong sellStrong buy
Strong sellSellNeutralBuyStrong buy
Summary
Neutral
SellBuy
Strong sellStrong buy
Strong sellSellNeutralBuyStrong buy
Summary
Neutral
SellBuy
Strong sellStrong buy
Strong sellSellNeutralBuyStrong buy
Moving Averages
Neutral
SellBuy
Strong sellStrong buy
Strong sellSellNeutralBuyStrong buy
Moving Averages
Neutral
SellBuy
Strong sellStrong buy
Strong sellSellNeutralBuyStrong buy
Displays a symbol's price movements over previous years to identify recurring trends.