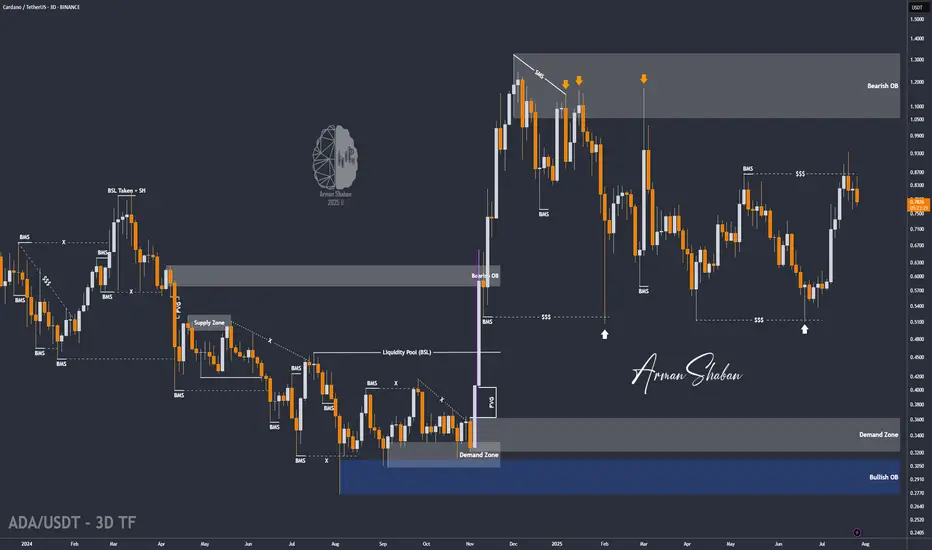
ADA/USDT | Pullback to Key Support – Can It Rebound Toward $1.32By analyzing the Cardano chart on the 3-day timeframe, we can see that after reaching $0.935, the price faced selling pressure and dropped by 18% to the $0.76 area. Now, the key is whether ADA can hold above the $0.75 level by the end of the week. If it succeeds, we could expect further bullish cont
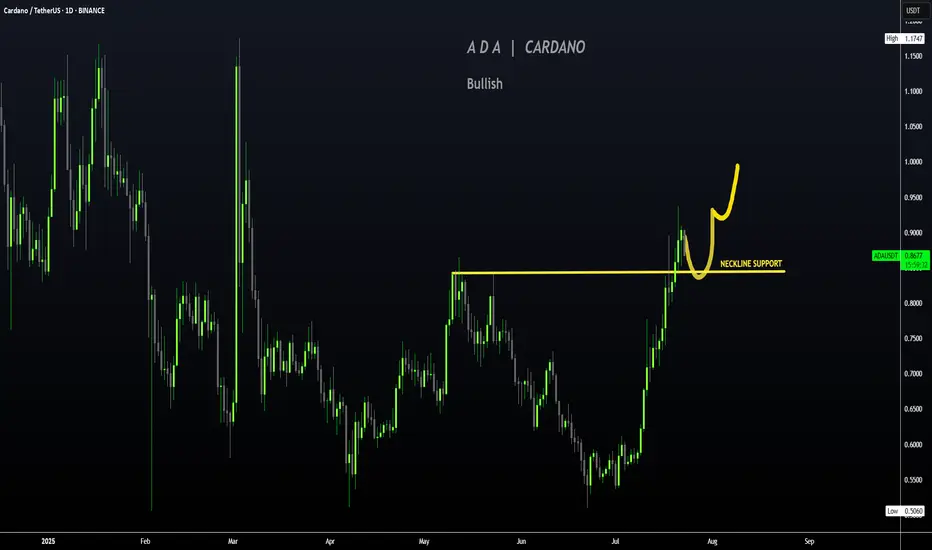
CARDANO | ADA Creeping UP to $1Cardano has made a big move in recent weeks, boasting a 77% increase.
If you were lucky enough to buy in around 30 or 40c, this may be a great TP zone:
Looking at the Technical Indicator (moving averages), we can see the price makes its parabolic increases ABOVE - which is exactly where we are c
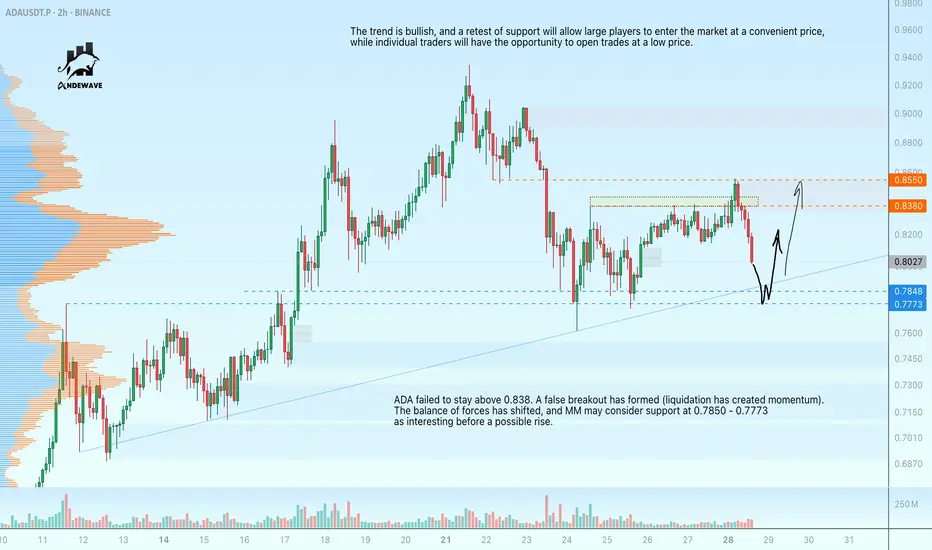
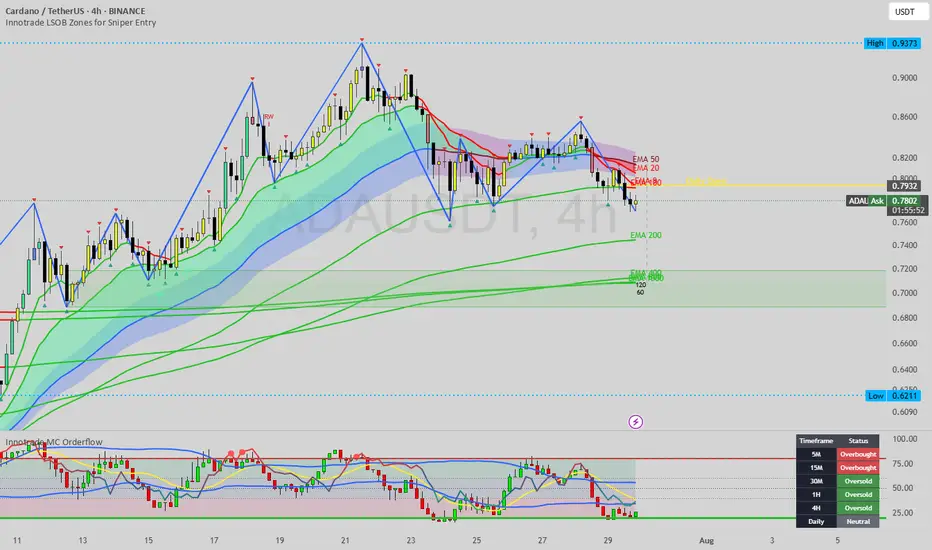
ADAUSDT - retest of support at 0.7850 before growthADA failed to stay above 0.838. A false breakout has formed (liquidation has created momentum). The balance of forces has shifted, and MM may consider support at 0.7850 - 0.7773 as interesting before a possible rise.
The trend is bullish, and a retest of support will allow large players to enter th
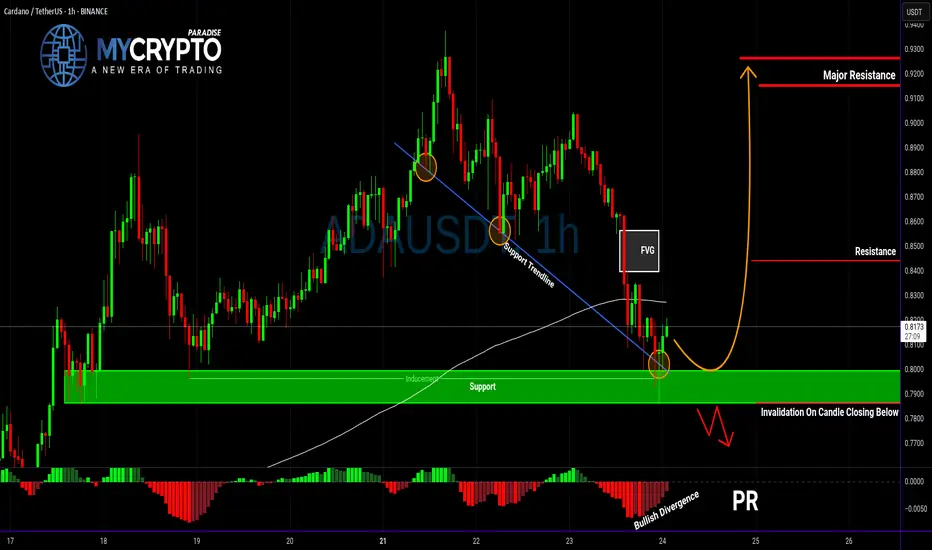
ADA About to Explode or Collapse?Yello Paradisers — is ADA gearing up for a breakout, or are we walking straight into a bull trap? After the recent pullback, the market is throwing mixed signals, but this setup is becoming too important to ignore. Here’s what we’re seeing right now on ADAUSDT.
💎ADA is currently showing positive si
Cardano Has Plenty of Room To Grow · Will Hit Beyond $4 EasilyCardano's all-time high is $3.10. Cardano is currently trading at $0.82. Pause. You will be a genius when ADA is trading at $4 if you decide to buy below $1. It is not too late. This is only the start.
Good afternoon my fellow Cryptocurrency trader, how are you feeling in this wonderful day?
The f
ADA - Time to buy again! (Update)The pattern has broken, and now I expect the price to rise to $1.20 . AB=CD.
Give me some energy !!
✨We spend hours finding potential opportunities and writing useful ideas, we would be happy if you support us.
Best regards CobraVanguard.💚
_ _ _ _ __ _ _ _ _ _ _ _ _ _ _ _ _ _ _ _ _ _ _ _ _ _ _ _ _

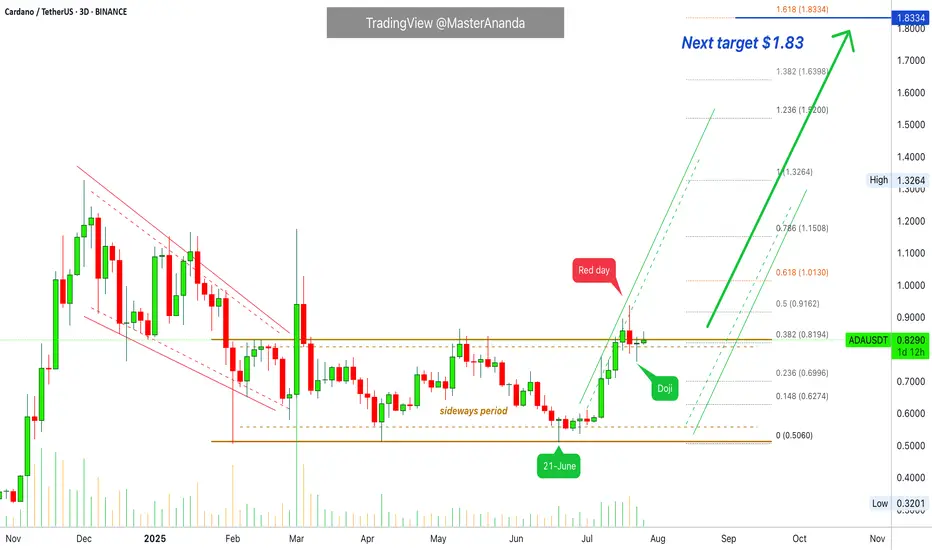
Cardano Update · Wait For New ATH Before Selling · Chart BullishI am using 3D candles. The last session is a Doji on ADAUSDT. There was a red session followed by a continuation with prices moving lower. That's last session, but it—the Doji—ended up closing green.
Sellers started to put pressure on the market and pushed prices lower (red day), by the next sessi
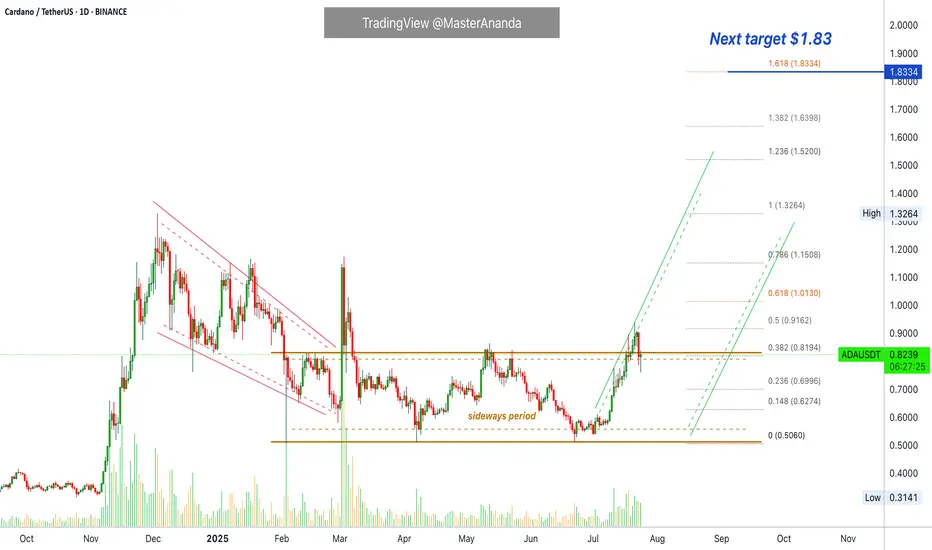
ADAUSDT - Buy or Regret!As clear and simple as the chart is… the target is just as clear and reliable.
ADA is showing strong bullish structure on the 3-day chart — breaking above the red trendline with a successful retest, and also breaking above the 100 EMA.
The blue trendline represents a strong hidden resistance level

Cardano (ADA) at Key Support: A High-Confluence "Buy" Hello, traders.
Today we are focusing on Cardano (ADA), which is currently in a strong, established uptrend. After a significant rally, the price has entered a healthy corrective phase and is now testing a critical zone of technical support. This is a classic "buy the dip" scenario shaping up.
Th
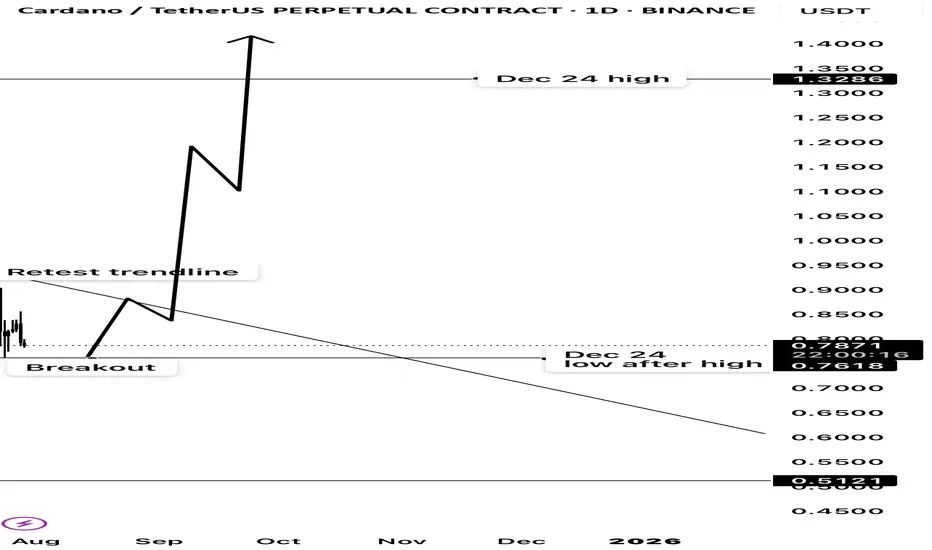
Cardano potential multi month breakout ?From december’s high cardano has been in a downtrend since.
The first low it made after the top from december had been a massive resistance.
It has risen from its 2025 lows and broke that resistance from all the way of december and retested its downtrend.
My take is, once it breaks that trendline
See all ideas
Summarizing what the indicators are suggesting.
Oscillators
Neutral
SellBuy
Strong sellStrong buy
Strong sellSellNeutralBuyStrong buy
Oscillators
Neutral
SellBuy
Strong sellStrong buy
Strong sellSellNeutralBuyStrong buy
Summary
Neutral
SellBuy
Strong sellStrong buy
Strong sellSellNeutralBuyStrong buy
Summary
Neutral
SellBuy
Strong sellStrong buy
Strong sellSellNeutralBuyStrong buy
Summary
Neutral
SellBuy
Strong sellStrong buy
Strong sellSellNeutralBuyStrong buy
Moving Averages
Neutral
SellBuy
Strong sellStrong buy
Strong sellSellNeutralBuyStrong buy
Moving Averages
Neutral
SellBuy
Strong sellStrong buy
Strong sellSellNeutralBuyStrong buy
Displays a symbol's price movements over previous years to identify recurring trends.