CBOE break out new ATH ahead20 day and 50 day moving averages converging, bounced up above AVWAP from previous high, RSI momentum, no brainer entry for me. Tight stops below 5 day moving average because that’s how I roll.
CBOE trade ideas

Short Time its going upThroughout the week, the CBO started at a low level according to the Weekly Camarilla Pivot. However, it is expected to rise initially to the High Camarilla level and then proceed further to reach the Weekly ATR level.

$CBOE with a neutral outlook following its earnings #StocksThe PEAD projected a neutral outlook for $CBOE after a negative over reaction following its earnings release placing the stock in drift C with an expected accuracy of 33.33%.

$CBOE with a Bearish outlook following its earnings #Stocks The PEAD projected a Bearish outlook for $CBOE after a Negative Under reaction following its earnings release placing the stock in drift D with an expected accuracy of 75%.

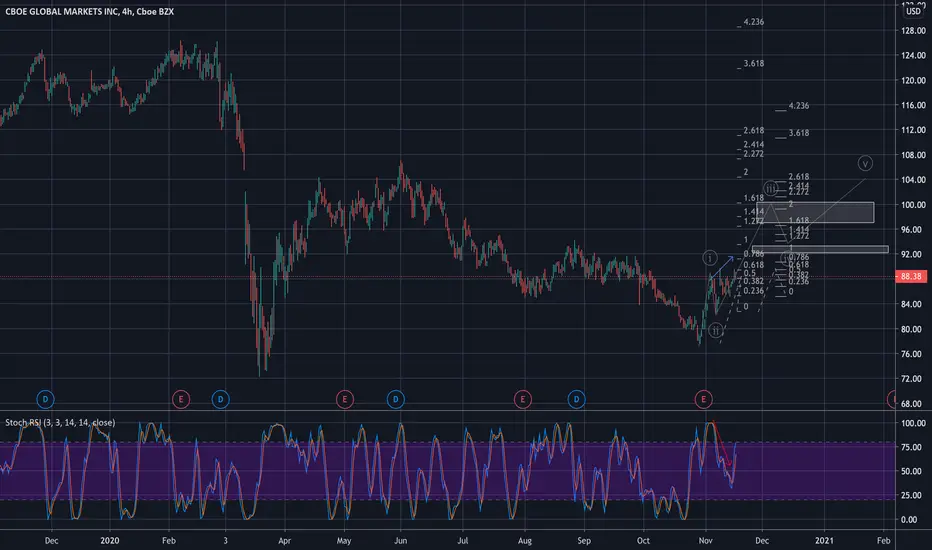
Bearish ButterflyThis W pattern lands on the 1.272 on the final leg.
Possible stop above 126.88
No recommendation

CBOE - Right ShoulderA right shoulder of an inverted Head and Shoulders pattern is yet to form along the major uptrend on this daily uptrend
This is a very bullish scenario

$CBOE with a Bearish outlook following its earnings #Stocks The PEAD projected a Bearish outlook for $CBOE after a Negative Under reaction following its earnings release placing the stock in drift D with an expected accuracy of 33.33%.

Bears haven't relinquished control yet. The bulls need to defend 50 EMA at all costs. Or this can drop more.

A Correlation Check With SPY. VIX. & CBOE.I usually perform what I like to call, "Correlation Checks". I do this on a Daily with SPY & VIX to understand when is a good time to either look for trades or sit on my hands. Whether to Play Calls or Puts, or whether or not I will decide to swing a trade overnight.
Usually VIX likes to bounce in between 15-21, so if you understand this, you can have a higher probability of "timing" the market at support of 15 and the resistance of 20-21. However this is more of a birds eye view of the correlations.
The Chicago Board Of Options Exchange(CBOE) & SPY Correlate the same while VIX moves the opposite way. Since the initial announcement of what we've titled: "When the world shut down". The market has continued to put in ATH's.
There has been a ton of volatility in the markets since then and especially since the election(Nov 3rd).
At the same time, VIX which we know is the S&P 500 Volatility Index has been printing lower highs since the election. Now closing below pre-pandemic levels as of last week. Keep in mind that VIX may find support sooner or later.
CBOE has struggled in the 130s before & SPY is creeping on a new ATH, however it was after a well extended move over the last week, which started during the 2nd week of October after the end of the month dump in September. I timed the turn nicely and went 11 for 12 on my swing trades so far in Oct. I played SPY on the way back up as well, grabbing 440 calls, 445 calls, 452 & 454 calls. It has been indeed a good month so far.
We are heading into the end of the month so things could get a little turbulent.

CBOE nice swing setup125 acting as support right now, after a few days of consolidation at that level,
This could be a good swing because we could use 125 as stop-loss or if we swing this with further expiration, we have a very well defined trendline as support

lack of vol = no confidanceCBOE will probably have a record quarter but their guidance in the face of lacking volatility could screw them on the back end of earnings. Where's the f ing volume? Where's the VIX right now? I'm obviously real pissed about the market conditions because I need delta for s**t to work better, and although this titanic could turn on a dime and trading volume ramps higher, but then CBOE's multiple is then called into question because we're likely to meltdown vs. melt up considering where the S&P is currently trading. This entire complex is bot driven. I bought some puts on $CAR the other day; that turd is more valuable today then before the pandemic. Their fleet of metal death traps has somehow gotten more valuable in the face of new legislation to ban internal combustion vehicles within 20 years, meanwhile it's got 5.4B valuation? When I entered that trade, the metrics were akin to watching gentle waves splash a sandy beach, ebb & flow, like Hal's voice in the movie 2001. Just machines calmly talking to other machines, letting the value go higher and higher.... Scary -That's just one example of this market on a no f's given machine driven autopilot loose money free-for-all. While vol remains low, paper traders getting hosed and revs will decline here. No position, but I don't like what I see. Call this one a test going forward....

Inverse Head and Shoulders Earnings 2-5 BMOLong entry is at break of neckline with an uptrend..Earnings very close so on the risky side (o:
Possible stop below 89.45
Head 77.63 LS 85 RS 84.65
Not a recommendation


CBOE 30% ~ 1-3 monthsPholesolus a great trader here on trading views had an idea titled: "When there is a gold rush you should be selling picks and shovels."
In his idea he was referring to MaryJane production stocks. When I thought of CBOE it seemed like the same thing. CBOE is most likely dealing with massive volume from the amount of trading activity going on.
Targets and SL are listed.
Trade 3/3

Cup and Handle Inverse H&SPattern valid after long entry level..
Price is close to handle low..
Mid cup is 92.37
Pattern invalidated if handle low reaches down below mid cup level
Cup low is 77.62..
Cup depth is 29.43..
Yearly high is 127.93..
Long term high is 138.54..
Inverse Head and Shoulders LS is at 85 Head is at 77.6 Rs 84.65 Neckline 94.27/Long entry with a break of the neckline in an uptrend/Targets T1: 104.5 107.35 T2: 115.4 121.3
Not a recommendation

BUY to CBOE GLOBAL MARKETS DailyHey guys, CBOE GLOBAL MARKETS is in a bearish dynamic fake with a large sell volume issued and a large upside down hammer candle. On the TIMEFRAME M1 we can see a marubozu with a large sales volume, it has escaped from the bottom of the bollinger. And is heading to its last previous low point which is just before the bottom of the consolidation zone, then do a reversal from testing. All the bollinger levels and from the top of the zone for testing also go to the VWAP. Great propability to breakout the price with a Momentum return to both the area to reach the next high. But little buying power to return to the pre-session level to test the intermediate median of ANDREWS PITCHFORK.
Please LIKE & FOLLOW, thank you!

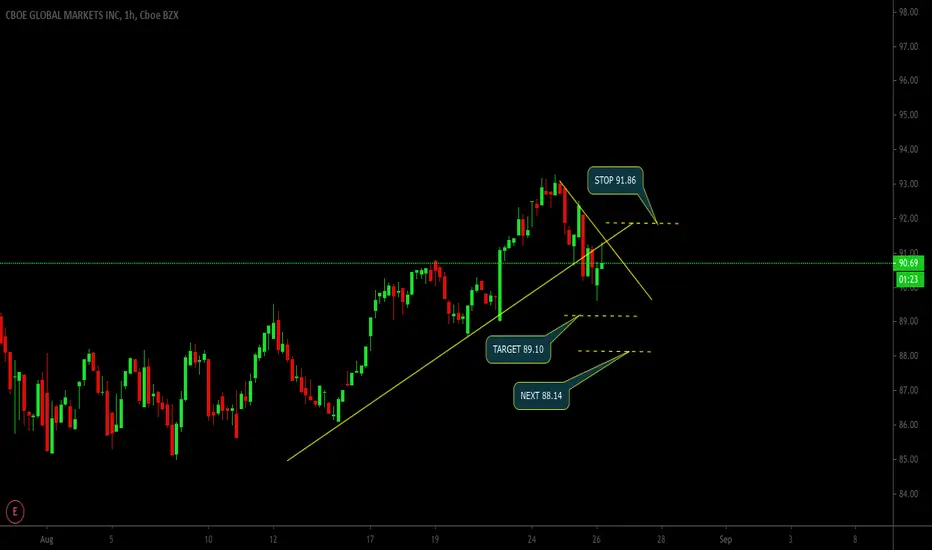
SHORT CBOE, and better R:R up to 4.27Can short now and/or wait to short around $91.40 for even better R:R.

Falling WedgeFalling wedges are often bullish and are usually found at the bottom
CBOE has been stuck inside a variety of falling wedges since the flu hit the market
CME was also in a falling wedge for a long time. These can be very long term patterns
They can signal a reversal in price
CBOE has broken upper trendline (R) of the pattern but is not quite in a clear uptrend
The Falling Wedge is a bullish pattern that begins wide at the top and contracts as prices move lower. This price action forms a cone that slopes down as the reaction highs and reaction lows converge. In contrast to symmetrical triangles, which have no definitive slope and no bias, falling wedges definitely slope down and have a bullish bias. However, this bullish bias cannot be realized until a resistance breakout occurs.
As a continuation pattern, the falling wedge will still slope down, but the slope will be against the prevailing uptrend. As a reversal pattern, the falling wedge slopes down and with the prevailing trend. Regardless of the type (reversal or continuation), falling wedges are regarded as bullish patterns.
Just an observation

CBOE-0.522*CME $CBOE CBOE Global Markets Inc vs. $CME CME GroupQuantamental Tools for Proprietary and Retail Investors.
Statistical Arbitrage Opportunities Delivered to Your Inbox.
QuantChart. io
Long 1000 $CBOE
Short 522 $CME
Mean Reversion Time: 6 Trading Days

CBOE - DAY TRADE VIEW.Refer the charts for detailed analysis ;
Go for short sell at current price and follow the mentioned stop and target level.
Thanks !!
Symmetric Triangle Falling wedgeCBOE Has broken upper trend line of falling wedge and following same pattern as CME
NV is high.
Appears to be in a long term downtrend but I see bullish components in this chart including break from falling wedge which is bullish
Not a recommendation

Falling WedgesFalling Wedges can be bullish if stock breaks up and out of the falling wedge
Found in downtrends, usually in prolonged downtrends and can signal a reversal
CME is in the process of breaking out of it's falling wedge
Not a recommendation
Good luck!
