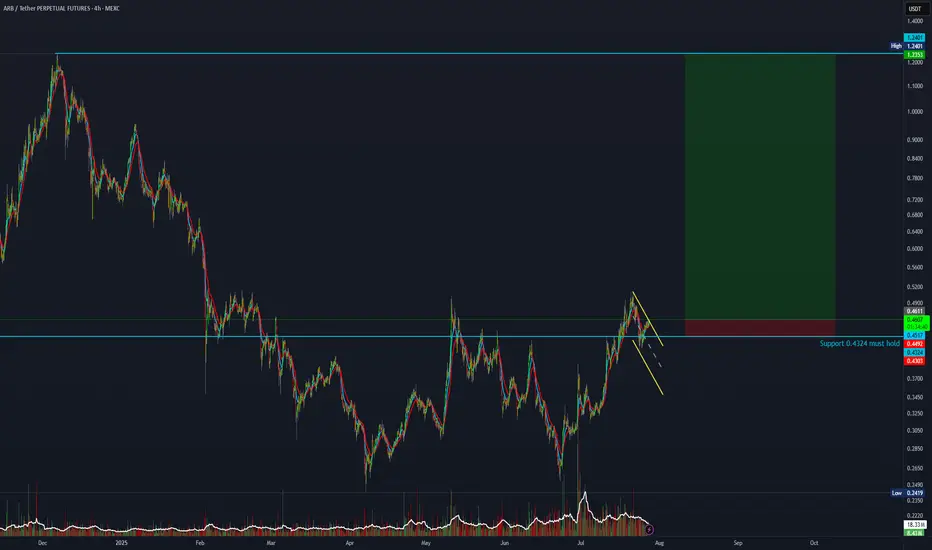
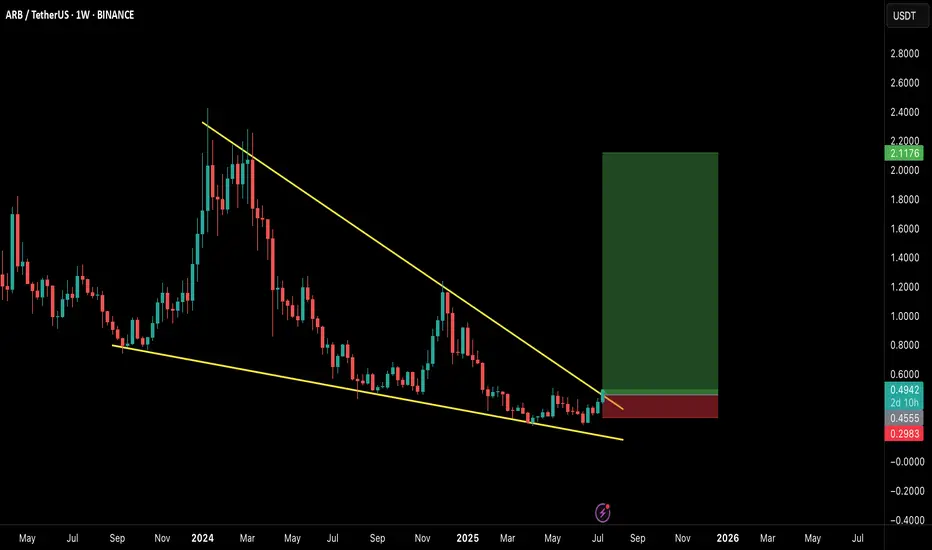
25:1 R:R trade setup on ArbitrumThis is it — a high-risk trade setup with a 25:1 R:R.
Entry: 0.4611
Stop Loss: 0.4303
Target: 1.2300
Not financial advice. Risk only 1% of your portfolio.
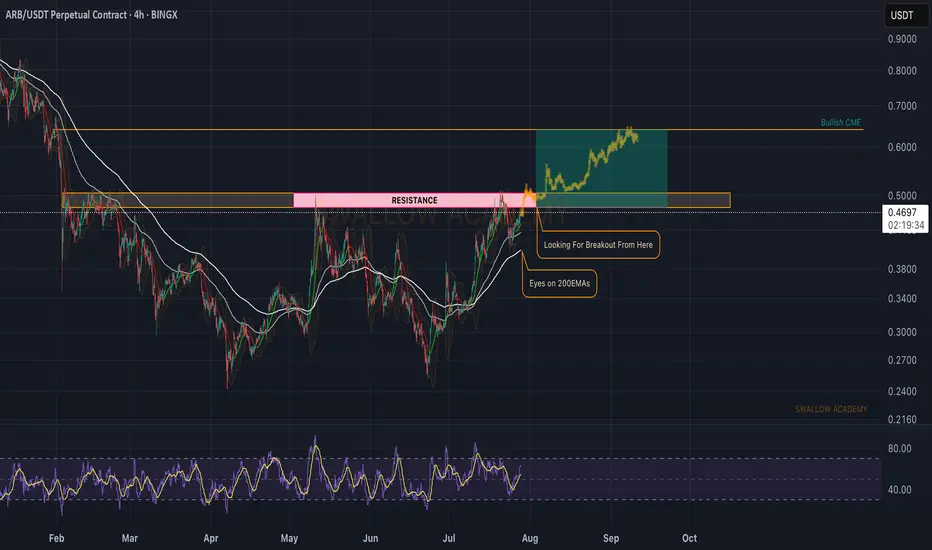
Arbitrum (ARB): Approaching Major Resistance ZoneARB is getting closer and closer to that resistance zone, which we are looking to be broken in order to give us that proper BOS and opportunity for movement to fill that bullish CME gap!
Swallow Academy
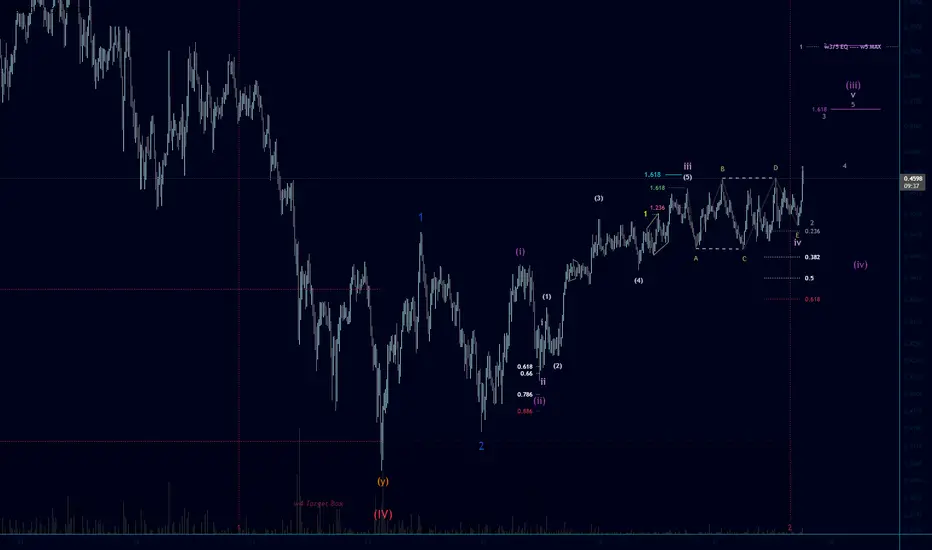
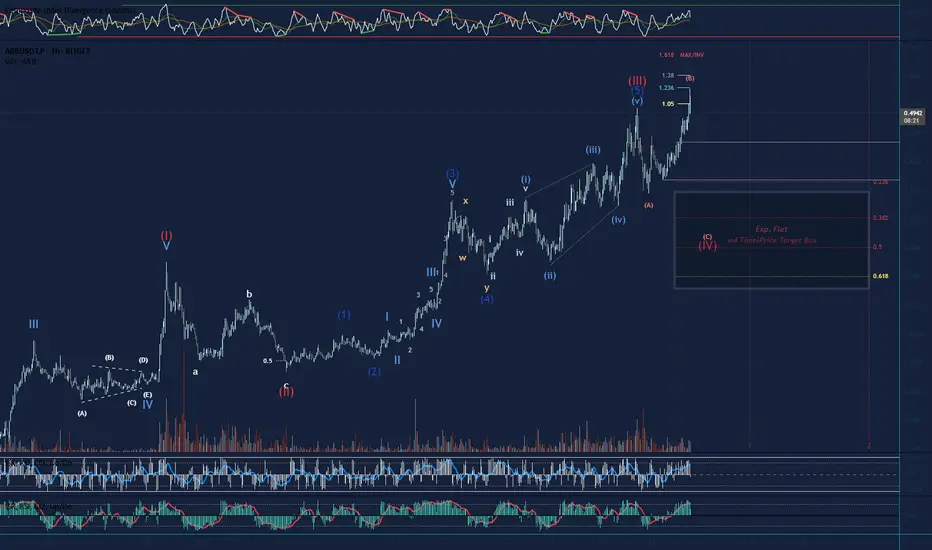
Arbitrum Bullish Elliott Wave Scenario! It seems the wave 4 Expanding Flat correction idea (previous post) played out well with our fib time and price targets! Always a good thing to have the right look in your wave count, fib time and price projections paired with the Elliott Wave rules and guidelines... its a whole other feel to my tra
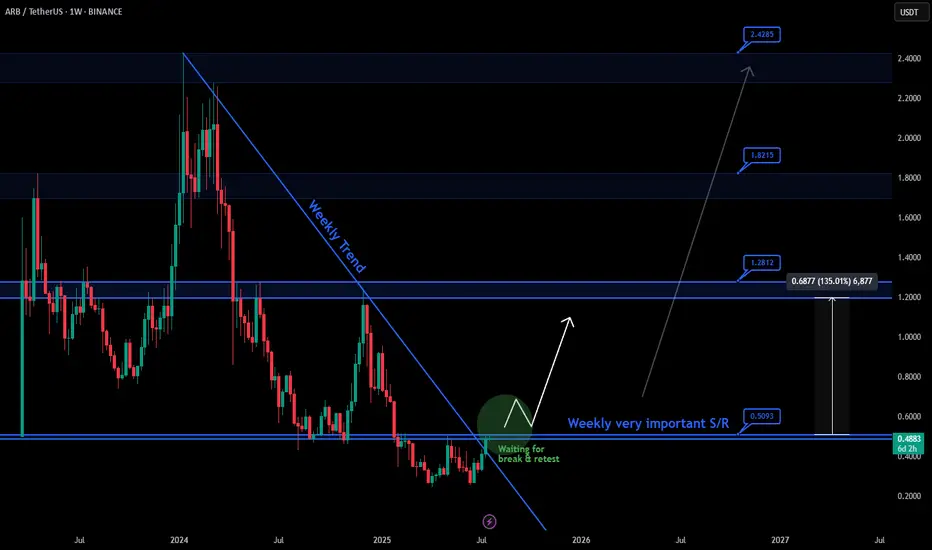
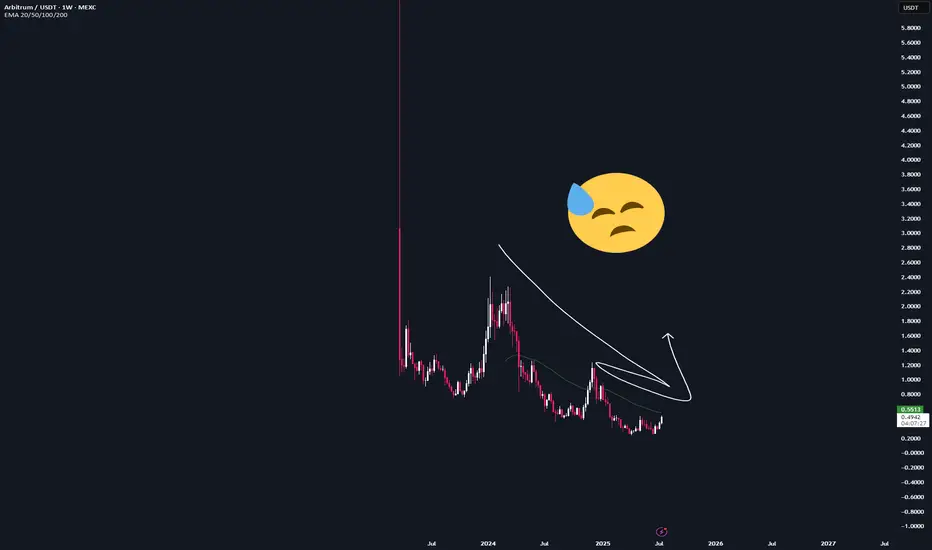
Big Move soon for Arbitrum (ARB) !, EASY 100%On the weekly chart, ARB is facing a clear long-term downtrend line. Currently, price is approaching a very important weekly resistance zone around $0.5, which has been tested multiple times.
✅ A confirmed breakout and retest above $0.5 could open the way for higher targets like 1.2$ and more ...
#ARB/USDT#ARB
The price is moving within a descending channel on the 1-hour frame, adhering well to it, and is on its way to breaking strongly upwards and retesting it.
We have support from the lower boundary of the descending channel, at 0.4550.
We have a downtrend on the RSI indicator that is about to be

#ARB/USDT Arbitrum scalp long to $ 0.5122#ARB
The price is moving within a descending channel on the 1-hour frame, adhering well to it, and is on its way to breaking strongly upwards and retesting it.
We have support from the lower boundary of the descending channel at 0.4270.
We have a downtrend on the RSI indicator that is about to be

ARB | Full-analysisHere is the top-down analysis for ARB as requested 🫡
Weekly Timeframe:
There are currently no valid bullish structures on the weekly chart, as AMEX:ARB has put in lower lows.
So we have no clear targets from a weekly perspective at this point.
Daily Chart:
A new bullish sequence was ju
ARB/USDT – Weekly Breakout Setup!Hey Traders!
If you’re finding value in this analysis, smash that 👍 and hit Follow for high-accuracy trade setups that actually deliver!
Massive Falling Wedge Breakout in Play!
ARB just confirmed a breakout from a long-term falling wedge pattern on the weekly timeframe, which has historically b
Looking to complete a wave 4 Retracement on Arbitrum Short term outlook is bearish as we are looking to complete an expanding flat to the downside. Wave B neared it invalidation, but reversed down. Lets see if the bears can push it down to the 0.5 Fib Target, soft target is the 0.382 Fib. If volume increases this could be a third up, but we need the w
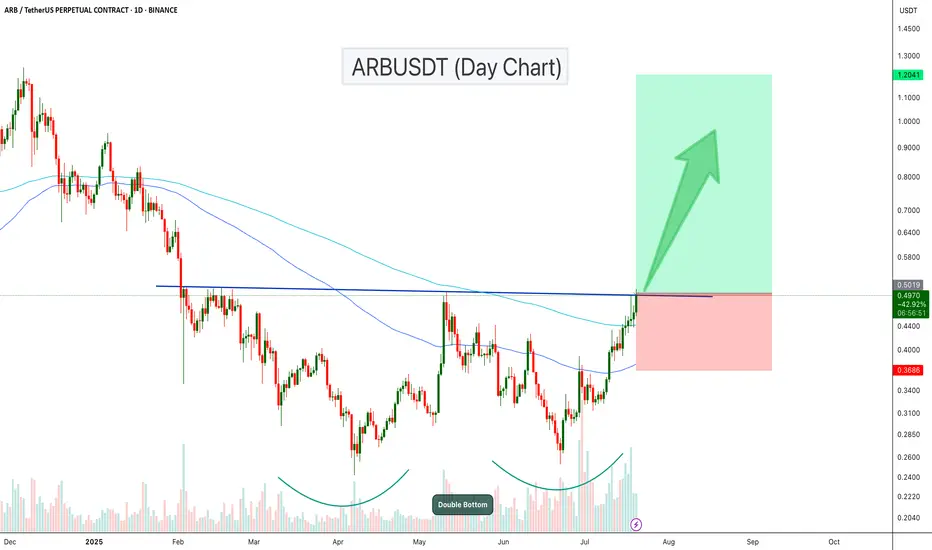
ARBUSDT Breaks Out of Double Bottom!ARB has formed a clear double bottom pattern on the daily chart, signaling a strong reversal structure. After multiple rejections, the price has now broken above the neckline resistance, confirming bullish momentum.
The breakout is also supported by increasing volume and a bullish crossover of the
See all ideas
Summarizing what the indicators are suggesting.
Oscillators
Neutral
SellBuy
Strong sellStrong buy
Strong sellSellNeutralBuyStrong buy
Oscillators
Neutral
SellBuy
Strong sellStrong buy
Strong sellSellNeutralBuyStrong buy
Summary
Neutral
SellBuy
Strong sellStrong buy
Strong sellSellNeutralBuyStrong buy
Summary
Neutral
SellBuy
Strong sellStrong buy
Strong sellSellNeutralBuyStrong buy
Summary
Neutral
SellBuy
Strong sellStrong buy
Strong sellSellNeutralBuyStrong buy
Moving Averages
Neutral
SellBuy
Strong sellStrong buy
Strong sellSellNeutralBuyStrong buy
Moving Averages
Neutral
SellBuy
Strong sellStrong buy
Strong sellSellNeutralBuyStrong buy
Displays a symbol's price movements over previous years to identify recurring trends.