ASX LimitedASX is showing resistance and support. Trade has been set that shows that this sideways trend will stay
ASX trade ideas

ASX Wyckoff DistributionWyckoff Distribution possibly on Weekly/monthly timeframe. not sure if this actually plays out but something to keep a eye on

ASX Rising wedge On the chart we can see a rising wedge formation.
The price is still moving inside the pattern. Once is breaks the support line it would be a good time to enter the short position.
Target is showing on the chart.

ASX LTDWave 4 has completed with WXY pattern composed of zigzag and flat pattern.
The next wave is 5 which is just starting to form, heading to a first Target of $90.

ASX Bullish MovePrice continues to slide bearish, 12.92% decrease from high volume Node (P.O.C).
However, previous high volume node, VRVP of $81.48 and average closing price of $81.12 seems like the fair Value of ASX:ASX. Entering low volume node territory now and the only other times in recent memory that price entered these zones were highly volatile market conditions 1) Covid 2) Inflationary issues, Ukraine war and energy concerns etc. These seem like exceptional circumstances for these zones. Also, when price dropped to these zones there was accumulation, followed by bullish moves. It would seem that the market players value this asset higher. Additionally, This area is a previous support with significant price action having occurred in these areas.
As added confirmation, MACD is showing slowing bearish momentum. Highly probable to turn bullish with possibly a crossover in due time.

ASX BEARISHASX monthly chart with SMA 11, 13, 15. Price chart removed.
Looks like 2008 and 2020.
Sidenote Australia raised interest rates today.
Additionally, notice the double top.

Silver/ASX ratio breakdownIt's finally looking like Silver is going to outpace the ASX. A breakdown from the clear descending wedge after a clear double top on the Weekly time frame, I am feeling very bullish. Inflation is here to stay, and fiat currencies are in trouble.
Eyes are getting drawn to the shiny stuff.

The ASX looks goodMonthly chart for the ASX (Australian market)
Green ovals show the clear bull rejections along the major trendline which has been recently tested and is breaking out to the upside
I have labelled the chart patterns - I am unsure however if the 'Symmetrical triangles' are really that or Rising Wedges, so take that with a grain of salt

Analyzing Australian Securities Exchange Stock's Trend.According to The Australian Bureau of Statistics' data, there are two scenarios for the stock of ASX Limited's trend. The first scenario is more recommended than the second one, which depends on the negative news about the change in the employment rate, and it is more likely to make the stock fall to break the first support line 84.22 and reach the second support line 83.65, then the third support line 82.42 on the other hand, there is positive news about the decrease in the unemployment rate by 0.5% than the expected rate, which may cause the stock to rise to breach the first resistance line 84.74 to reach the second resistance line 85.38 and then the third resistance line 86.43

ASX A possibility?? An idea for ASX
if price continues in the fashion it has shown
ASX is the Australian market
I am not currently in any positions on ASX
This is a monthly timeframe, timestamp!

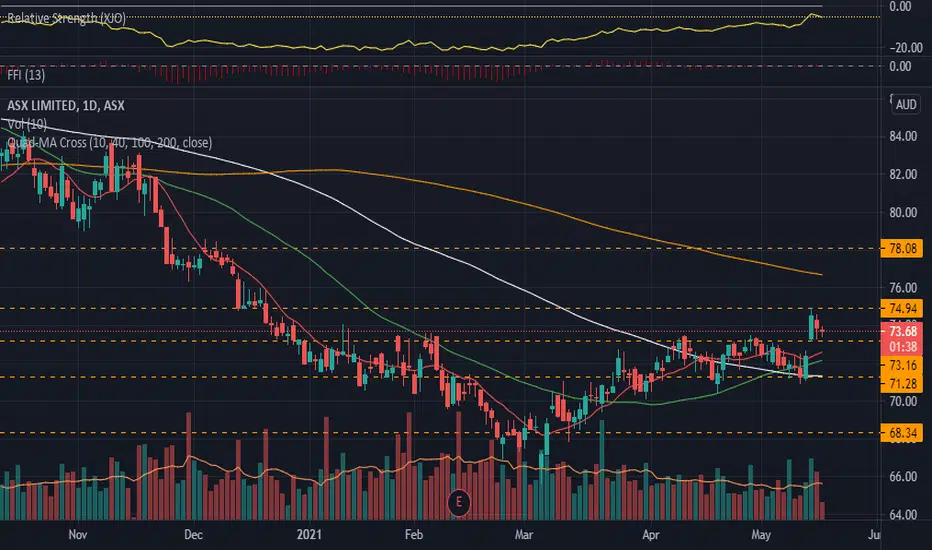
ASX.ASX_Range Breakout and Retrace Trade_LongENTRY: 73.62
SL: 71.29
TP: 76.69
- ADX<20
- RSI>50, RSI<70
- Daily RS -ve
- Daily FFI +ve
- Daily MACD +ve
- Weekly RS -ve
- Weekly FFI +ve
- Weekly MACD +ve
- MA aligned
- Breakout with good volume on 14 May 2021 and retraced with low volume
ASX; bearish retestShooting star under a key trend line and macro fib. Didn't hold weekly key level.


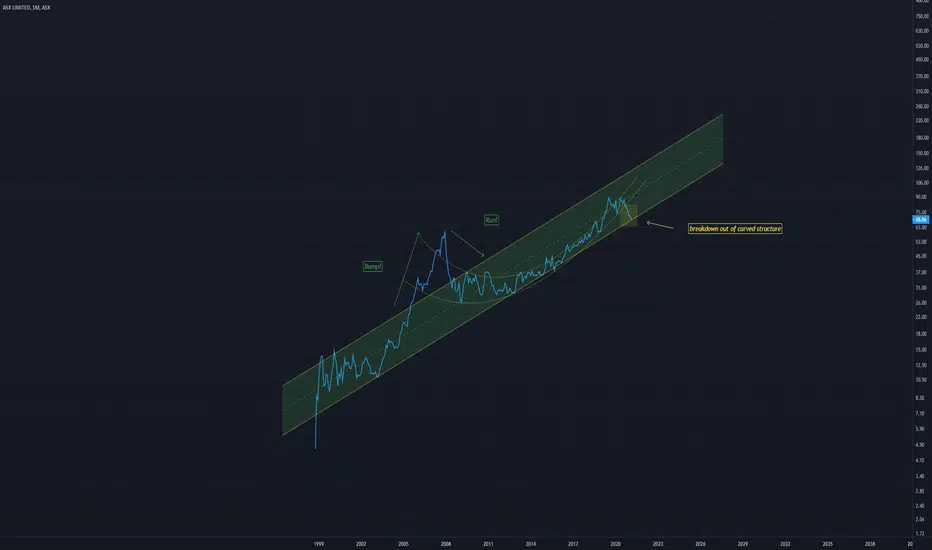
ASX Curved structure breakdownPrice has broken down from this curved structure
Although it is still within a larger channel
I feel this channel wont hold and a further breakdown will ensue
We will see
ASX to fall against GoldIt looks the ASX is going to close the month below the neckline, Gold prices looking strong with equity's looking weak. Just my opinion but another feather in the cap of GOLD/SILVER. I am being very cautious in the market now. My main hold is in Miners at this point

ASX - Could we see a Deep Pullback?We have witnessed a superb rally over the years since the start of 2009, but at current levels it seems that ASX may have already started to rollover for a deeper pullback.
1. It seems that it has already made a High in October 2020 and since it was very overbought, the price action since the last 4-5 months have been bearish and it has become toppy.
2. We can clearly see a topping wedge pattern in formation with a MACD cross, indicating Bearish Momentum on the Monthly Chart. If price breaks down lower out of this pattern, we may see some kind of acceleration in Bearish Momentum.
3. Currently it is hovering around $72.00 and there is 200 Weeks Moving Average at $69.00.
4. We might see this support of $69.00 to hold temporarily but ASX is expected to go futher down. It may go down to the Buy Zone of $49.00 - $58.00, which is a Fibonacci Retracement rage of 50% - 61.8% and also the Base Trendline Support, which is added confluence.
5. We may see small bounces or Lower Highs on the way down.
Please note these are my own notes for future reference, by no means trading advise for anyone. Please do your own research before entering into any trade.

ASX.ASX_ShortENTRY: 73.70
TP1: 71.28
TP2: 68.34
SL: 76.30
- RSI<30
- ADX>25
- MAs are aligned
- 100MA cross below 200MA


ASXThe ASX has hit the bearish market hard in march 2020. It was able to recover in a matter of months. Most markets take a long time to recover. The ASX was able to hit the resistance line.


Barley and Sun Tzu Art of WarRead latest news here
Sun Tzu Art of War :
You can be sure of succeeding in your attacks if you only attack places which are undefended. #
Typically, at least half of Australia's barely exports would be bound for China............
The tariffs, based on dumping and farm subsidy claims, would end Australia's $1.5 billion barley trade to China......
Barley is Australia's second most valuable agriculture export to China.......
In War, it is never clear and the art of staying ambiguous is what China , 5000 years of history has provided them with. It is a known fact that transparency is not THE word to use in China where media is controlled and anyone found posting negative comments about it are dealt with , sometimes in mysterious ways.
The chart tells us the constipated feeling the ASX index is feeling right now, unable to break above the resistance after so many attempts.
The price can stays within the rising channel for a while before it breaks down and this barley incident may or may not be the catalyst.

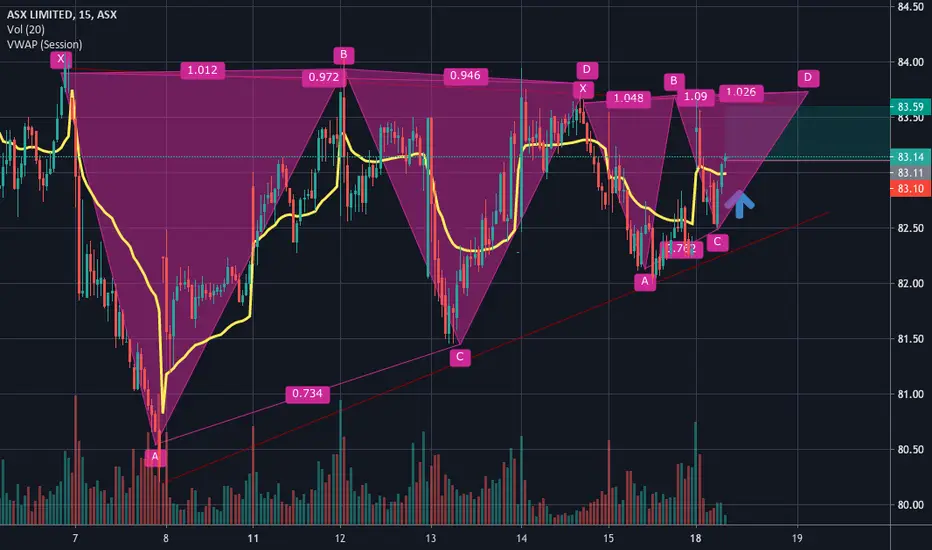
ASX | Hourly correction for more upsidehey traders,
asx looks to be beginning hourly c wave down before trend continuation to the upside
