US30 trade ideas

US30 Bullish Outlook: Key Targets and Order Flow InsightsGreetings, Traders!
Brief Description🖊️:
At the moment, I am expecting a bullish switch in institutional order flow for US30, which will push the price upwards. The price originates from a daily bullish order block, and I am looking for this to support the price, leading to a bullish draw upon confirmation.
Things I Have Seen👀:
Bullish Support Zone📈: The price is currently supported by a daily bullish order block, indicating a potential upward movement. Price may also look to respect the rejection block and use that as a support to continue the bullish narrative.
Engineered Liquidity🔄: Along the way, my anticipation is to absorb all the engineered trendline liquidity that has been presented.
Bullish Targets📉:
H1 Bearish Order Block: The primary target for this bullish move.
What's Important Now❗
To confirm the anticipated bullish draw, we need to observe the price action and look for supportive signals at the daily bullish order block. Stay tuned for real-time developments and further insights.
Kind Regards,
The_Architect

US30 Short positionHigher timeframes are showing a bearish momentum. the 2H timeframe has been n consolidation.

[Early Warning] Dow Jones showing weakness, will dip furtherTVC:DJI has formed 5 waves down in daily timeframe. Unless this 5 wave structure turn into a 7 or 11 wave (counter-trend) formation, this is likely a beginning of short term down-trend.
Now, this down trend could play out in different ways, 2 of the most likely options are highlighted in the chart. This 5 wave decline could be a larger ABC (or WXY/WXYXZ) which is highlighted in red color. Or worse, this could be beginning on a larger trend down and this is just minor wave i of larger 1. This is highlighted in blue color.
Both of these alternatives are bearish in nature. We can expect a bounce which might go around 61.8% (~39,500) though it doesn't need to be that much.
Just remember that for this scenario to play out, this 5 wave structure shouldn't change into a 7 or 11 wave structure as mentioned above.

US30, wave 5 should start now towards 42kLooking at US30 we have a high probability of turning into bullish again.
RSI long signal
Strong daily support
Bullish Engulfing candle
Possible wave 4 low
I expect new ATH to be build soon


possibility of uptrend It is expected that the downward trend will end in the current support range and we will see the beginning of the upward trend.
According to the behavior of the indicator, possible scenarios have been identified

Dow Jones and SP500The Dow Jones and SP500 CME_MINI:ES1! support our thesis, with the Dow closing below the 50 EMA yesterday. For both indices, the 2021 ATH is a critical short-term target, offering a chance to catch our breath before the final push. Meanwhile, the VIX, though currently low, made an intriguing upward move yesterday, indicating a potential shift in market sentiment shortly.

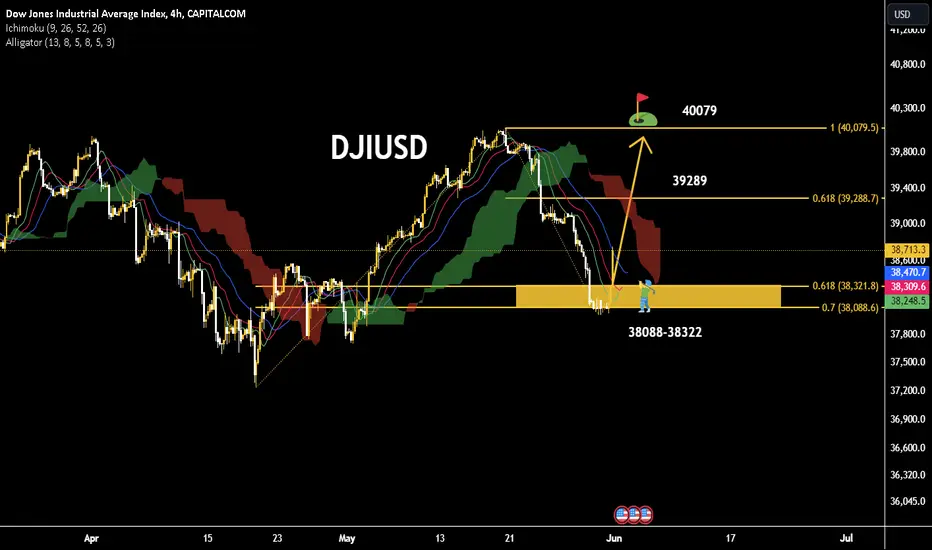
NEW IDEA FOR DOWJONES The increase in the Dow Jones index due to the increase in profits from the income of companies
By examining the trend in the four-hour time frame, the Dow Jones index, having an important support interval in the range of 38,322-38,088, can increase to the previous ceiling resistance in the range of 40,079, in the meantime, the 61.8% Fibo resistance will be seen at 39,289.
correction It is expected that the corrective trend will change the trend in the current support range and we will see the beginning of the upward trend according to the specified path.
By crossing the support range, the continuation of the downward trend will be likely

Short Weekly Based on technical and price action analysis, the US 30 is expected to be short on a weekly timeframe, potentially dropping to 32,500.

DOW JONES Should this Bearish Cross worry us?The Dow Jones Industrial Average Index (DJIA) hit our 40000 Target that we set on our May 06 idea (see chart below) and after that experienced a sharp pull-back:
So far this is within the lines of a natural technical correction correction towards the 1D MA50 (blue trend-line), which during uptrends tends to be re-tested as a Support. Notice also that this is where the 0.382 Fibonacci level is, an important technical Support during pull-backs.
As long as it holds, the Channel Up has the much needed Higher Low that can enable it to move to a Higher High. We expect that to be around 41500 (+6.30% rise, similar to the previous Bullish Leg).
On the other hand, since the 1D MACD completed a Bearish Cross yesterday, we need to consider the possibility of a deeper pull-back, as the last 1D MACD Bearish Cross (April 02), delivered a -6.88% decline. As a result, if the 1D MA50 breaks though, we will take that small loss and go on a short-term sell instead, targeting 38350 (0.618 Fibonacci level).
-------------------------------------------------------------------------------
** Please LIKE 👍, FOLLOW ✅, SHARE 🙌 and COMMENT ✍ if you enjoy this idea! Also share your ideas and charts in the comments section below! This is best way to keep it relevant, support us, keep the content here free and allow the idea to reach as many people as possible. **
-------------------------------------------------------------------------------
💸💸💸💸💸💸
👇 👇 👇 👇 👇 👇


Today's analysis and strategies will help youHello traders
1. US30 on support level.
2. Chances are high for long from this level.
3. once its broken below short we can expect a short un till its long.
Daily sharing of reliable signals and advice can help you, follow me if needed


KEEP SELLING US30!!!!!!!!!!US30 have completed over 4000pips move in our favor from our first entry now price just grabbed liquidity from the fvg zone and heading to create new lows am going in on a sell from this zone till my target is completed.........

US 30 short - swing tradeTaken a swing short on US 30.
Once we trapped the bulls and took out the buyside liquidity and closed back below the range entered targeting the HTF OB sitting around 38065
Entry 38118
TP 38080
SL 38127
Noted the daily sellside liquidity (red line) so let's see IF the market wants to hunt it around the NY open.
IF we fail to create new lows around here expect us to retrace towards the 15min breaker (blue box)
IF we close below the current lows expect us to run the daily sellside and the HTF sellside liquidity of the FVG (yellow box)
Stay safe and never risk more than 1-5% of your capital per trade. The following analysis is merely a price action based analysis and does not constitute financial advice in any form.

Hellena | DJI (4H): Short to the support area 37616.32.Dear colleagues, having reviewed the waves I assume that now the price is in a big correction and I expect that the price will continue downward movement to the support area 37616.32 (completion of the wave “C”). Before that a small correction to the resistance area 38978.81 is possible.
Manage your capital correctly and competently! Only enter trades based on reliable patterns!

DOW30The direction of the Dow Jones is currently upward, influenced by dovish signals from the Federal Reserve, favorable economic data, and positive earnings reports. Investors are closely monitoring upcoming inflation data and Federal Reserve comments to gauge future market movements.
Disclaimer: Please note that the information provided here is for educational and informational purposes only and should not be considered trading or financial advice. Always conduct your own research and consult with a professional financial advisor before making any investment decisions.

US30 BUYBased on what price action is showing, the market is s currently showing a reversal chart pattern plus RSI divergence.
If the current 2hr candle closes bullish engulfing, I'll be taking a buy from the current price range.

Big Movements to the upside.After a bearish landslide of a week, DJ will be looking to correct itself. Expect the bulls to make a massive upclimb. Especially after the PDH has been crushed. I keep it simple, block out the noice. Trade my zones and watch the movement explore. Peace traders $

DOW JONES (US30) LONGS NOT BAD IDEADuring the uncertainty and risk off environment, low GDP data didn't come unnoticed and big boys accumulated some equities after the huge Salesforce panic.
Today, with NASDAQ loosing almost 2% and 0.7% for SP500, DJ was accumulated, so I think we might see nice and strong reversal for the end of the week and month close.
Play safe and good luck!

