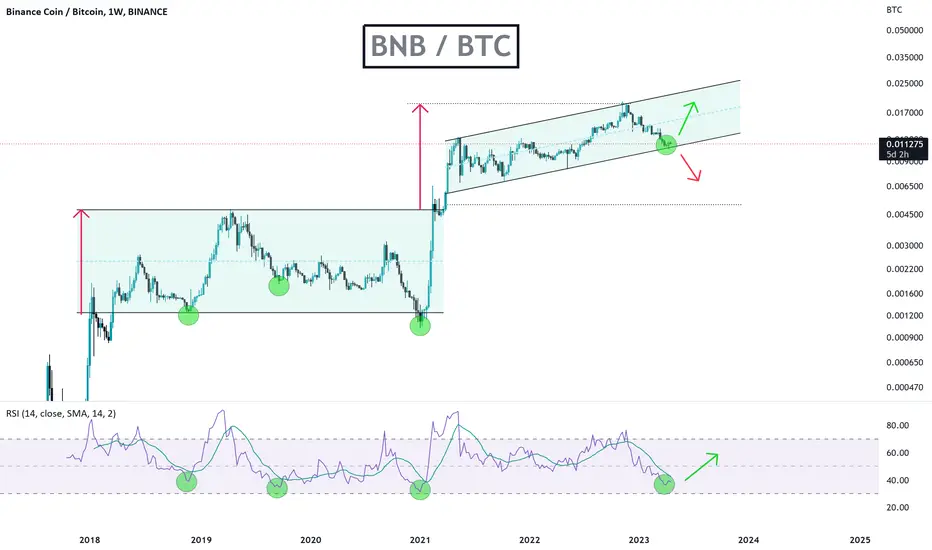
BNB/BTC Main trend 1w. Channel. Impulses. Past idea +450%The chart shows the main trend of the Binance exchange coin. Timeframe 1 week. Logarithmic graph. A trading idea for understanding where the price is in the main trend and what the potential of the price movement is. It should be noted that the main trend is quite strong and has formed an upward channel at a distance. The lows are constantly rising along with the highs. This is a very good sign. For the entire menagerie of thousands of such cryptocurrencies, which show such a confident price growth over a long distance of no more than 20. In most cases, even with a high capitalization, the trend breaks over time.
You also need to understand that this is a cryptocurrency of a popular and very liquid exchange, which is why such a strong trend. If the exchange evaporates, then its coin, no matter what you are told, will similarly go into another world in the moment. Therefore, be careful in trading and accumulating large positions.
Notice the super pumping pulses in the trend like what is happening now. Pay attention What corrections took place after such impulses
Former trading idea of this BNB/BTC trading pair.
This trading idea was published on January 17 at the very beginning of the trend inception, when a local reversal pattern formed at 4h. As the trend develops, I accompanied the price in updates and private. channel. BNB / BTC Local performance Double bottom Potential trend reversal
This is an uptrend on the 1 day now timeframe. Profit from the moment the idea was published is about + 450%. The trend is developing. Now there is a breakdown of the triangle and attempts to gain a foothold above its resistance.
BNBBTC trade ideas

BNB Versus BTC: A Grim PredictionAlthough this is probably becoming a more 'mainstream' view, I still believe BNB has lower to go. I mainly think that shorting BNBBTC is the best expression of a negative view on BNB and Binance broadly, as I think BTC will probably go higher over the next few months.
As Binance struggles with all these lawsuits and faces issues in and out of the US, its competitors are rising. In my opinion, all exchanges will face lawsuits from the US; it's just that Binance is the biggest target. Recently, regulators or Binance revoked some of its licenses, like the UK, Belgium, Netherlands, and Cyprus.
It's been clear for many years now it has done many shady things for which it would eventually have to pay a heavy price. It's unclear how dire the consequences will be, but it's unlikely that they will escape unscathed. There are also many big questions around BNBchain, which is heavily centralized and controlled by a few people.
BNBBTC peaked when FTX collapsed, a clear sign to go short. Why? Because regulators would have to become more active and mainly focus on Binance as it was selling its FTT and was partially blamed for the collapse. But how low could it go? And why?
In BTC terms, the minimum target is 0.0065. It will probably test that high and sweep the double bottom left untouched. However, as time passes, I think it will go significantly lower and potentially get as low as 0.003.
My reasoning is that 1) More exchanges will rise and compete with Binance, like Coinbase, Gemini, and other TradFi exchanges. Maybe even FTX gets revived (FTX 2.0), 2) BTC will dominate flows and liquidity as the ETF over the next year is almost a certainty, 3) Bitcoin, Ethereum, and their L2s will get the most users. Bnbchain will fail to gain extra traction, 4) Binance will face severe regulatory pressures and lose some court cases.
Finally, as you can see in the chart below, BNBUSD doesn't look healthy at all. It's still extremely overvalued, had a mini blow-off top and failure to reclaim support, has been rejected at the yearly Pivot, and has a massive FVG lower. I believe that the price could get to 150 over the next year, even if Bitcoin keeps rallying.

Binance Joins Ripple against SECI just entered a margin trade on Binance Coin versus Bitcoin, after a sharp fall that mixed fundamentals and a support line on technicals. Considering the very structured and robust customer support that Binance has, with the very respected leadership of it's current CEO, a lower price like the one we see at the moment is considered by me a good entry point. I seek good entries like that, but I never forget to use a stop loss. And I love stop losses that lays just underneath my entry. This support line is the ultimate one, so if we break slightly below that, it means danger. But if consolidate nearby it, a good oportunity. The target is easy: As soon as RSI sees itself blown up: anything above 70, or even further resistance lines on macro.

#BNB/BTC - Long - Potential 8.17%Direction: Long
Market: Spot
Risk: 0.25% - 1%
#BTC_BNB
Exchange: BINANCE
Timeframe: 360
TP1: 0.010053
Entry: 0.009292
STOP: 0.008531
Entry Conditions:
| Trendbreak
| RVI trendbreak
BNB seeing an inevitable recovery as dip is hoovered up and likely binance and their allies look to support price. Be wary of further binance FUD, certainly around asset freezing, I'll close this early if theres any movement towards freezing binance US assets.

Decision Time for Binance Coin (BNB)Decision Time for Binance Coin (BNB)
- RSI at this low level is typically followed by
significant price increase (See Green Circles).
- A buy here could make sense with a tight stop
below the upward channel border. Equally on a break
of the border to the downside, you could short and set
your stop loss at the channel border.
- We are trending up in the channel but technically we are
not in a full uptrend as we are below the 200 day. Caution
advised.
As we are meeting the border of the channel now is a good time
to consider a position, place it, ENFORCE a stop loss and sit back and
see what happens next.
Best of luck, the parameters are set.
PUKA
BNBBTC.1DHello dear friends,
*Mars Signals Team wishes you high profits*
This is a daily time frame analysis for BNBBTC.1D
We are in the daily time frame. As you can see, after hitting our resistance line several times, the price failed to consolidate above that line and moved towards your first support line. Now, we expect the price to support once again and this time after breaking the first resistance line, it can move towards our second resistance line. But if it fails to stabilize above our support line, there is a possibility of a fall to lower numbers.
Warning: This is just a suggestion and we do not guarantee profits. We advise you to analyze the chart before opening any positions.
Take care

BNB BTC 20May2023Daily bearish trend line broke up
Weak bullish trend line now
Weak bullish RSI trend line
under MA 100 and 200
CHOCH in 1400 corelated with MA 200
S.L= Close under horizon support blue line, confirm by close under RSI bullish trend line
INTER MORE = Break CHOCH to up, is corelated to MA 200 around 1400
TP=1600 , 1800
Long term Wave 1= Wave2 === TP=2800

BNB Buy Trade. Not Finacial Advise Just my StudyHere Is My Study on BNB
Are you ready to stay ahead of the game in the world of Bitcoin trading? In this video, we bring you the latest and most time-sensitive technical analysis of the Bitcoin market in Hindi, Urdu, and Panjabi. Get in-depth insights into the latest trends and indicators that are shaping the future of Bitcoin. Whether you're a seasoned trader or just starting out, this video has everything you need to make informed decisions and take your investments to the next level. So, don't miss out on this opportunity to join the ranks of successful Bitcoin traders and make your mark in the crypto world.
NOT A FINANCIAL ADVICE

BNB/BTC - BNB: Super_Trend◳◱ We've detected a Super Trend pattern on the CRYPTOCAP:BNB / CRYPTOCAP:BTC chart. The Super Trend indicator is showing a bullish trend, indicating a potential trend reversal. The next resistance key levels are at 0.011868 | 0.012264 | 0.013324 and the major support zones are respectively at 0.010808 | 0.010144 | 0.009084. We may consider opening a trade position at the current price zone at 0.011703 and benefit from the trend continuation.
◰◲ General info :
▣ Name: BNB
▣ Rank: 4
▣ Exchanges: Binance, Kucoin, Gateio, Hitbtc
▣ Category/Sector: Financial - Smart Contract Platforms
▣ Overview: Binance Coin is digital asset native to the Binance blockchain and launched by the Binance online exchange.
◰◲ Technical Metrics :
▣ Mrkt Price: 0.011703 ₿
▣ 24HVol: 678.958 ₿
▣ 24H Chng: 3.585%
▣ 7-Days Chng: -0.43%
▣ 1-Month Chng: 1.84%
▣ 3-Months Chng: 9.58%
◲◰ Pivot Points - Levels :
◥ Resistance: 0.011868 | 0.012264 | 0.013324
◢ Support: 0.010808 | 0.010144 | 0.009084
◱◳ Indicators recommendation :
▣ Oscillators: SELL
▣ Moving Averages: STRONG_BUY
◰◲ Technical Indicators Summary : BUY
◲◰ Sharpe Ratios :
▣ Last 30D: -0.49
▣ Last 90D: 1.06
▣ Last 1-Y: -0.07
▣ Last 3-Y: 1.45
◲◰ Volatility :
▣ Last 30D: 0.41
▣ Last 90D: 0.47
▣ Last 1-Y: 0.67
▣ Last 3-Y: 1.03
◳◰ Market Sentiment Index :
▣ News sentiment score is N/A
▣ Twitter sentiment score is 0.58 - Bullish
▣ Reddit sentiment score is 0.88 - V. Bullish
▣ In-depth BNBBTC technical analysis on Tradingview TA page
▣ What do you think of this analysis? Share your insights and let's discuss in the comments below. Your like, follow and support would be greatly appreciated!
◲ Disclaimer
Please note that the information and publications provided are for informational purposes only and should not be construed as financial, investment, trading, or any other type of advice or recommendation. We encourage you to conduct your own research and consult with a qualified professional before making any financial decisions. The use of the information provided is solely at your own risk.
▣ Welcome to the home of charting big: TradingView
Benefit from a ton of financial analysis features, instruments and data. Have a look around, and if you do choose to go with an upgraded plan, you'll get up to $30.
Discover it here - affiliate link -

BNB SHORTTarget : destroy CZ
Funds Are SAFU =)
Futures Setup (1x-10x):
Entry : 320$
SL : 350$
Take :
265
200
170
150
100
Futures Setup (1x):
Entry : 320$
SL : 400$
Take :
250
200
150
100
50

🔸What's going on with Binance?For ordinary traders of the exchange almost nothing has changed, which creates a dangerous illusion of non-seriousness of what is happening. At the same time, for professional participants dramatic consequences of this situation are already obvious
▪️First, just a week the exchange lost 16% of the market share.
▪️Vo. Secondly, we see an increase in the average withdrawal volume indicator by 5 times. Yes, we don't see sharp outflows, but what's worse, we see a dangerous trend
▪️Third, Binance's liquidity level has updated a two-year low, indicating a mass exodus of professional participants
How dangerous is this?
The main thing Binance has been accused of is working illegally with U.S. customers. Since spring 2021, when China banned crypto, Binance's average daily volume distribution has clearly shifted in favor of the U.S. session
But the scary part is not that they are guilty, but that Binance's main market makers, which have enabled them to achieve such liquidity superiority, are based in America
If they decide to leave now, reducing risks (and the data points to exactly that), there will be less and less liquidity on the exchange, and less liquidity = less attractiveness for institutional investors. Fewer institutions = less liquidity.
As you can see, this is very dangerous.
I recommend to take some time and register on other exchanges, but hold main of you asset in cold wallet:
MEXC (The largest leverage in the market)
ByBit (Exchange #2 in crypto futures trading )
Bitget (Huge deposit and withdrawal limits without verification)
Huobi (Best conditions for institutional traders)
BringX (Futures, stocks, commodities, FX)
Best regards EXCAVO

A relief pump is possibile.We liquidated some BNBBTC about 30% higher, back in december. Not far off the 0.18 mark.
Nowadays BNB is a pretty risky asset, that said i foresee the potential opportunity for a scalp on W TF.
Key findings:
Bullish divergence on D, slight volume spike.
Overextended (red) TD 15 Count on W.
Slight bullish divergence on RSI/W.
Close to FIB 0.382.
Close to falling wedge Apex.
Early notice , Decent R:R here.
That's a high risk trade given D is still mixed and a further slump to 0.10 cannot be excluded for the time being.
So handle with care, DYOR.

Binance Coin ( BNB/BTC ) Price AnalysisTechnical Analysis of BNB/BTC:
The current trading price of BNB/BTC is 0.0132 BTC and is currently trading near a high resistance level. The resistance level at 0.0134 is crucial, and if there is a break above it, there could be an upward move of around 20%.
However, if the price rejects this level, we could see a downside move of 30% from the current price and 24% from the breakdown level.
In my opinion, a downside move is likely to occur.
Therefore, if the price hits the 0.01 BTC level, it could be a good entry point for a long-term position.
I will provide updates on the situation periodically.
Please like and share this analysis if you find it helpful, and follow me for real-time crypto updates.
Thank you.

$BNB BEARISH FRACTAL (BNB/BTC)I think arbitrum, optimism, etc. will take a lot of BNB's dominance in terms of total crypto market capitalization. Also, with fud around BUSD and regulators seemingly targeting CZ / Binance, I expect Binance to underperform, though I think eventually when it is at a fairer value it may have another run. Coinbase also launching their own chain which means BSC/Binance has a lot more competition going forward. DeFi platforms like GMX also becoming much more mainstream which is yet another reason to be bearish imo.

BNBBTCHello Crypto Lovers,
Mars Signals team wishes you high profits.
This is a one-day-time frame analysis for BNBBTC
Here we have R2 and R1 as the resistance areas that express the price was not able to rise at different points. R3 used to be a support area. And S1 is a long-term support area in this chart containing the support of price even since the past. At the moment, we have the price fluctuating in S1 area in a rising trend and we expect it to resume its rise and reach R1. Then by having some rising signs there, we would wait for an increase. So if we receive some confirmation candles to rise, an increase would take place for the price to break R1 upward and even move toward R2 area in case it is supported and faces more fluctuation over R1. In case S1 area is lost, and the price is not supported at any point, more fall is predicted there for it to touch lower amounts. Please bear in mind to wait for some confirmation candles in order to make sure what will happen next and act precisely and well.
Warning: This is just a suggestion and we do not guarantee profits. We advise you to analyze the chart before opening any positions.
Wish you luck

BnbBtc Looks Pretty Solid For Breakout Seems like bnbbtc getting ready for another for breakout
Forming Falling Wedge In Daily Timeframe Incase Of Breakout Expecting 35 - 40% Bullish Move

BNBBTC - Fib Swing Low to Swing High Current probable reversal point BNBBTC, and possible breakout on BNBUSDT

Bnbbtc - possible flip resistance Flip resistance bnbbtc which could see a BNBUSDT rally. On mobile.

BNBBTCLoving it <3 Gartley Harmonic : ) Gartely Swing low to high Mod 0.618.. rip. 888 .. down 0m782 .. now x

BNBBTC - Back in the Game? Clearly broke down on the falling wedge. A pullback, facing bottom of the wedge may bring BNBBTC back in the game! Looking good, see where this takes the price action. Nice pullback! Love it!
Not goodBNB seems to we on the verge of a huge down move against BTC,
or BTC is on a verge of huge pump xD
LOG scale
Also as previously posted, BNBs bear market was soooo insignificant that its almost clear that there's moree to come.

BNBBTC 1/1/2023 to 2/17/2023BTC appears to be raising faster than BNB. Will update to add BNBUSD. There has been news regarding Binance pulling out of the US due to ongoing regulatory changes.

[Heads up] BNBBTC still close to ATH, watch it.BNBBTC is still relatively close to its ATH, despite opverall alts weakness (except for ETH).
Given the peculiar recent tall doji candle, despite low volume, it's worth watching.
If it holds it may paint an ascending triangle or Cup & handle towards a new ATH.
