LONGBNBUSDTjust now
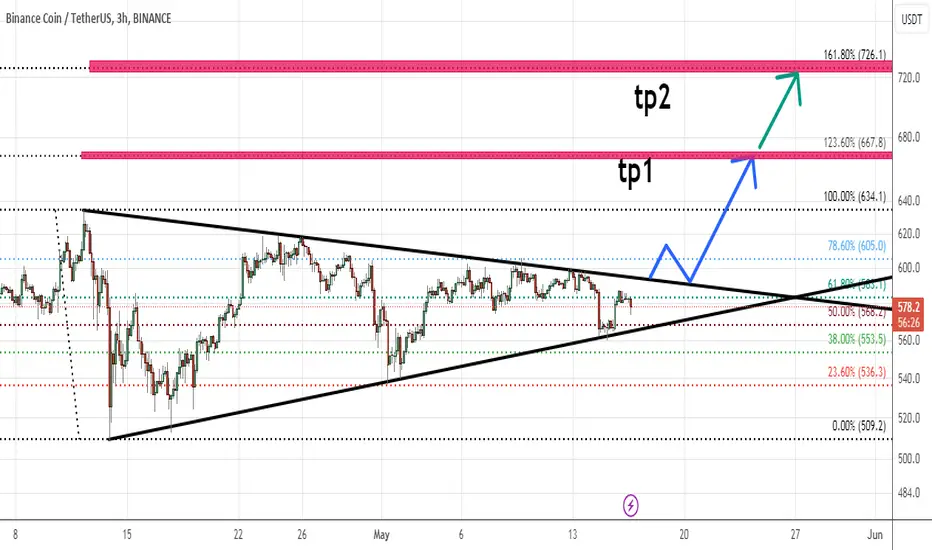
I think it has no intention of going down and wants to continue its ascent and as I have specified in the chart, it is possible to go to higher prices.
Let's see what happens
BNBUSDT trade ideas

Long BNBUSDT, 8HLong BNBUSDT, 8H
entry 589.0 - 575.9
sl 536.7
tp scalp 641.3
tp1 691.8 (ath) - 715.3
tp2 798.2
move sl to entry after price reach 641.3 ; price shouldn't retest entry again.
BINANCE:BNBUSDT BINANCE:BNBUSDT.P BINANCE:BNBUSD

BNB ANALYSIS🔴 #BNB Analysis : ❓❓
🔮There is a formation of "Bullish Pennant Pattern" in #BNB in daily time frame. We can expect around $685 bullish move if the price perfectly retests the level📈📈
🔰 Current Price: $616
🎯 Target Price: $685++
⚡️What to do ?
👀Keep an eye on #BNB price action. We can trade according to the chart and make some profits. ⚡️⚡️
#BNB #Cryptocurrency #Breakout #DYOR

Binance Coin (BNB): EMAs Are Holding Price Down!Binance coin is back, but this time in a smaller timeframe.
As we can see on a smaller timeframe, the price has been moving neutrally below both 100 and 200 EMA.
As we broke already, the EMAs price has been testing that same broken zone multiple times yet without any success or failure.
What we need here is to see a good rejection, which would result in further movement towards the lower support zone.
Swallow Team

BNB/USDT: Enter on Bullish Consolidation Break, Buy Stop at $625BNB/USDT has displayed a bullish consolidation pattern and is now poised for an upward breakout. A buy stop order is set at 625 to capture the breakout from this consolidation, targeting a favorable risk/reward ratio of 1:2. This strategy anticipates a significant upward movement as BNB/USDT aims to reach higher resistance levels. Monitor closely for the activation of the buy stop as it indicates strong buyer momentum, positioning for a potential rise towards our calculated target.

Long signal for BNB/USDTThis technical analysis is based on the daily chart of BINANCE:BNBUSDT on the Binance exchange. In this analysis, a price channel is drawn, and support and resistance levels are evaluated.
Price Channel Analysis:
The price is currently within a price channel ranging from 556.3 to 676.1 USDT.
The suggested entry point is around 588.5 USDT.
Entry and Exit Points:
Entry: 588.5 USDT
Take Profit: 676.1 USDT
Stop Loss: 556.3 USDT
Conclusion:
This analysis suggests that by adhering to the specified take profit and stop loss levels, a successful trade can be achieved. The Reward/Risk Ratio for this trade is approximately 2.74, indicating a highly favorable risk-to-reward scenario. To manage risk effectively, it is recommended to strictly follow the stop loss level.

BNB, wait wait waitAll we need to wait for the price accumulate more, it needs to break the yellow range, then the trendline.
If the price break the yellow range, I will buy to catch the next wave...

$BNB #Binance Trading IdeaBNB/USD (Binance) has another chance to break out from this ascending triangle and reach its all-time highs. We're seeing a bounce from the Golden Zone (Demand). After breaking through this resistance zone, it could go all the way to its ATH of $692.6.

BNB Holders! FOLLOW ME~!What 's up?! My friends!
This is BNBUSDT chart.
After breaking the GREEN downtrend line, It is currently keeps it.
If it keeps the GREEN downtrend line, It will reach the RED uptrend line.
* It's also worth looking forward to the rise due to the FLAG pattern.

BNBUSDT TriangleBNB is consolidating and gaining strength, positioning itself to either reach new highs or lows. Given today's conditions in the altcoin market, there is a significant possibility for it to establish a renewed support zone around the 500 level.

BNB, Silence is deafening.. low key preppin BIG MOVES at bottom.BNB has somewhat been abandoned in terms of price growth in comparison with its big coin peers alongside other alts. It has stayed at the bottom range for quite sometime. A low key reversal maybe on queue that will be missed by majority.
On our weekly data, BNB has tripled bounced on a solid order block at 220-240 range. This has been visited many times and it keeps bouncing off it for the past 12 months. This range is firm -- and a huge bounce maybe warranted after a few tries already.
Increasing volume has been spotted this past few days with numbers surging +20% from its average numbers.
The coin is currently sitting just above 78.6 FIB LEVEL -- a bargain that can't be missed.
Histogram higher lows is being registered conveying of that a long term trend shift is about to materialize. A bubble up volume (bottom indicator) has finally appeared after 3 months -- since April 2023.
If you missed the LTC, ETH, BTC bull train, BNB is kind enough to give you a chance.
Spotted at 245
TAYOR.
Safeguard capital always.

BNB consolidating support?Greetings! BNB action has been under selling pressure since the previous reach to the 630s. Lower pivot which served as support from the first leg of the fall is now located around the 591 level. Getting that level conquered, allows the price to rally up to the higher levels depicted in chart, the very first one win is the midrange wave which sits above the 600. This report concludes with a short-term bullish forecast to be invalidated below 580. With a nice accumulation range from 590 to 585 that can be distributed above 605.

BNBHello
Bnb chart is looking really good , in case of upside breakout targeted price is 1100$ with a small stop in 750$
Are you bullish or bearish on BNB here ?


bnb really needs to reclaim that channelbnb has fallen out of the channel and back tested resistance where the 21 ema is.
there is a lot of air between current price and the lower bollinger band / diagonal trendline
bnb really needs to reclaim that channel for further upside

Binance Coin (BNB): The consolidation of a powerful asset.The BINANCE:BNBUSDT , one of the largest crypto capitalizations, has unquestionably been an extremely strong asset since the start of the year.
We can see that it is currently consolidating in a symmetrical top triangle, a chartist figure favorable to the continuation of an uptrend.
The Magic Bands (PMB) had given a very good sell signal at $630, and we can see that the cloud has remained green despite its correction. A green cloud means an uptrend, so everything seems to be going well for this asset, which has been in this trend for almost 200 days, with a very nice buy at under $230!
Note also that, despite its rise and strength, BNB is no longer in a period of distribution or attention according to Supreme Vision (BSV) .

Binance Coin BNB: Bulls vs. Resistance
BNB confronts the formidable resistance at $594.45, testing the resilience of bullish momentum.
A successful breach might propel BNB towards targets of $622.35 and $655.65.
However, a retreat below $542.50 could signal a corrective move down to $481.25.

BNB Bullish Pennant - Target: $880Bullish pennant on BINANCE:BNBUSDT
Not Financial Advice
Fib retracements are drawn between the ATH and the 2022 low. Some levels are still very well respected. (The pennant's low, matches exactly 0.618 fib)
We are very close to the pennant's convergence, so a breakout should be imminent.
Watch for a breakout of the resistance trendline (solid orange), as the target for a breakout would be a new ATH at around $880.
Expect some resistance in the $690 area, as that was the previous ATH.

BNB is waiting for breaking upward upward break is more probable than other scenarios ,so waiting for this break for going toward its tp's .
this analysis is based on fibo level and price action and ichimikou indication .
please share your comments if you like
✴️ Binance Coin 5X SHORT (230% Profits Potential)Here we have a symmetrical triangle for Binance Coin vs Tether (BNBUSDT).
This pattern for us has a bearish bias due to the fact that related pairs in the same situation are now bearish, take Ethereum as an example. The bearish action we see on the Ethereum chart can easily be duplicated on the Binance Coin chart.
➖ Market conditions can always change though and this is only an assumption based on past price action; anything goes.
➖ Make sure to do your own research before trading.
There is always risk involved.
➖ Leveraged tradings is for experienced traders only.
This is not financial advice.
Full trade-numbers below... ⤵️
____
SHORT BNBUSDT
Leverage: 5X
Buy-in: $620 - $580 | Cp: $584.5
Targets:
1) $540
2) $510
3) $480
4) $425
5) $380
6) $345
7) $315
Stop-loss: Close daily above $650
Potential profits: 230%
Capital allocation: 3%
___
If you enjoy the content or would like to see more trade ideas with "full trade-numbers," make sure to boost and follow... Now!
Namaste.

BNBUSDT IDEAHello Traders Hope You Are Enjoying Our Analysis. Today We Will Discuss About BNB
(Update)
1D Timeframe⏳
The Bullish Pennant Formation☑️
Expecting Massive Bullish In Case Of Successful Breakout✍️

Binance Coin (BNB): Sideways Movement / Good Sell Momentum?Binance Coin is still trading inside that sideways tunnel, bouncing from one side to another.
We are seeing price approaching yet again in the in the upper zones, where previously we did not have a touch on the lower side of that zone.
We expect to see a downward movement soon from the current zones, so eyes open!
Swallow Team

BNBUSDT. Trading opportunityOn the daily timeframe, the price has formed a sideways movement and reached the mandatory target of the seller's vector 7-8. The next relevant buyer's vector 8-9 has a potential target of $634. The price is currently in the middle of the sideways range on the daily timeframe.
On the hourly timeframe, the price has also formed a sideways movement. The short seller's vector 11-12 broke below the lower boundary of the sideways range at $574 and collected sellers' liquidity. Pay attention to the key volume of the last vector 11-12: the candle with the highest volume in the vector is at the bottom (marked as 'KC' on the chart). Then the buyer absorbed this volume and returned the price to the sideways range, forming a new buyer zone at the boundary of the sideways range (the blue rectangle on the chart, upper boundary at $575.5). The key volume (largest) in the emerging buyer's vector is also at the bottom (the candle on the chart is marked as 'tKC'). This setup increases the probability of realizing the buyer's vector 12-13 with a potential target on the hourly timeframe of $600.
Idea: Look for purchases as the realization of the buyer's vector 12-13 on the hourly timeframe and the buyer's vector 8-9 on the daily timeframe. The target on the hourly timeframe is $600.
The preferred option is to look for purchases from the defense by the buyer of the buyer zone at the lower boundary of the sideways range.
