SPIRAL FOCUS 3/23 THREE GOLDEN RATIO SPIRAL TURN 3/23 +OR- 1.5 As I had mentioned that a major turn is at hand we now have 3 spirals in place and the turns have begun see 2020 turns as well as the forecast aug 2022 3 spirals focused on aug 13 to the 20
OEX trade ideas

S&P 100 Index - MACD Histogram Bullish FormationWith regard to the MACD Histogram, the Hawkeye Engine notes that the S&P 100 Index (OEX) has recorded 30 consecutive days above the 0 level. Historically, following the formation of this MACD pattern, OEX, displayed a positive expectancy over the next 20 trading days.
OEX - 20-day average absolute return 1.97%, standard deviation 2.79%, win rate 8 from 10, drift 0.41%.
Disclaimer: This data is not financial advice. Past performance is not a guide to future performance and may not be repeated. Past performance does not diminish the 'risk' expectancy of any strategy. By its very nature ‘risk’ means you could and most likely will experience losses. No representation or warranty is given as to the accuracy or completeness of any information provided. Data is for educational and informational purposes only.

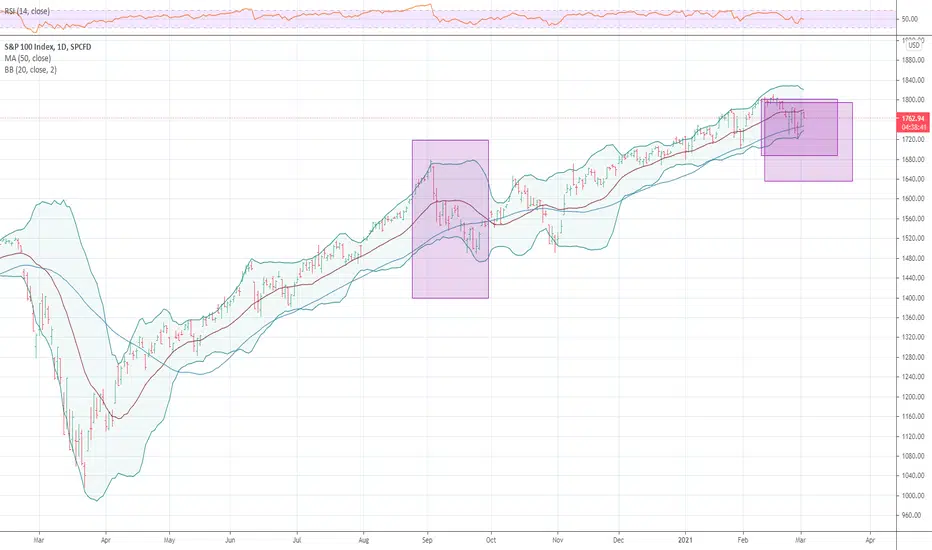
MOVE TO A 75 TO 85 % NET SHORT ON ANY RALLY NEAR THE HIGH RSI NON CONFIRMATION .I will now move to a net short 75 to 85 % on any rally today to even

OEX vs SPYThis is a ratio of the OEX to the SPY. Which is a ratio of the market cap of S&P 100 vs. the S&P 500.
It is interesting to note that during previous bubbles, such as 2000 tech bubble and 2007 housing bubble, there was a considerable increase in the ratio of the S&P 100 to the S&P 500.
At the moment, many are ringing the alarm bells on the 2021 bubble. However, as we can see, this analysis does not suggest any major issue, if history is any indication. However, this is just one model.

Next target is 1789Hi there, we have double bottom & I expect that price will rise to 1789 but we have a strong resistance on 1776 line,so you can choose 1774 for your target.
good luck.

daily analysis of S&P 100indexHi friends
the daily chart of this market shows that it will experience with a high probability an uptrend in the next few days please subscribe to receive more analysis
thank you

OEX S+P 100 Upside Break Out to All Time HighI use the "OEX" CBOE S+P 100
as an overall market confirming Trend Index
Comprised of the 100 largest capitalization companies on the NYSE and Nasdaq,
the OEX is a "proxy, and broad range"for United States cooperate performance.
This past week...
the OEX broke out to an historic all time high closing at 1547.90,
clearing the Feb 2020 top, prior to the onset of the pandemic.
.
Traders should look for any pullback in the OEX to Buy,
although the market is not giving you that opportunity now.
With a complex bottom being formed in the CBOE Put/Call Index,
quantified evidence on the OEX shows a very bullish" and significant upside market breakout.
THE_UNWIND
8/8/20
NEW YORK

S&P 100 INDEX WEEKLY ANALYSISHi friends
the weekly graph of this market shows that it will experience an upward trend in the coming weeks but at the same time the vigilance of the change in the opposite direction
please subscribe to receive new analyzes

S&P 100 versus all the rest S&P 500 and also Russell 2000 updateS&P 100 versus all the rest S&P 500 and also Russell 2000... Note that in the previous cycle 2003-2007 was a value cycle so the S&P 100 big cap names were underperform the broad market, growth cycles are mostly a concentrated big cap names phenomenon.

S&P 100 versus all the rest S&P 500 and also Russell 2000S&P 100 versus all the rest S&P 500 and also Russell 2000... Note that in the previous cycle 2003-2007 was a value cycle so the S&P 100 big cap names were underperform the broad market, growth cycles are mostly a concentrated big cap names phenomenon.


ABC FLAT ENDING NOW MOVE TO 60 % LONG FROM A 60 % SHORT FRIDAY ABC DECLINE ENDING NOW WATCH FOR 1209 UPSIDE

Smart Money has been exiting - true bottom yet to be found.Smart money is flowing out and has been for almost a week, was waiting for this dump. Most people think it's oversold so I expect a short comeup but a major comedown.
Crazy idea from a crazy TA :)

OEX has achieved the 100% expected move$OEX is the S&P 100 and heavily weighted AAPL, MSFT, and AMZN. Today's move is actually gaping above the 100% expected move. Sure looks quite risky to hold in here. Toppy

OEX 100 CYCLE LOW DUE NOW I HAVE MOVED TO 100 LONG THE UPSIDETHE WAVE STRUCTURE IS ENDING THE CORRECTION NOW WAVE C DOWN IN SP 100 IS 5 WAVE DOWN FOR WAVE C of B down i see a 5 wave rally in wave C UP TO PEAK IN WAVE B WITHIN 11 TRADING DAYS AT 1277 TO 1281 . BEST OF TRADES


Cycle View SPX-old chart from a few months ago never published with mid-June 'top'
-wave count was just for practice
-OEX is smart money of SPX

$OEX coming v close to a meaningful top$OEX coming v close to a meaningful top. Fib ext ABCD and T chart all colliding . Take short by next week if rises further 1%

OEX100 Long wicks = Distribution!! Not StrengthEX100 Long wicks = Distribution!! Not Strength, triple top... whatever you call it... it is distribution!
Accumulation has few wicks because it is inefficient fills, so institutions are selling, not buying...
I'm Sell Sell Selling...
