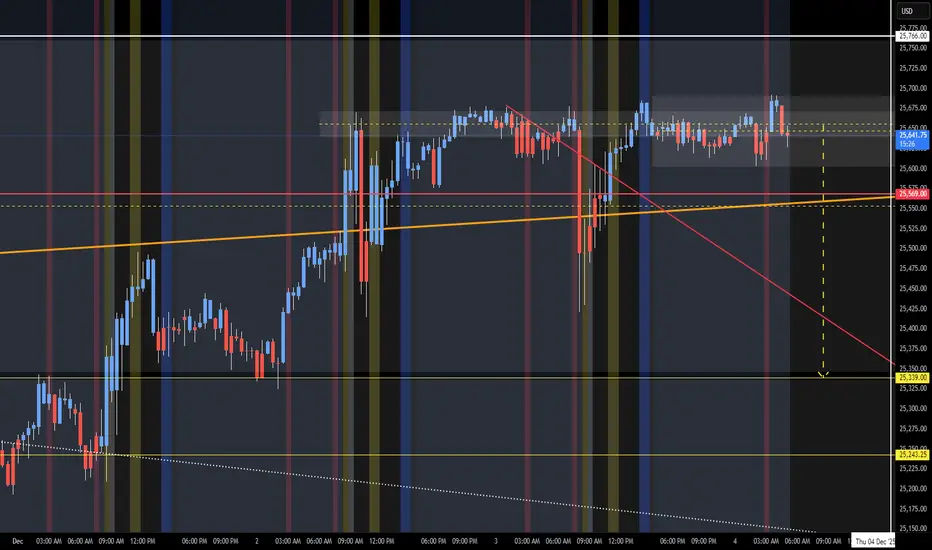
NQ Short (12-04-25)Nothing new, still liking the Short. Seems like market is waiting on Stimulus, QE or something because price action is aimless. Only appears to lift in O/N, Dead Zone or any lower volume trading period. Open Drive selloff of no return, or not.
About NASDAQ 100 E-mini Futures
An index composed of the 100 largest, most actively traded US companies listed on the Nasdaq stock exchange. This index includes companies from a broad range of industries with the exception of those that operate in the financial industry, such as banks and investment companies.
Related futures
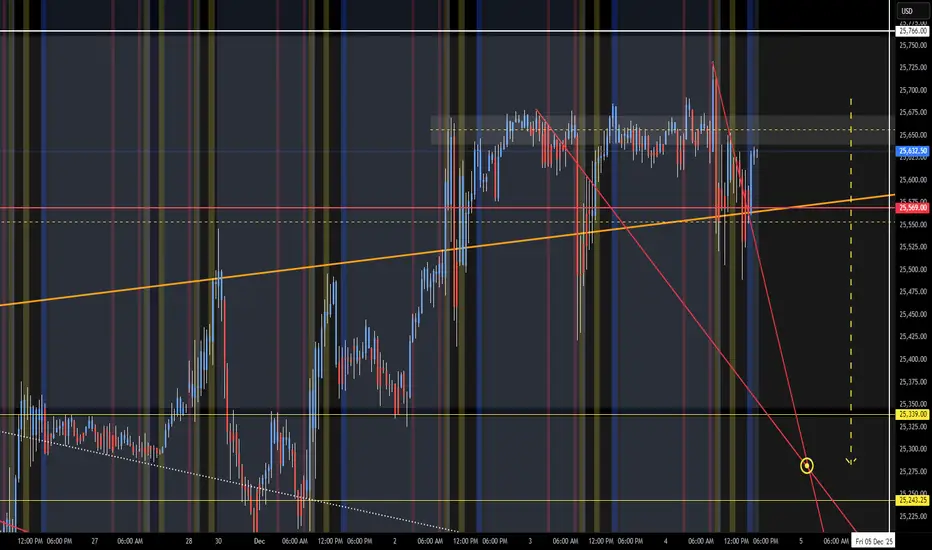
NQ Targets (12-05-25)Yellow arrow is lower target and 25,766 is upper Turn Zone. Past three days have been struggling to stay in range above orange TL below. O/N will have to pump it up and Reg Session will have to sell it off (big). Other option is snail life higher into Friday - Monday Long Play, just watch the head f
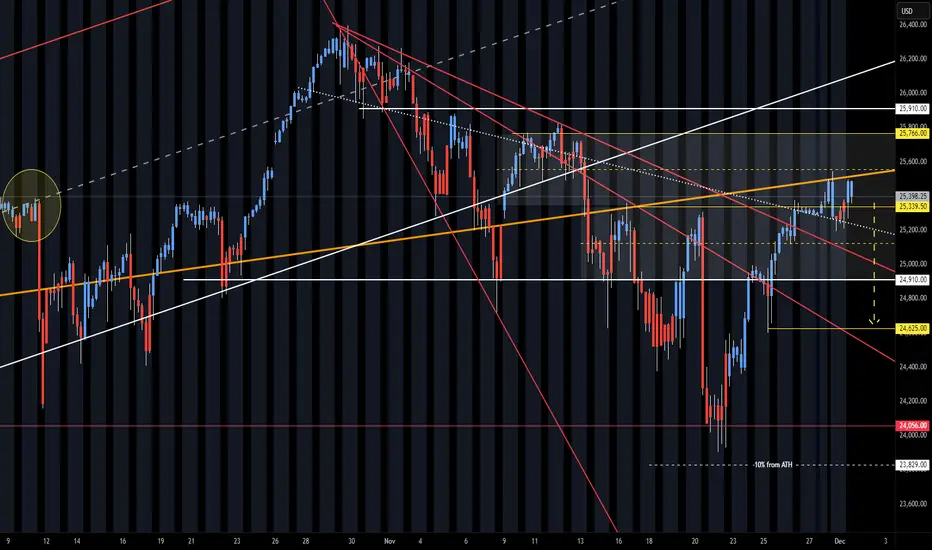
NQ Short (12-03-25)White arrow is range for breakout, lower break may drop to KL 24,625. This may be today or next few. KL 25,620 is major key level today.

NQ Short (12-02-25)Easy one from here, Long above 25340-360 and Short below. Let the Overnight lift and stall and look at Reg Session Open Drive for a drop test. Tweets, Tricks and low volume periods are only challenge on this one.
NQ Short (12-08-25)NAZ is barley alive and showing signs of slowing to the upside, while kicking out some very quick 100-200 drop test bombs. NDX may need to gap fill at 25,898 and we could see an M with decent drop test (Fed Day would work). On NQ it is looking like Turn Zone at 26k or so. After the drop test and fin

MAJOR MARKET SIGNALPlease watch the entire video to understand my overall logic.
Through the years I've gone through many different strategies, learning, refining and sharpening my edge in the markets. Today I truly find myself most in the identity of a "Discretionary Trader" with a mechanical approach.
In this ch

NQ Range (12-01-25)NAZ lower in O/N and inside wide Churn Zone, look Long above 25339 and Short below 25,125. May see opposite direction trades at these levels and some sideways churn until breakout. Look at 1,000 point range of 25,910 - 24,910 as a wider CZ range.

NQ UpdateLooks like it's still melting up, though it's a slow melt up.
Probably not gonna trade today.

Scalping the 1 minute using HTF OHLC strategy: Prop Firm StratSimple Scalping, Trading Take Profit Testing account. Using my Best Trade Set up Strategy on the 15-minute candles.

NASDAQ 100: Bullish! Look For Valid Buys With The Trend!Welcome back to the Weekly Forex Forecast for the week of Dec. 1-5th.
In this video, we will analyze the following FX market: NASDAQ (NQ1!) NAS100
The NASDAQ closed last week strong. It would indicated the potential for follow through going into this week, at least early.
Bear in mind that the p

See all ideas
Summarizing what the indicators are suggesting.
Neutral
SellBuy
Strong sellStrong buy
Strong sellSellNeutralBuyStrong buy
Neutral
SellBuy
Strong sellStrong buy
Strong sellSellNeutralBuyStrong buy
Neutral
SellBuy
Strong sellStrong buy
Strong sellSellNeutralBuyStrong buy
A representation of what an asset is worth today and what the market thinks it will be worth in the future.
Displays a symbol's price movements over previous years to identify recurring trends.
Frequently Asked Questions
The current price of NASDAQ 100 E-mini Futures is 25,794.50 USD — it has risen 0.43% in the past 24 hours. Watch NASDAQ 100 E-mini Futures price in more detail on the chart.
The volume of NASDAQ 100 E-mini Futures is 21.18 K. Track more important stats on the NASDAQ 100 E-mini Futures chart.
Open interest is the number of contracts held by traders in active positions — they're not closed or expired. For NASDAQ 100 E-mini Futures this number is 307.18 K. You can use it to track a prevailing market trend and adjust your own strategy: declining open interest for NASDAQ 100 E-mini Futures shows that traders are closing their positions, which means a weakening trend.
Buying or selling futures contracts depends on many factors: season, underlying commodity, your own trading strategy. So mostly it's up to you, but if you look for some certain calculations to take into account, you can study technical analysis for NASDAQ 100 E-mini Futures. Today its technical rating is buy, but remember that market conditions change all the time, so it's always crucial to do your own research. See more of NASDAQ 100 E-mini Futures technicals for a more comprehensive analysis.