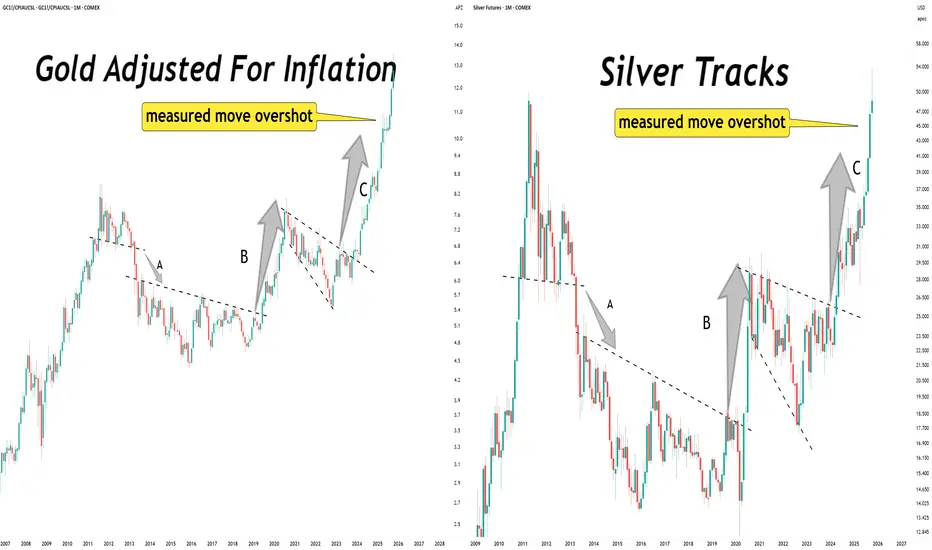
Launch patterns have exceeded their measure move targets.Gold. Silver.
Launch patterns have exceeded their measure move targets.
What comes next?
I would expect more launch patterns to morph into existence. Those are the building blocks of a long term uptrend.
About Gold Futures
Gold price is widely followed in financial markets around the world. Gold was the basis of economic capitalism for hundreds of years until the repeal of the Gold standard, which led to the expansion of a fiat currency system in which paper money doesn't have an implied backing with any physical form of monetization. AU is the code for Gold on the Periodic table of elements, and the price above is Gold quoted in US Dollars, which is the common yardstick for measuring the value of Gold across the world.
Related commodities
Gold Above 4300 – Watching for FVG Fill Before Next LegPrice consolidated all of yesterday’s Asian and London sessions before breaking bullish through NY, clearing the 4300 resistance.
Today, we’re holding above that breakout level and sitting just beneath the weekly high at 4398.
A 4H FVG rests below price around 4345–4360 — that’s my first area of i


Weekly Outlook — Gold Futures (MGCZ2025)Price is sitting between key levels after last week’s explosive move.
I’m watching 4,300 as immediate resistance — if bulls can’t hold above this level, I expect a sweep toward 4,200–4,150 (H4 + Daily FVGs) before continuation.
Monday might just be a setup day, building liquidity for a Tuesday/Wedn

GC gold updateVIX died overnight, gold did not tank.
I'm expecting gold to just go sideways for a couple of months unless there's a significant news event.

Gold , final top $8500 area. Still on track !Gold , final top is in the $8500 area top based on the chart. Still on track with corrections and consolidations along the way. Then big bear market with a low of $2500 and then new bull. Not for trading

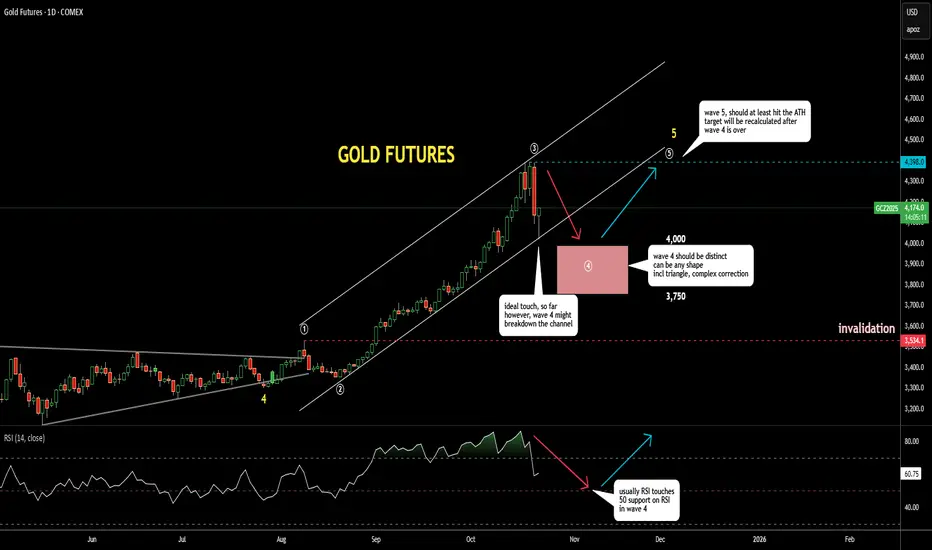
Gold Update 22OCT2025: Wave 4 Correction is in Progress Sooner or later, both overbought conditions and bearish divergence tend to play out — and we’re seeing that now.
Gold just experienced a massive and surprising sell-off, with many stop-losses triggered.
The price dropped $300 in a single day, compared to its usual $50 range.
This likely marks the
NO TRADE ZONE FOR GOLD!!!I was Looking for price to proceed with being bullish but it decided to breakdown. I'm not ready to buy again just yet. Need to see a full sweep on levels first. I think im going to sit on hands for the rest of the week.

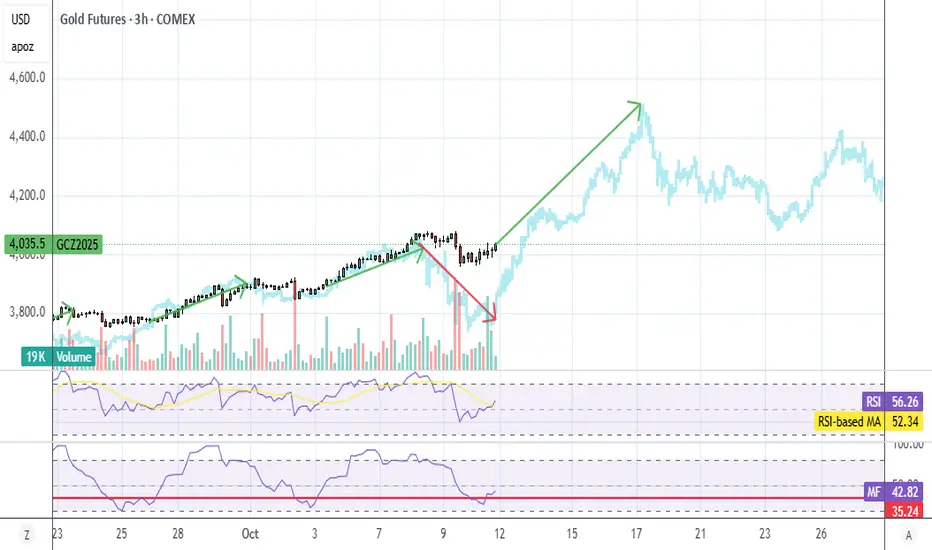
Gold GC1 UpdateI said earlier this week that it's supposed to drop but will wind up going sideways instead and it did. I put my money where my mouth is, and went long on GLD calls and ETF because my MFI indicator went oversold then crossed back over the red line.
We'll see if I'm right or not and if the 3hr MFI
GOLD | Intermediate Top ReachedI believe gold has reached an intermediate-term peak and is positioned for a significant pullback. However, this correction doesn't signal the end of gold's long-term bullish trajectory.
Price Targets:
Initial target: ~$4000 level
Final target: ~$3700 level

See all ideas
Summarizing what the indicators are suggesting.
Neutral
SellBuy
Strong sellStrong buy
Strong sellSellNeutralBuyStrong buy
Neutral
SellBuy
Strong sellStrong buy
Strong sellSellNeutralBuyStrong buy
Neutral
SellBuy
Strong sellStrong buy
Strong sellSellNeutralBuyStrong buy
A representation of what an asset is worth today and what the market thinks it will be worth in the future.
Displays a symbol's price movements over previous years to identify recurring trends.
Frequently Asked Questions
The current price of Gold Futures is 4,096.3 USD / APZ — it has fallen −0.91% in the past 24 hours. Watch Gold Futures price in more detail on the chart.
The volume of Gold Futures is 41.45 K. Track more important stats on the Gold Futures chart.
Open interest is the number of contracts held by traders in active positions — they're not closed or expired. For Gold Futures this number is 363.15 K. You can use it to track a prevailing market trend and adjust your own strategy: declining open interest for Gold Futures shows that traders are closing their positions, which means a weakening trend.
Buying or selling futures contracts depends on many factors: season, underlying commodity, your own trading strategy. So mostly it's up to you, but if you look for some certain calculations to take into account, you can study technical analysis for Gold Futures. Today its technical rating is buy, but remember that market conditions change all the time, so it's always crucial to do your own research. See more of Gold Futures technicals for a more comprehensive analysis.