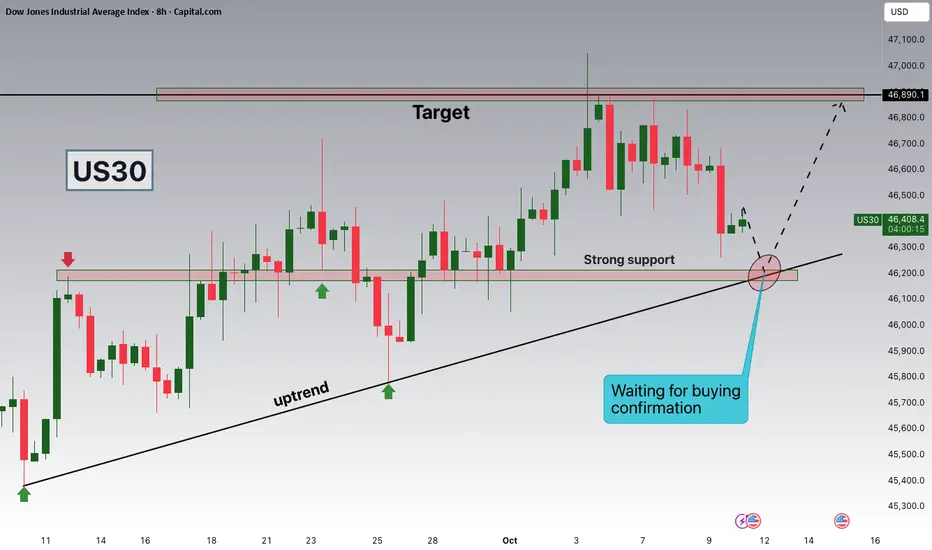
US30 Eyes 46,200 Support as Bulls Prepare for Next Leg Higher!Hey Traders,
In today’s session, we’re monitoring US30 for a potential buying opportunity around the 46,200 zone. The Dow Jones remains within a clear uptrend, and price is currently in a healthy correction phase, approaching a key confluence of support and trendline structure near 46,200.
A sustai
About Dow Jones Industrial Average Index
Dow Jones* often refers to the Dow Jones Industrial Average, which was one of the first stock indices and is one of the most commonly referred to barometers of equity performance in the United States. The Dow Jones Industrial Average, not to be confused with the Dow Jones Transportation index (which was the first index), is often called, "the Dow" or "DJIA," and consists of thirty stocks which traditionally were industrial-based. But in recent years as the US economy has become more consumer-oriented, the index has seen a change in composition that no longer has much to do with direct industrial investment.
Related indices
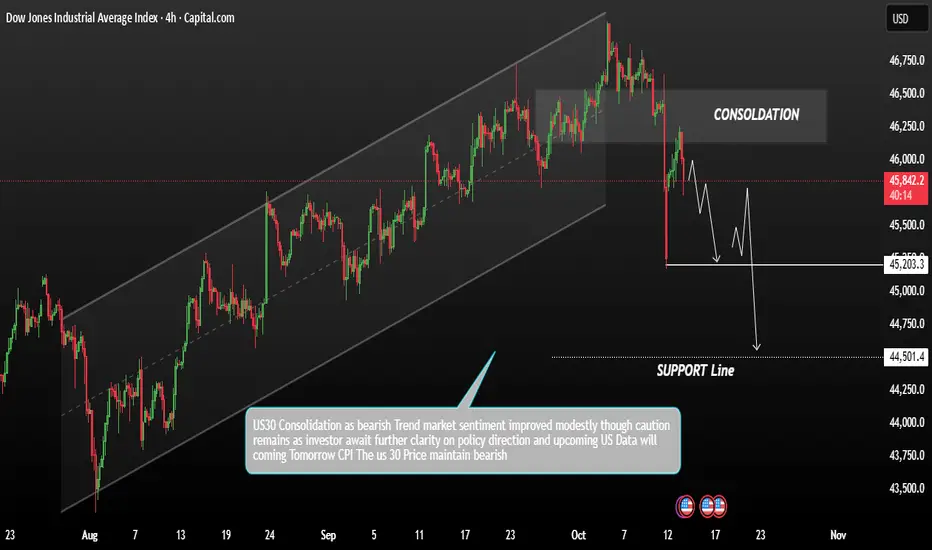
US30 remains in a broader bearish trendThe US30 futures advanced on Monday, recovering from Friday’s pullback as investors shifted back into risk assets following reports of a softer stance from former President Trump on China. This improved sentiment led to short-term buying across U.S. equity futures.
Technical Analysis
Technically,
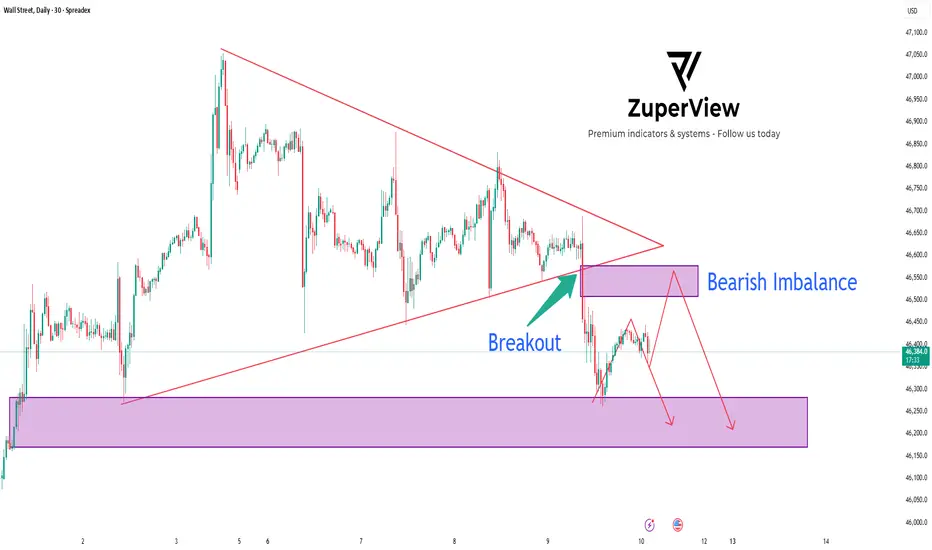
US30: Triangle breakout signal deeper sell move
📉 US30 Analysis: 4-Layer Resistance, Bearish Imbalance & Triangle Breakout | TradingView
The SPREADEX:DJI just printed a clean bearish breakout from a symmetrical triangle pattern on the 30-minute chart 🕒.
What makes this setup stand out is the 4-layer resistance zone perfectly overlapping with
US30 Long Trade, US30 to hit 47,317CAPITALCOM:US30 Long Trade
Entry: 46,321 - 46,700
TP: 47,317
This is good trade.
Don't overload your risk like Greedy gambler!!!
Be Disciplined Trader, risk what you can afford.
Use proper risk management.
Disclaimer: Trading is risky, only idea, not advice.

US30Seeing Bullish opportunity on US30.
The market has presented buy bias based on support & resistance strat.

DowJones trend change? Key resistance zone at 46262Key Support and Resistance Levels
Resistance Level 1: 46262
Resistance Level 2: 46476
Resistance Level 3: 46700
Support Level 1: 45433
Support Level 2: 45253
Support Level 3: 45025
This communication is for informational purposes only and should not be viewed as any form of recommendation as

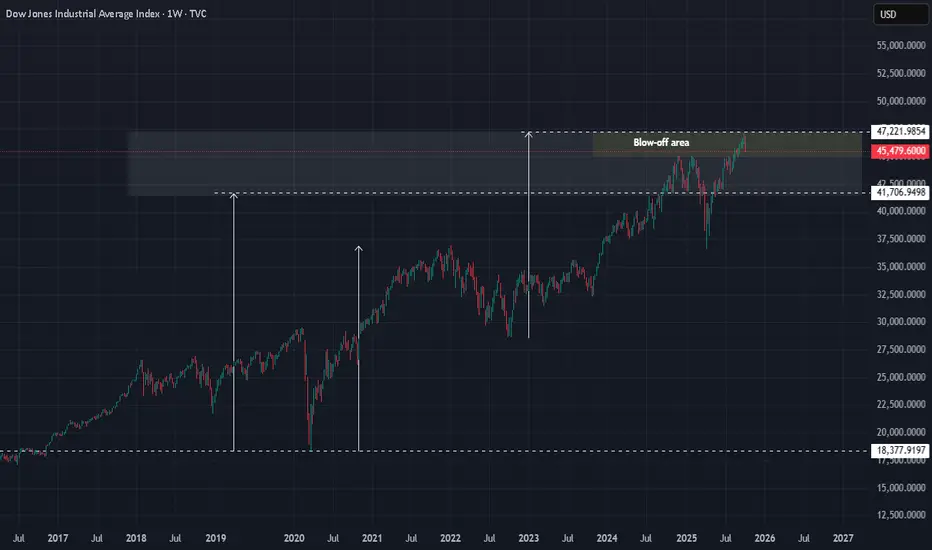
DJI : Remember what I wrote on 26/11/2024Long ago, I put up this chart.
Thanks to Trump, it is finally a reality.
Price has nowhere else to go but DOWN.
This is the kind of MONEY you can make by being patient.
Good luck.
NASDAQ 100 ShortRetracement function on the daily chart...
Price has filled the inefficiency on the daily chart here on NQ and formed a Reversal on all 3 correlated assets alongside Dow Jones 30 and S&P500
Anticipating price to drop down to the lows outlined before the end of next week 24 Oct 25', option puts??


US30 Short From Resistance!
HI,Traders !
#US30 went up sharply
But the price will soon hit
A wide horizontal resistance
Of 46641.8 from where we will
Be expecting a pullback and
A local move down !
Comment and subscribe to help us grow !

See all ideas
Summarizing what the indicators are suggesting.
Oscillators
Neutral
SellBuy
Strong sellStrong buy
Strong sellSellNeutralBuyStrong buy
Oscillators
Neutral
SellBuy
Strong sellStrong buy
Strong sellSellNeutralBuyStrong buy
Summary
Neutral
SellBuy
Strong sellStrong buy
Strong sellSellNeutralBuyStrong buy
Summary
Neutral
SellBuy
Strong sellStrong buy
Strong sellSellNeutralBuyStrong buy
Summary
Neutral
SellBuy
Strong sellStrong buy
Strong sellSellNeutralBuyStrong buy
Moving Averages
Neutral
SellBuy
Strong sellStrong buy
Strong sellSellNeutralBuyStrong buy
Moving Averages
Neutral
SellBuy
Strong sellStrong buy
Strong sellSellNeutralBuyStrong buy
Displays a symbol's price movements over previous years to identify recurring trends.
Frequently Asked Questions
The current value of Dow Jones Industrial Average Index is 45,952.25 USD — it has fallen by −0.65% in the past 24 hours. Track the index more closely on the Dow Jones Industrial Average Index chart.
Dow Jones Industrial Average Index reached its highest quote on Oct 3, 2025 — 47,049.64 USD. See more data on the Dow Jones Industrial Average Index chart.
The lowest ever quote of Dow Jones Industrial Average Index is 28.48 USD. It was reached on Aug 8, 1896. See more data on the Dow Jones Industrial Average Index chart.
Dow Jones Industrial Average Index value has decreased by −1.49% in the past week, since last month it has shown a 0.07% increase, and over the year it's increased by 7.60%. Keep track of all changes on the Dow Jones Industrial Average Index chart.
The top companies of Dow Jones Industrial Average Index are NASDAQ:NVDA, NASDAQ:MSFT, and NASDAQ:AAPL — they can boast market cap of 4.42 T USD, 3.80 T USD, and 3.67 T USD accordingly.
The highest-priced instruments on Dow Jones Industrial Average Index are NYSE:GS, NYSE:CAT, and NASDAQ:MSFT — they'll cost you 758.09 USD, 540.96 USD, and 511.61 USD accordingly.
The champion of Dow Jones Industrial Average Index is NYSE:GS — it's gained 43.04% over the year.
The weakest component of Dow Jones Industrial Average Index is NYSE:UNH — it's lost −35.97% over the year.
Dow Jones Industrial Average Index is just a number that lets you track performance of the instruments comprising the index, so you can't invest in it directly. But you can buy Dow Jones Industrial Average Index futures or funds or invest in its components.
The Dow Jones Industrial Average Index is comprised of 30 instruments including NASDAQ:NVDA, NASDAQ:MSFT, NASDAQ:AAPL and others. See the full list of Dow Jones Industrial Average Index components to find more opportunities.