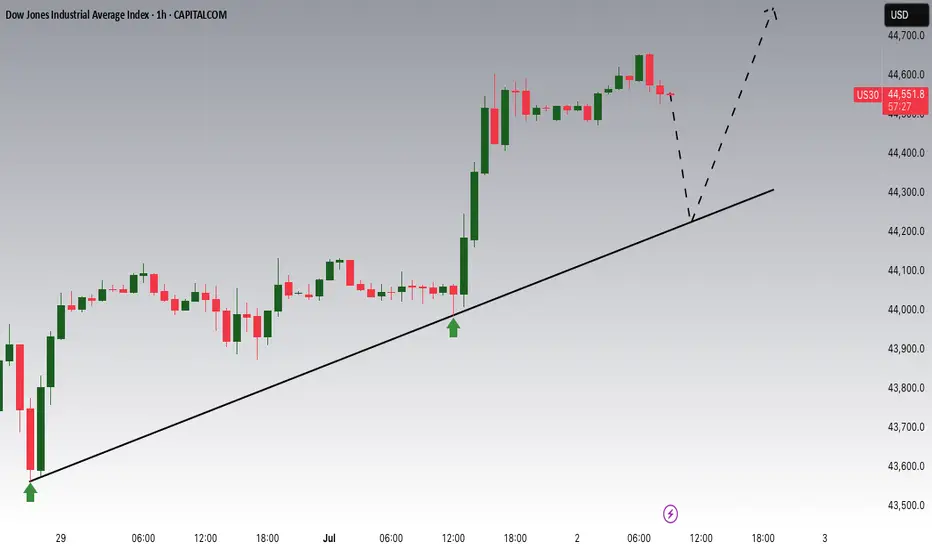
US30 Potential UpsidesHey Traders, in today's trading session we are monitoring US30 for a buying opportunity around 44,230 zone, Dow Jones is trading in an uptrend and currently is in a correction phase in which it is approaching the trend at 44,230 support and resistance area.
Trade safe, Joe.
About Dow Jones Industrial Average Index
Dow Jones* often refers to the Dow Jones Industrial Average, which was one of the first stock indices and is one of the most commonly referred to barometers of equity performance in the United States. The Dow Jones Industrial Average, not to be confused with the Dow Jones Transportation index (which was the first index), is often called, "the Dow" or "DJIA," and consists of thirty stocks which traditionally were industrial-based. But in recent years as the US economy has become more consumer-oriented, the index has seen a change in composition that no longer has much to do with direct industrial investment.
Related indices
Dow Jones -> A breakout rally of +40%!🐂Dow Jones ( TVC:DJI ) will create new highs:
🔎Analysis summary:
Since the April lows, the Dow Jones already rallied about +25%. This was simply the expected rejection away from a strong confluence of support. Now, the Dow Jones is sitting at the previous all time highs and about to break out

PCEs & attacks on PowellWe are carefully monitoring the PCEs today, to see, "wins" this small battle in the rate-lowering war. Let's dig in.
Let us know what you think in the comments below.
Thank you.
77.3% of retail investor accounts lose money when trading CFDs with this provider. You should consider whether you under

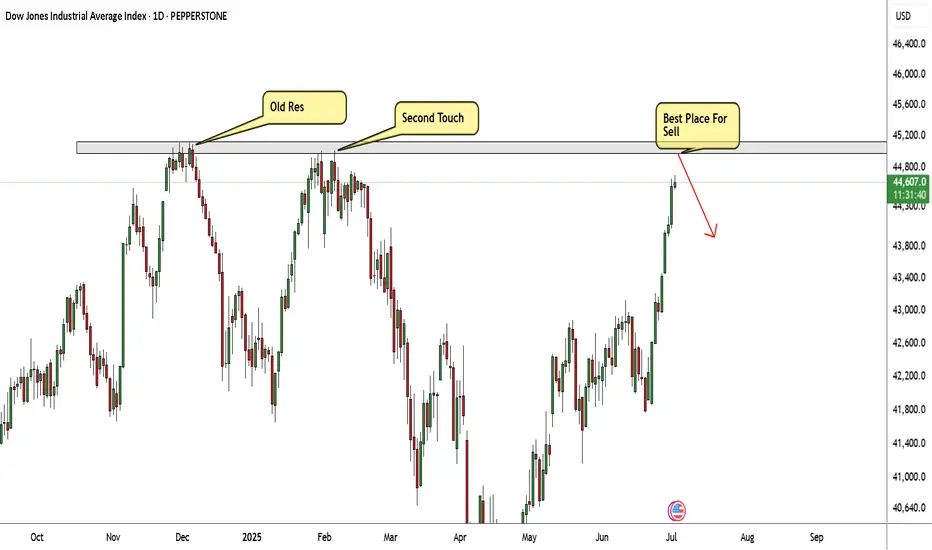
US30 Very Near Strong Res Area , Short Setup To Get 500 Pips !Here is my US30 Daily Chart , the price very near the highest price area , this res area forced the price to go down very hard 2 times so i think this time will be the biggest movement to downside , so i`m waiting the price to touch it and give me a good bearish price action and then we can enter a
US30: Will Go Up! Long!
My dear friends,
Today we will analyse US30 together☺️
The market is at an inflection zone and price has now reached an area around 44,585.50 where previous reversals or breakouts have occurred.And a price reaction that we are seeing on multiple timeframes here could signal the next move up so

US30 Awaits NFP – Bullish Above 44,410, Volatility Expected US30 (Dow Jones) – NFP Volatility in Focus
Today’s session is expected to be volatile due to the upcoming NFP report. Based on current forecasts, the outlook remains broadly positive for U.S. indices, though intraday swings are likely.
Technical Outlook:
As long as the price holds above 44,4

DOW Jones go upCMCMARKETS:US30
Reaching the price level of 45,082.74 is inevitable. From the current closing price, there is a high probability of continuation toward the ATH.
However, the price levels 44,440 and 44,344.95 are also acceptable zones from which the move toward 45,082.74 may begin.
At the start of

US30: The bullish trend remains in progressUS30: The bullish trend remains in progress
On April 7, 2025, US30 hit its lowest point at approximately 36500. Since then, despite significant concerns regarding Trump's tariffs and the ongoing turmoil in the Middle East, all indices have been on the rise.
Overall the U.S. indicators are showing

Us30 (buy)a perfectly formed head and shoulders, neckline broken,all indications shows us30 is on bull run to 45,00-46,00 wont be surprised if it makes a new ath
Wait for pullbacks and enjoy the run

DOW JONES: Final phase of bullish wave has started.Dow is practically overbought on its 1D technical outlook (RSI = 69.306, MACD = 518.450, ADX = 36.217) but that should little affect the heavily bullish price action on the long term. The reason is that after the April bounce on the 1W MA200, Dow entered the final phase of the Bull Cycle that starte

See all ideas
Summarizing what the indicators are suggesting.
Oscillators
Neutral
SellBuy
Strong sellStrong buy
Strong sellSellNeutralBuyStrong buy
Oscillators
Neutral
SellBuy
Strong sellStrong buy
Strong sellSellNeutralBuyStrong buy
Summary
Neutral
SellBuy
Strong sellStrong buy
Strong sellSellNeutralBuyStrong buy
Summary
Neutral
SellBuy
Strong sellStrong buy
Strong sellSellNeutralBuyStrong buy
Summary
Neutral
SellBuy
Strong sellStrong buy
Strong sellSellNeutralBuyStrong buy
Moving Averages
Neutral
SellBuy
Strong sellStrong buy
Strong sellSellNeutralBuyStrong buy
Moving Averages
Neutral
SellBuy
Strong sellStrong buy
Strong sellSellNeutralBuyStrong buy
Displays a symbol's price movements over previous years to identify recurring trends.
Frequently Asked Questions
The current value of Dow Jones Industrial Average Index is 44,828.54 USD — it has risen by 0.77% in the past 24 hours. Track the index more closely on the Dow Jones Industrial Average Index chart.
Dow Jones Industrial Average Index reached its highest quote on Dec 4, 2024 — 45,073.63 USD. See more data on the Dow Jones Industrial Average Index chart.
The lowest ever quote of Dow Jones Industrial Average Index is 28.48 USD. It was reached on Aug 8, 1896. See more data on the Dow Jones Industrial Average Index chart.
Dow Jones Industrial Average Index value has increased by 4.05% in the past week, since last month it has shown a 5.97% increase, and over the year it's increased by 13.90%. Keep track of all changes on the Dow Jones Industrial Average Index chart.
The top companies of Dow Jones Industrial Average Index are NASDAQ:NVDA, NASDAQ:MSFT, and NASDAQ:AAPL — they can boast market cap of 3.89 T USD, 3.71 T USD, and 3.19 T USD accordingly.
The highest-priced instruments on Dow Jones Industrial Average Index are NYSE:GS, NASDAQ:MSFT, and NYSE:CAT — they'll cost you 723.68 USD, 498.84 USD, and 397.86 USD accordingly.
The champion of Dow Jones Industrial Average Index is NYSE:IBM — it's gained 64.14% over the year.
The weakest component of Dow Jones Industrial Average Index is NYSE:UNH — it's lost −37.93% over the year.
Dow Jones Industrial Average Index is just a number that lets you track performance of the instruments comprising the index, so you can't invest in it directly. But you can buy Dow Jones Industrial Average Index futures or funds or invest in its components.
The Dow Jones Industrial Average Index is comprised of 30 instruments including NASDAQ:NVDA, NASDAQ:MSFT, NASDAQ:AAPL and others. See the full list of Dow Jones Industrial Average Index components to find more opportunities.