Distribution on DJTSeeing distribution on Dow Jones Transportation index on monthly chart.
Dow Jones Transportation Index is going down.
DJT trade ideas

An Overbought RSI Can Stay OverboughtAs seen, the DJT stayed overbought for a long time, in a "stepping stone" kind of move. On the other hand, if FDX knocks this down enough today, it could be a good sell-signal for other indexes.

Impact Analysis: Major Events and Their InfluenceI've conducted extensive research on various impactful events such as interest rate cuts, hikes, U.S. elections, major recessions, pandemics, and more, compiling the data into a comprehensive chart. While additional information like major conflicts and wars could be included, the chart already provides a clear representation of how these events have influenced market trends.

DJT - transports are not looking goodDJ:DJT Transports are getting killed. August was a significant change in trend. A test of the light blue area is possible and could like up with early Nov with mid Dec as possible rebound if the time zones remain relevant.

Dow Jones Transporatation and S&P 500, risk-on alertDow Jones Transporatation and S&P 500, risk-on alert,
watch closely 14100 and 4180 for potential start of bleeding.


Dow Jones Transport tends to predict inflationThe yellow line is inflation and the candles show the Dow Jones Transport index which represents the fortunes and costs of transportation companies. Transport is a major cost to getting products to market and so if DJT is going up it often then is reflected in the official inflation rate after a lag.
Right now DJT is in a downtrend since the middle of this year. Unless it bounces from here and starts to make higher highs the DJT as a predictor of inflation suggests that inflation is contained. As I showed in my RINF chart, this isn't what is anticipated by the market.

DOW TRANSPORTATION .50 % and 618% The wave structure can be counted as a wave 4 drop this would setup the last wave up from today as the setup for support is been seen today . and put call models are set and oil is setup to break from 93/95.5 back to under 84 /79 this would be supportive for the djt

Dow Jones Industrial Average Key MomentMACRO MONDAY
Dow Transportation Average Index DJ:DJT
The Dow Jones Transportation Average (DJT) is a price-weighted average of 20 key transportation stocks traded in the United States.
The transportation sector acts as a leading indicator as it is further up the value chain ahead of the final products being sold by companies in Dow Jones Industrial Average $DJI. For this reason, in some circumstances we can use the DJT as a helpful leading indicator for the direction of the economy
Currently we are at a critical juncture on the DJT chart as we are testing significant resistance levels
- The DTJ Index is at a critical diagonal and horizontal
resistance level
- A break through or rejection of the resistance will
provide insight into the direction of the economy
- There is a potential Head and Shoulders pattern
that needs to be validated or invalidated which will
be defined by the price reaction to the resistance
zone.
We can observe what happens over the coming weeks and how price reacts to the resistance. Can it break above it and turn it into support?
When the DJI is climbing higher while the DJT is falling, it can be a signal of economic weakness ahead. A divergence of this sort means goods are not being transported at the same rate they are being produced, suggesting a decline in nationwide demand.
This type of divergence occurred prior to the March 2020 crash with the DJT making its ATH in Dec 2020, thereafter the DJI made a new ATH in February 2020 whilst the DJT was closing almost 5% lower making a lower high. Those that study Dow Theory were key observers of the divergence and acted accordingly safeguarding their portfolios.
Thankfully, at present there is no divergence. I will follow up in the comments with a chart showing that the DJI and the DJT are currently very closely aligned. Regardless paying close attention for a divergence could be very beneficial for your portfolio. I will certainly be on the look out and notify you in the event of.
Thanks for reading and welcome to Macro Mondays
PUKA


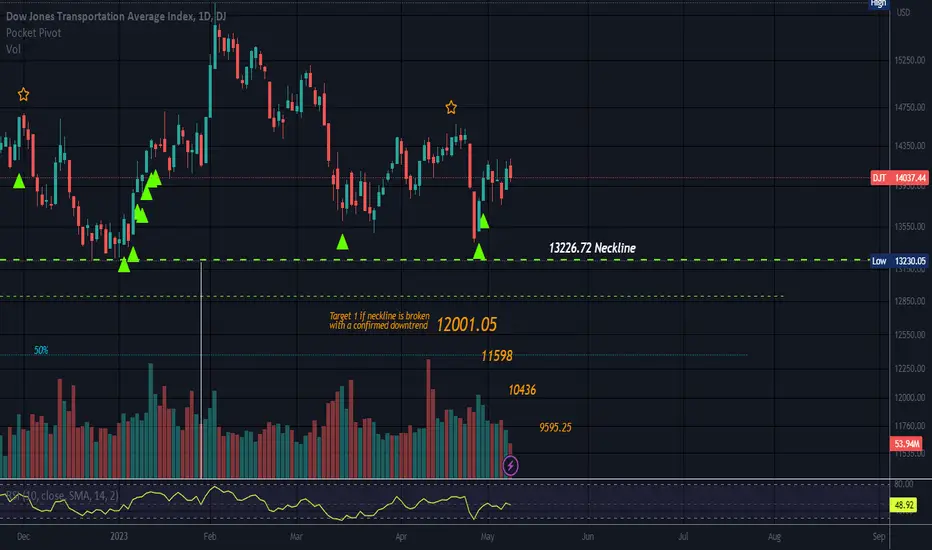
POSSIBLE HEAD & SHOULDERSPrice is well above the neckline.
ES would be a break of the neckline which strong support until broken.
Price is at a resistance level today.
This pattern is not valid until the neckling is broken with a confirmed downtrend.
No recommendation.

$DJT: Dow Jones Transportation Average Not Confirming The RunIf you wanted to know whether or not the market was on a bull run or not, all you had to do was look at the Dow Jones Transportation Average or even AMEX:RSP (which definitely does not fit the bull market, showing that overall the S&P 500 has barely broken 15% gain since October).
More important though is the transportation average breaking off from the rally ahead of the rest of the market. When transportation is leading us lower this is not a good sign for the economy. Other economic indicators support this thesis. For example, cardboard box demand is the lowest it's been since 2008. Showing signs of a decline in goods demand.
For more insights on trading and investing check out the Equity Channel Podcast on Apple, Spotify and Amazon.

DJTThat right shoulder for the H&S has now turned into a falling Wedge pattern.
Today transport has broken out, Price has gapped up pass all moving averages .
Usually DJT leads the Dow, let's see what happens

Head and Shoulders Price is above the neckline of this pattern and it is not valid until the neckline is broken.
The neckline is strong support until broken.
Targets for a break to downside are listed in orange. T1 listed in larger type than T2 and so on.
Sometimes T1 is all we get.
No recommendation
💥 WORLD ECONOMY: ...big drop is coming? 😡Amazon rarely delays deliveries, but I ordered the crystal ball over 30 years ago and it still hasn't arrived! 😢😂 ...So, I don't know what will really happen in the coming months, but what we can do right now is try to make some considerations.
The chart above represents the DJ Transportation Index , an excellent "thermometer" of US economy. If we look at a monthly time frame, we see that a deep pullback appeared after a structure with "Wave 1 Extension", so we cannot exclude that it could happen again. At the same time however, we see that the Price Action has reached an important static support around 14,000, and only its failure could confirm a bearish leg with a first target around 11,000, obviously we are talking about a monthly chart, so to confirm this hypothesis, we have to wait until the end of the month.
In this historical context, many things could change in global economy, and the geopolitical situation is one of the main actors of this period. Inflation, the war in Ukraine, wide social gap, the dollar crisis, are all key factors that could still lead to uncertainty in the medium term.
INFLATION and THE PRICE WAR
We are well aware that a large part of the developed economy is struggling with rising prices, and even if inflation in the U.S. and in Europe it is driven by different reasons, Central Banks are using the same tools (are they wrong??) of monetary policy, , but something could change in the coming months. The most important Central Bank (Federal Reserve) could face a diabolical "pincer", because the danger of hyperinflation is the same as a potential stagflation.
Thanks for your attention.
A.B. ❤

DOW TRANSPORTATION JUST STARTING DOWNThe chart posted is that of the DJT . As everyone is focused on the qqq and sp 500 and the flight to safety in tech DO NOT ASK ME WHY BTW . The markets are now in the HOPE stage. This is usually followed by Fear and then Despair . and then the last stage Denial . that is the BOTTOM

Dow jones transportation Bearish as it gets..
If we break below 13,752
We are headed back to October lows..
This drop will effect all airlines stocks along with Ups And fedex

DJT....Have we seen this before?Similar pattern appearing on the DJT.
Will we see the upside move completed or will it fail like it did in 2018/2019.

Intraday DOW momentum Intraday DOW momentum, market seems to retrace most of the positive direction. All eye on the FED and their guidance will be the only thing that can change things. So there you go.

Dow jones TransportIf you like trading in airline stocks, Fedex, and UPS
This is the index you need to watch!
Approaching resistance same as dow.
If we breakout, there is a 7% upside move to whiteline target.
If we reject, possible doubletop back to 12k

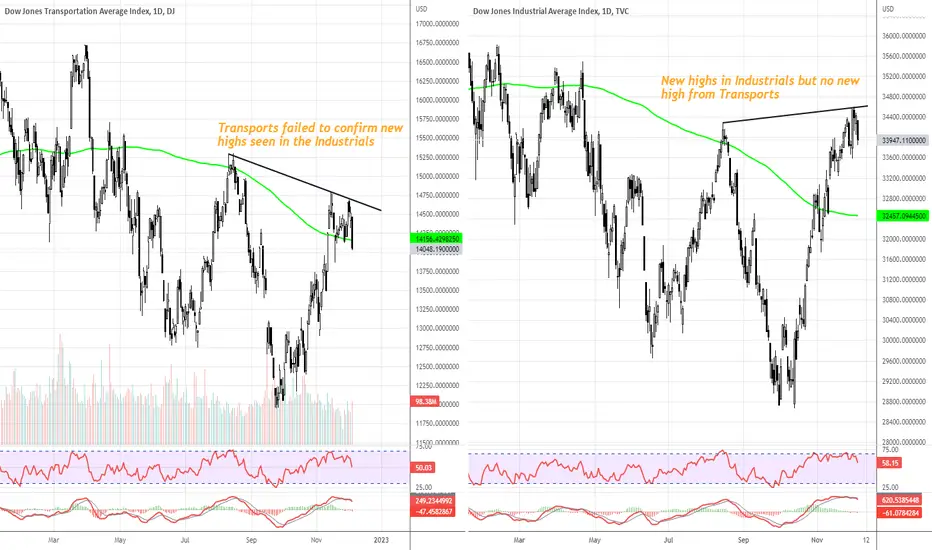
#DOWTHEORY transports failing to confirm new highs in industrialIf you believe in Dow Theory then the fact that transports have not been able to make a new high compared to the August Swing highs, should make you doubt the new highs seen in the industrials. Normally this is a sign of underlying weakness so the expectation would be for further weakness to come in general equities.

Dow Jones Transport daily frame (leading diagonal target 11,750)this count gives the possibility that the leading diagonal hasn't completed unless 13,453 price level is broken and the final fifth wave of this subwave will near 11,750
the throwover in the fourth position would equal a price break of the parallel trendline or a possible bottoming out in the midline of that same parallel trendline
