ETHBTC Opportunity Buy: Major 2025 AltcoinSeason & Bull MarketThis is the big one and the good one. ETHBTC was bearish since December 2021 but this cycle finally came to an end in April this year. After the initial bullish breakout and higher low we can clearly see some bullish action developing; three consecutive weeks green. The bullish bias is now confirmed
Related coins

ETH/BTC: Golden Cross Reloaded?This is ETH/BTC on the daily chart.
A major event is about to unfold: the golden cross, where the 50MA crosses above the 200MA.
The last time this happened was in early 2020, around the same price zone, right after a bounce off the 2019 low double bottom and a rejection from the 0.5 Fib level, whic

ETH/BTC Reclaiming Macro Bottom — Altcoin Momentum Incoming?ETH/BTC tagged its 2019 cycle low back in April 2025 — a key macro support level that’s held up for nearly six years. Since then, it’s printed a clean rebound followed by a textbook retest. Now it's threatening to break out of the pullback structure formed over the past few months. If this breakout

ETH/BTC Poised for a Breakout: A Technical and Fundamental ViewA confluence of technical signals on the weekly ETH/BTC chart, coupled with significant fundamental developments for both Ethereum and Bitcoin, suggests a potential upward move for the pairing in the coming weeks.
Technical Analysis (TA)
The weekly chart for ETH/BTC on Binance reveals a potential

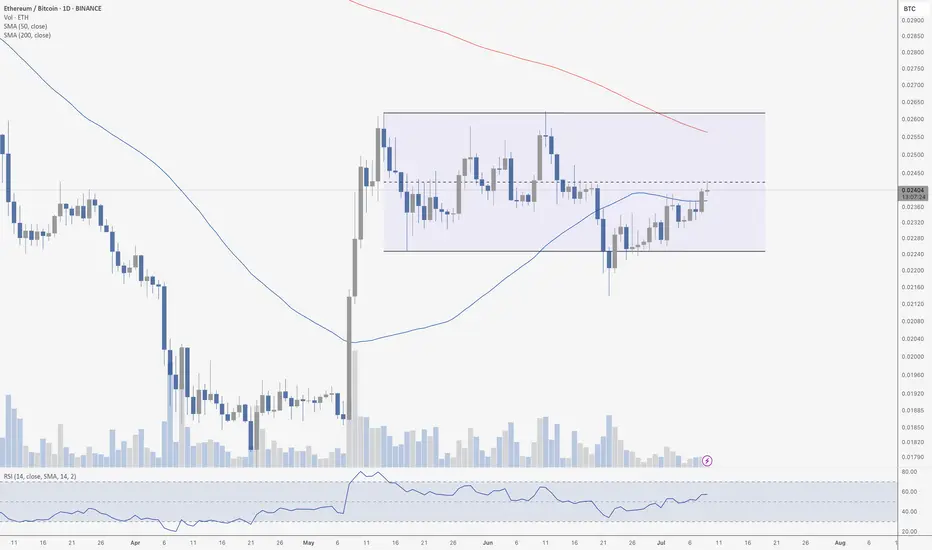
ETH Flips 50 MA Against BTCThe ETH/BTC daily chart shows a prolonged consolidation phase following the explosive breakout in early May. Since then, price has been range-bound between approximately 0.022 and 0.026. We're currently sitting near the EQ (equilibrium) of the range – around 0.0240 – which often acts as a temporary
ETH/BTC AT 200 MA RESISTANCEQuick update on ETH/BTC. As discussed, ETH is finding strong resistance at the daily 200 MA, riding it down for 5 days. On the ETH/USD chart, the 50 and 200 MAs are in the rearview. A break above the 200 MA on the daily chart vs. BTC could signal a major move in altcoins.

Wajani Investments: ETHBTC Analysis
ETHBTC has formed a bullish flag (rectangle) which signifies trend continuation. Aside from that, there’s a bullish wedge still supporting a move to the upside. This analysis shows we would have a Leg2 move like Leg1 and even higher. This is a good trade with a 1:3 risk.
Remember, trading always ca

ETH/BTCPrice is following an AMD structure with a liquidity sweep to the downside. For full confirmation of the setup, a daily FVG inversion is required.
Watching closely — confirmation will unlock further directional bias.

Time to Eth BitcoinIn advance, Ethereum would like a second plate of Bitcoins this cycle please because despite what you may have heard, there is a new Sheriff in town equipped with "smart contracts" and Ethereum is the name. While Bitcoin was paving the way, Ethereum was at home building a vehicle for the pavement.

ETH/BTC At 50 MA ResistanceEthereum is battling the daily 50 MA on the ETH/BTC chart, a key area of resistance. If it beaks above, we could see a nice altcoin rally and Ethereum outperforming. If it gets rejected… more of the same.

See all ideas
Summarizing what the indicators are suggesting.
Oscillators
Neutral
SellBuy
Strong sellStrong buy
Strong sellSellNeutralBuyStrong buy
Oscillators
Neutral
SellBuy
Strong sellStrong buy
Strong sellSellNeutralBuyStrong buy
Summary
Neutral
SellBuy
Strong sellStrong buy
Strong sellSellNeutralBuyStrong buy
Summary
Neutral
SellBuy
Strong sellStrong buy
Strong sellSellNeutralBuyStrong buy
Summary
Neutral
SellBuy
Strong sellStrong buy
Strong sellSellNeutralBuyStrong buy
Moving Averages
Neutral
SellBuy
Strong sellStrong buy
Strong sellSellNeutralBuyStrong buy
Moving Averages
Neutral
SellBuy
Strong sellStrong buy
Strong sellSellNeutralBuyStrong buy
Displays a symbol's price movements over previous years to identify recurring trends.