RR=1.5 sell ideabearish shark pattern + RSI divergence + bearish ABCD pattern : expecting the price to correct in order to retest 1.8 level
PS : never risk more than 2% of your capital per trade
EURNZD trade ideas

EUR/NZD BEARS WILL DOMINATE THE MARKET|SHORT
Hello, Friends!
EUR-NZD uptrend evident from the last 1W green candle makes short trades more risky, but the current set-up targeting 1.801 area still presents a good opportunity for us to sell the pair because the resistance line is nearby and the BB upper band is close which indicates the overbought state of the EUR/NZD pair.
✅LIKE AND COMMENT MY IDEAS✅

EURNZDWe looking for selling opportunities as long we under the ceiling zone resulting in selling opportunities to the downside| 1H TIMEFRAME

EURNZD Set To Fall! SELL!
My dear friends,
EURNZD looks like it will make a good move, and here are the details:
The market is trading on 1.8055 pivot level.
Bias - Bearish
Technical Indicators: Supper Trend generates a clear short signal while Pivot Point HL is currently determining the overall Bearish trend of the market.
Goal - 1.7932
Recommended Stop Loss - 1.8125
About Used Indicators:
Pivot points are a great way to identify areas of support and resistance, but they work best when combined with other kinds of technical analysis
———————————
WISH YOU ALL LUCK

EURNZD bearish temporary to start big bullishIn general the price in uptrend, in short time it will correction to 1.7932 which is OB then retracement because it rebound two times from current resistance and didn't brook previous high.
Yo can sell from current price and stop loss 1.80879
Keep on mind if hit stop loss and then return and close under resistance sell it again with same stop loss.

EURNZD SELL 4HAfter a bearish candle within the specified range, we enter a sell transaction.
Close a percentage of the transaction at the specified targets.
be profitable
tp1 : 50%
tp2 : 25%
tp3 : 25%

EURNZD - Bearish trendPrice has failed to break above previous higher high showing sign of weakness in the bullish trend. Bearish momentum will be strong if price breaks below 1.80100, Wait for the confirmation for high probability setup.

EURNZD Technical Analysis! BUY!
My dear subscribers,
This is my opinion on the EURNZD next move:
The instrument tests an important psychological level 1.7867
Bias - Bullish
Technical Indicators: Supper Trend gives a precise Bullish signal, while Pivot Point HL predicts price changes and potential reversals in the market.
Target - 1.7897
About Used Indicators:
On the subsequent day, trading above the pivot point is thought to indicate ongoing bullish sentiment, while trading below the pivot point indicates bearish sentiment.
———————————
WISH YOU ALL LUCK

EURNZD / H1 / SHORTEURNZD may experience a downfall from the Bearish Order Block
Bearish Order Block: 1.79619 and 1.79393
EURNZD is nearing the Bearish Order Block, and there is a high probability that the price will drop after touching this level. Let's see how the price reacts, but the chances for a downward movement are strong. I’ve used the Smart Money Concepts (SMC) strategy to analyze this chart.
Entry price :- 1.79568
Take profit :- 1.78876
Stop Loss :- 1.80260

EURNZD DROPING EURNZD is in a long-term downtrend, characterized by lower highs and lows, breaking key support levels, and trading below major moving averages, driven by Eurozone economic concerns and NZD strength.


EURNZDIn these analysis i see an uptrend move which I believe in my analysis that it will go to my direction which I suggested.
always apply risk management and trade with less emotion

EURNZD LONGStructural bias at the moment is to the upside from my point of view, and currently an inverse H & S pattern is partly formed.. Although i missed the initial entry opportunity as price retested the AOI previously. But i believe price will try to take part in another retest of that same AOI probably when price experience a rejection from the resistance line. Either way finger crossed..
For my choice of take profit level, its a very strong idea i have no doubt price will smash it, and after that ill see how price reacts and will decide if take profit 2 level which is the next resistance area will be hunted.

EURNZDTraders! This pair is impressing guys! We can see a bigger moves to the downside and one of the trades, that will be good for those who like to swing when we have the confirmation that we are waiting. I love the way structures are, everything has been confirmed so its the matter of waiting for the clear point to enter the market

EURUSD CHARTING IDEA W/ AMILIA
We're looking for the market to do a sell sweep, and then push back into a buy, so we're going to be looking at volatile buys and sharp bull engulfs.
We're going to use this chart to send out vault and team trades for the next 30 days and potentially plus, if it doesn't break out the demand era and our major resistance location.
2024-10-17

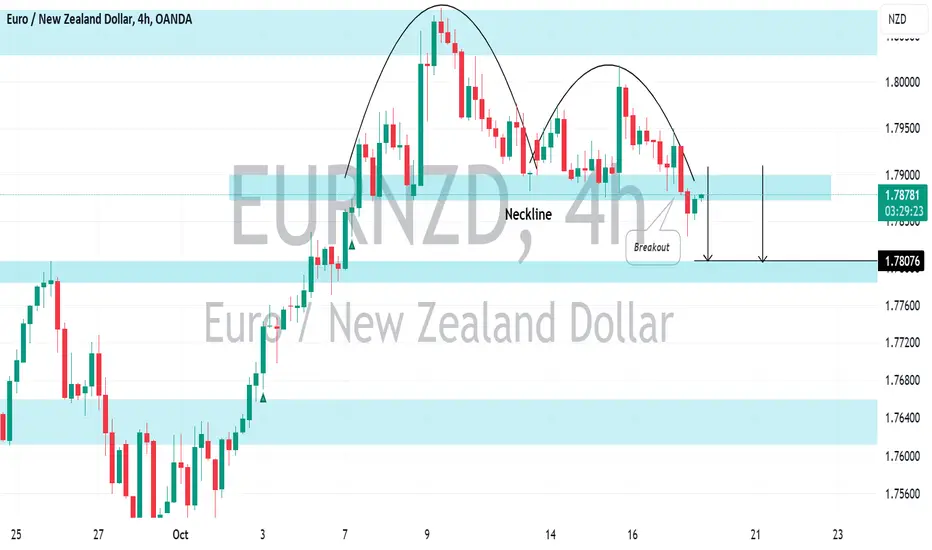
EURNZD: Time to Fall?!EURNZD has successfully formed a cup & handle pattern and has broken through its neckline on the 4-hour time frame.
This violation confirms a Change of Character (CHoCH) and suggests a potential bearish reversal in the near term.
The price is expected to decrease and potentially reach the support level at 1.7807.
EUR-NZD Will Grow! Buy!
Hello,Traders!
EUR-NZD went down
To retest the horizontal
Support level of 1.7825
And after the retest
A local bullish rebound
Will be expected
Buy!
Like, comment and subscribe to help us grow!
Check out other forecasts below too!

EURNZD BUY signal. Don't forget about stop-loss.
Write in the comments all your questions and instruments analysis of which you want to see.
Friends, push the like button, write a comment, and share with your mates - that would be the best THANK YOU.
P.S. I personally will open entry if the price will show it according to my strategy.
Always make your analysis before a trade

EurNzd expecting a reversal soonAt the moment market is choppy and it's hard to say what's a good place to sell,
Expecting a reversal anywhere in there are of 1.796 - 1.786,
Waiting for confirmations

EUR/NZD Pre ECB Rate DecisionEUR/NZD has fell tentatively on comments out the ECB.
Technical levels persist above and below, as drawn.

Technical Analysis: EURNZD Bearish ButterflyHello Traders,
Below is my Technical Analysis of EURNZD.
EURNZD has formed a bearish butterfly pattern with points X: 1.79369, A: 1.7442, B: 1.78702, C: 1.76273, D: 1.80786. The current price is 1.80379. Expectation for a drop to 1.78808 in the coming weeks. Additionally, a bearish divergence is noted on the Awesome Oscillator, indicating weakening bullish momentum.
Cheers and Happy Trading.

EURNZD: Preparing for a larger descentHello Traders,
We have an interesting setup on EURNZD. Between 23rd of Feb and 1st of May, we saw an upward move identified as a corrective wave ABC, with Wave C forming an ending diagonal. Recently, we saw a break of the ending diagonal pattern in wave C, setting the stage for a decline. The break of wave 1 to the downside further confirms our bearish outlook. As such I expect EURNZD to continue the downward movement.
However, if the price goes above 1.81557, my analysis of a drop will be invalid.
Cheers and happy trading!

