US30 trade ideas

US30 Bias fairly bearish for a short term till we drop back down to 38600 area . follow the arrows for directional market flow . look for sells inside the supply area and hold till we get to 38600 area

DJ30 FORECASTThe forecast for the Dow Jones 30 is now leaning towards a bearish trend. Prices are expected to fluctuate between 40050 and 39564. However, if the 4h candle closes below the pivot line at 39,564, the bearish pressure is likely to continue, potentially driving prices down to 39400 and 38825.
Key Levels:
Bullish Line: 39825, 40050, 40285, 40500
Pivot Line: 39564
Bearish Line: 39400, 39075, 38825, 38445

US30 (Toward Support Zone...)US30 Technical Analysis
The price dropped from the pivot line at 39,050, as we noted at the beginning of the week. It is currently heading towards 38,500 and 38,400. If the price stabilizes below this support zone, the bearish trend is expected to continue towards 38,020 and 37,820 for the week. Today, the price is anticipated to consolidate between 38,500 and 38,790 until a breakout occurs.
A bullish scenario will be activated if the price breaks above 38,790, targeting 39,050.
Pivot Line: 38,675
Resistance Levels: 38,790, 39,050, 39,350
Support Levels: 38,410, 38,020, 37,820
Today's expected movement range is between the support level at 38,400 and the resistance level at 38,790.
Previous idea:

US30 Market Shift: Bullish Targets and Key Liquidity ZonesGreetings, Traders!
Brief Description🖊️:
Currently, US30 has presented a market structure shift (MSS). Before this shift, we observed the price taking H1 sell stops, indicating that smart money has paired orders. This MSS suggests the potential for bullish institutional order flow. The price has since pulled back into an M15 bullish order block.
Things I Have Seen👀:
Market Structure Shift🔄: The price has shifted, signaling potential bullish institutional order flow.
Order Block Support📈: The price has pulled back into an M15 bullish order block.
Liquidity Void🕳️: Yesterday's price action left a significant inefficiency (liquidity void). Today's trading will aim to fill this inefficiency, with the draw on liquidity targeting the last point of efficiency, the H1 bearish order block.
Bullish Targets📉:
H1 Bearish Order Block: The primary target for filling the liquidity void.
What's Important Now❗
We need to observe today's price action to see if it fills the inefficiency and reaches the H1 bearish order block.
Best Regards,
The_Architect

Dow Jones (US30) LONG worth a risk ?After big dump over last days that was overextended after yesterday's Saleforce earnings, the DOW finally is in the demand zone worth a risk.
On smaller timeframes we can see some demand building with Change of character and breaks of structure.
I opened long with a potential for a return to 39700 based on the new GDP data released, that is favoring interest rate cuts.
Stay safe and good luck :)

US30 Long BiasHello traders!
Hope you are all well.
I have my eyes set on this long position on the Dow. As you can see there are 2 solid demand zones.
3 options we have here:
1 - Combine both demand zones and increase risk on the position accordingly.
2 - Take the first trade from the higher zone, and if it breaks, buy the bottom demand zone.
3 - risk missing the first trade and wait for the bottom demand zone.
I will personally go with option number 2.
A new all time high is expected! Let's see! I am entering the trade the moment price hits the demand zone.
But, trade safe! ;)
Until next time!

US30 Range breakout
Order type : instant
Entry : 38209.34
SL : 38021.56
TP1 : 38413.82
TP2 : 38601.60
TP3 : open

US30 SELL NOW!!!!!!!!!!!US30 have been dropping from my first entry for over 5000pips now am seeing to take another entry from 38200 with tp 37694 am taking an entry from that zone because thats the retracement zone using fvg confirmations..

DOW JONES 4h. - Technical analysisMY ANALYSIS
The bearish trend is currently very strong for DOW JONES - MINI DJ30 FULL0624. As long as the price remains below the resistance at 39,463 USD, you could try to take advantage of the bearish rally. The first bearish objective is located at 38,537 USD. The bearish momentum would be revived by a break in this support. Sellers would then use the next support located at 37,991 USD as an objective. Crossing it would then enable sellers to target 36,795 USD. Be careful, given the powerful bearish rally underway, excesses could lead to a short-term rebound. If this is the case, remember that trading against the trend may be riskier. It would seem more appropriate to wait for a signal indicating reversal of the trend.
MY OPINION
BEARISH UNDER 39,463 USD
MY TARGETS
38,537 USD (-1.56%)
37,991 USD (-2.95%)

DOW in H4 chart Hello
I have published my idea about DOW in an another chart and that's following our forecasts step by step, but I have decided to show you a little more detailed chart in EW aspect.
This is a simple model of Elliott counting that happens so common but there are some good points that's worth to be mentioned.
1. Alternation between (A) and (B) is "pattern".
2. The reactions to the cannel's midline can make it more valid.
3. almost always MACD and RSI tell you the truth but if you have an standard set up
4. be aware of fake weak shadows
5. ?
There is a unique analytical structure that can happen very rarely and it is mentioned in the chart; could you tell me what it is!!!!!
For trading set up: you have to wait till trend meet the confirmation or invalidation levels.
Thanks

US30 BULLISH CONFIRMATION!!The bullish strength formerly develop is currently active as price trades at $38,153 level. A buy opportunity is envisaged from the current market price .
Target is 38,491

Dow Jones Yearly TemplateLast year in 2023, price was bouncing around the yearly candle's open and eventually blasted higher to form a bull expansion candle. The high to low of the entire year was 6,360 ticks and 20.24%. From the open of the year to the close, it was 4,566 ticks and a 13.77% gain.
This year in 2024, now that it is about half way through the yearly candle, is looking like a doji.
The range so far is small with only 2,978 ticks high to low. Only 8% from the low to high.
I have no clue what the rest of the year will bring. I am only looking at what it is doing in front of me.
There is really only three 2024 candles that can happen.
1. Buy low at the bottom of the yearly range under the teal blue 2024 Open price for a bullish run back up to the high for another bull expansion candle. (Bullish Expansion Candle)
2. Sell near the top of the range and hope the candle turns into a (bearish candle)
3. Play the ranges on both sides and the year goes sideways for a (small doji candle)
Usually after a big bullish expansion candle that we had in 2023, probabilities should say that we get more continuation or a bit of a rest as in a doji candle. I don't really see a bearish candle forming as of yet.

US30 (5.29.24) V1 Buy Opportunity Hello All - sorry for the absence I will continue to be absent until mid to end of June due to travel and moving. Possible buy opportunity coming up in a few minutes. if the 30min closes bullish look at the percentage(buying pressure over 50 percent). take the buy and and manage the trade accordingly.


US30 WE ARE DONE, WHAT'S NEXT!Hello Traders and everyone, I am Hadi Karaali, Known as SNIPERS_FX
If you like the idea, do not forget to support with a like and follow.
US30 WE ARE DONE, WHAT'S NEXT! 📚
👉As we mentioned in our previous analysis attached on the chart, Price rejected our massive rejection zone 40k and supply as well. Specially after breaking below the marked swing low.
👉Moreover, price is approaching a nice-looking support zone, lining up with our previous swing highs and lows, where we will be looking for new longs on lower time frame to confirm a new bullish movement, as the price is still overall bullish from a medium term perspective.
Unless price managed to break below our marked zone, then a movement lower would be expected, till the next demand zone, Where we will be again looking for new longs as well. 📚
If you like this kind of analysis don't forget to like and follow
and as usual follow your trading plan and manage your risk.
Be patient and good luck!

DJI will go up after a short correction to 36,000During the pandemic the DJIA has a big fall from 29,687 to about 18,200.
The Dow just hit 39,000 which is a key Fibonacci level, ( it is 61% above 29,687 when measuring from 18,200).
At this point the Dow will correct to about 36,000. This is about 61% below the a wave from the b wave.
From there the dow will go to about 43,000, completing a 5 wave structure in the monthly chart and a set up for a possible major correction in the coming months.

Bullish Dow JonesUS30 been bearish for bout 1 week and half, Price now reaching a bullish key level. We are goin to monitor price action on low timeframe and waiting for bulls to kick in.


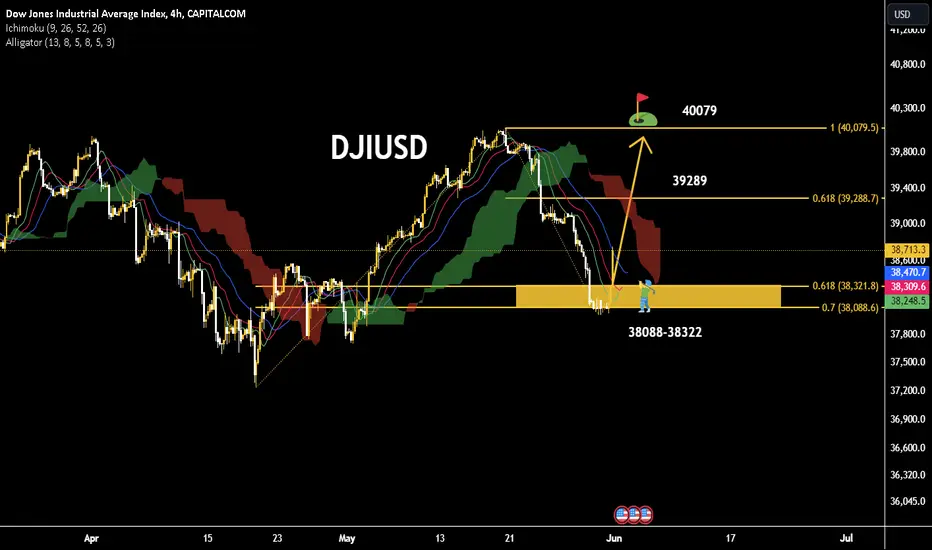
NEW IDEA FOR DOWJONES The increase in the Dow Jones index due to the increase in profits from the income of companies
By examining the trend in the four-hour time frame, the Dow Jones index, having an important support interval in the range of 38,322-38,088, can increase to the previous ceiling resistance in the range of 40,079, in the meantime, the 61.8% Fibo resistance will be seen at 39,289.
Us30 long Us30 looking for correction buy momentum...still in bearish trend but correction needed at this moment... this long entry is important for trend continuation

US30 Alert: Key Sell Opportunity and Potential Bullish Surge!Greetings Traders!
Brief Description🖊️:
Today, I am focusing on trading the US30, with an interest in taking a selling opportunity to reach the H4 bullish order block.
Things I Have Seen👀:
Liquidity Engineering🔄: Currently, price is engineering liquidity right above the H4 bullish order block using a retail pattern (support zone).
Confirmation Buy Zone🟢: Once the price reaches the H4 bullish order block, I will look to buy against the sell stops (stop losses) upon confirmation.
Bullish Targets📈:
-1st Objective (H1 Buy Stops): Anticipating price having to reach into the H1 buy stops, which is high probable.
-2nd Objective (Daily FVG): Anticipating a minor bullish run to reach and potentially fill the DAILY timeframe Fair Value Gap (FVG).
What's Important Now❗
Time is crucial. I only trade indices during the New York session morning and afternoon due to the favorable volatility. Stay observant for real-time developments.
Stay tuned for a video analysis on the US30.
Best Regards,
The_Architect

