Nearly UK time to shine to 9,721Now it looks like it's UK time to shine.
It is priming for a strong breakout above the Cup and Handle.
Once it breaks the brim, it could be all upside to 9,721.
Large Cup and Handle
Price near above 20 and 200
Target 9,721
Disclosure: I am part of Trade Nation's Influencer program and rece
About FTSE 100 Index
The UK Financial Times Stock Exchange 100 is an index of share prices of the largest 100 companies listed on the London Stock Exchange (LSE) by market capitalisation. The index was launched on January 3, 1984 at a base value of 1000, and the index level is calculated in real-time.
Related indices

FTSE Oversold rally resistance at 8820The FTSE remains in a bullish trend, with recent price action showing signs of a corrective pullback within the broader uptrend.
Support Zone: 8695 – a key level from previous consolidation. Price is currently testing or approaching this level.
A bullish rebound from 8695 would confirm ongoing ups

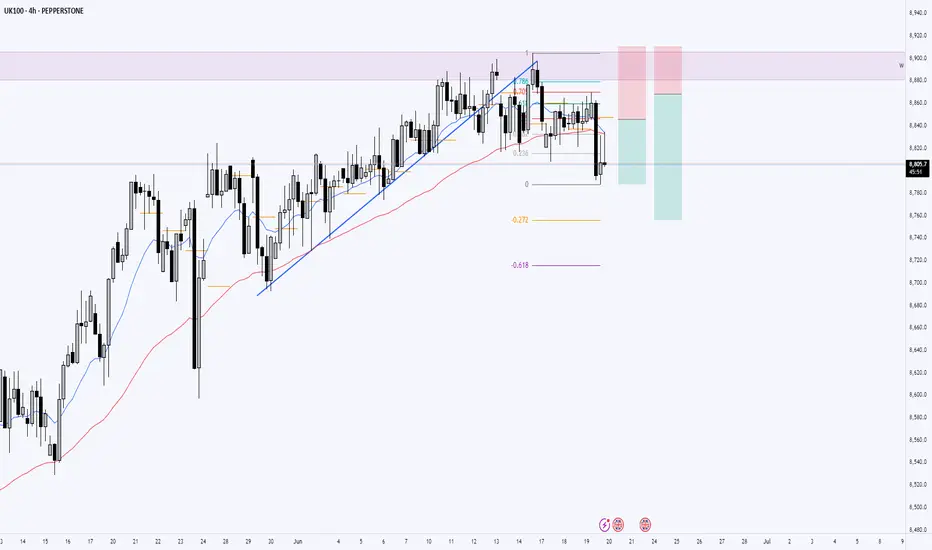
UK100 [Consolidation Below Resistance] – Will Bulls Break Out?After a strong recovery from the April lows, UK100 has been trending upward, recently stalling just below the 8,912.17 resistance level. The price action is currently consolidating between the 8,809.57 support and the key resistance. The structure remains bullish overall, though the momentum has sli

FTSE100 oversold rally testing resistance at 8820The FTSE remains in a bullish trend, with recent price action showing signs of a corrective pullback within the broader uptrend.
Support Zone: 8695 – a key level from previous consolidation. Price is currently testing or approaching this level.
A bullish rebound from 8695 would confirm ongoing ups

FTSE 100 Wave Analysis – 27 June 2025
- FTSE 100 reversed from support level 8700.00
- Likely to rise to resistance level 8900.00
FTSE 100 index recently reversed up from the support level 8700.00 (which stopped wave 4 at the end of May, as can be seen from the daily FTSE 100 chart below) intersecting with the lower daily Bollinger B

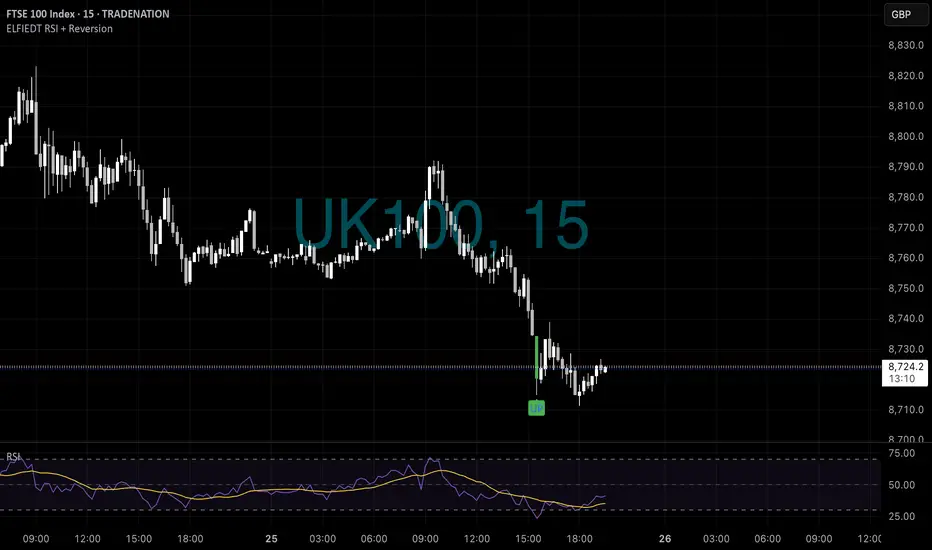
UK100 - Long?📈 Possible Scenarios After the “UP” Signal on FTSE 100 (UK100):
✅ Scenario 1: Reversion Rally (Most Probable Based on the Indicator)
The “UP” label suggests the system has detected short-term exhaustion to the downside.
Price may now revert higher toward the previous breakdown zone (~8,740–8,755),
FTSE uptrend pause capped at 8854The FTSE remains in a bullish trend, with recent price action showing signs of a corrective pullback within the broader uptrend.
Support Zone: 8695 – a key level from previous consolidation. Price is currently testing or approaching this level.
A bullish rebound from 8695 would confirm ongoing ups

FTSE pivotal level at 8854The FTSE remains in a bullish trend, with recent price action showing signs of a corrective pullback within the broader uptrend.
Support Zone: 8695 – a key level from previous consolidation. Price is currently testing or approaching this level.
A bullish rebound from 8695 would confirm ongoing ups

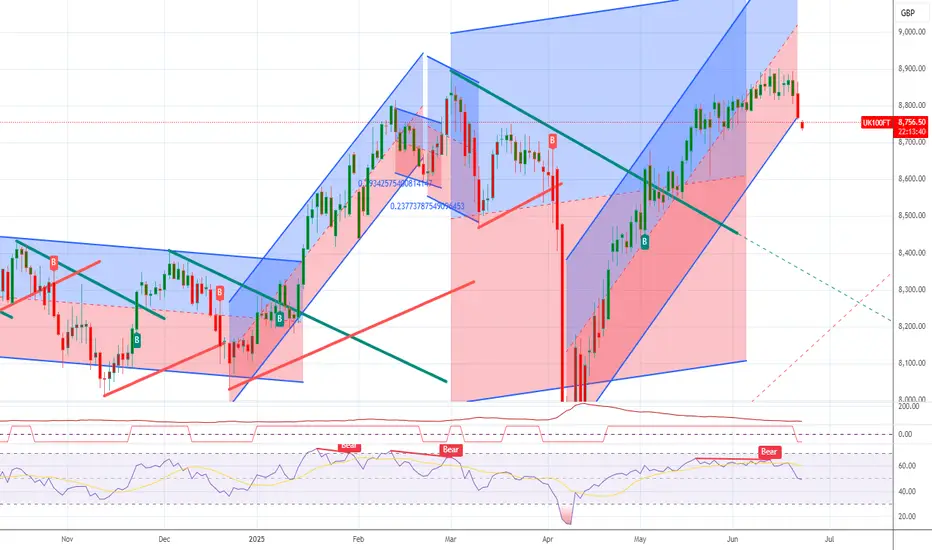
FSTE100 ShortUK100 is now net short on the regression break.
I am not taking this trade but keeping an eye on stock markets after the large run at has been achieved over the last 3 months.
UK100 Bearish Setup Developing📉 Weekly Overview:
Price is currently held by a significant weekly resistance level. Last week formed bearish price action, indicating potential exhaustion from buyers and room for sellers to step in.
📉 Daily Chart:
Although no strong momentum candle yet, price has already broken internal bullis
See all ideas
Summarizing what the indicators are suggesting.
Oscillators
Neutral
SellBuy
Strong sellStrong buy
Strong sellSellNeutralBuyStrong buy
Oscillators
Neutral
SellBuy
Strong sellStrong buy
Strong sellSellNeutralBuyStrong buy
Summary
Neutral
SellBuy
Strong sellStrong buy
Strong sellSellNeutralBuyStrong buy
Summary
Neutral
SellBuy
Strong sellStrong buy
Strong sellSellNeutralBuyStrong buy
Summary
Neutral
SellBuy
Strong sellStrong buy
Strong sellSellNeutralBuyStrong buy
Moving Averages
Neutral
SellBuy
Strong sellStrong buy
Strong sellSellNeutralBuyStrong buy
Moving Averages
Neutral
SellBuy
Strong sellStrong buy
Strong sellSellNeutralBuyStrong buy
Displays a symbol's price movements over previous years to identify recurring trends.
Frequently Asked Questions
The current value of FTSE 100 Index is 8,738.69 GBP — it has fallen by −0.32% in the past 24 hours. Track the index more closely on the FTSE 100 Index chart.
FTSE 100 Index reached its highest quote on Mar 3, 2025 — 8,908.82 GBP. See more data on the FTSE 100 Index chart.
The lowest ever quote of FTSE 100 Index is 1,717.70 GBP. It was reached on Sep 9, 1988. See more data on the FTSE 100 Index chart.
FTSE 100 Index value has decreased by −0.05% in the past week, since last month it has shown a 0.62% increase, and over the year it's increased by 7.04%. Keep track of all changes on the FTSE 100 Index chart.
The champion of FTSE 100 Index is LSE:CCEP — it's gained 9.80 K% over the year.
The weakest component of FTSE 100 Index is LSE:GLEN — it's lost −36.41% over the year.
FTSE 100 Index is just a number that lets you track performance of the instruments comprising the index, so you can't invest in it directly. But you can buy FTSE 100 Index futures or funds or invest in its components.
The FTSE 100 Index is comprised of 100 instruments including LSE:AZN, LSE:HSBA, LSE:SHEL and others. See the full list of FTSE 100 Index components to find more opportunities.